- Preface
- Using the WAAS Command-Line Interface
- Cisco WAAS Software Command Summary
- CLI Commands
- EXEC Mode Commands
- Configuration Mode Commands
- Interface Configuration Mode Commands
- Standard ACL Configuration Mode Commands
- Extended ACL Configuration Mode Commands
- Acronyms and Abbreviations
- CLI Command Summary by Mode
Cisco Wide Area Application Services Command Reference (Software Version 4.0.19)
Bias-Free Language
The documentation set for this product strives to use bias-free language. For the purposes of this documentation set, bias-free is defined as language that does not imply discrimination based on age, disability, gender, racial identity, ethnic identity, sexual orientation, socioeconomic status, and intersectionality. Exceptions may be present in the documentation due to language that is hardcoded in the user interfaces of the product software, language used based on RFP documentation, or language that is used by a referenced third-party product. Learn more about how Cisco is using Inclusive Language.
- Updated:
- June 13, 2008
Chapter: EXEC Mode Commands
- cd
- cifs
- clear
- clear users
- clock
- cms
- cms secure-store
- configure
- copy cdrom
- copy compactflash
- copy disk
- copy ftp
- copy http
- copy running-config
- copy startup-config
- copy sysreport
- copy system-status
- copy tech-support
- copy tftp
- cpfile
- debug
- delfile
- deltree
- dir
- disable
- disk
- dnslookup
- enable
- exit
- find-pattern
- help
- install
- less
- lls
- ls
- mkdir
- mkfile
- ntpdate
- ping
- pwd
- reload
- rename
- restore
- rmdir
- scp
- script
- setup
- show aaa accounting
- show adapter
- show alarms
- show arp
- show authentication
- show auto-register
- show banner
- show bypass
- show cdp
- show cifs
- show clock
- show cms
- show cms secure-store
- show debugging
- show device-mode
- show disks
- show egress-methods
- show flash
- show hardware
- show hosts
- show inetd
- show interface
- show inventory
- show ip access-list
- show ip routes
- show kerberos
- show key-manager
- show logging
- show memory
- show ntp
- show policy-engine application
- show policy-engine status
- show print-services
- show processes
- show radius-server
- show running-config
- show services
- show smb-conf
- show snmp
- show ssh
- show standby
- show startup-config
- show statistics authentication
- show statistics cifs
- show statistics content-distribution-network
- show statistics dre
- show statistics dre connection
- show statistics dre peer
- show statistics epm
- show statistics flow
- show statistics icmp
- show statistics ip
- show statistics key-manager
- show statistics netstat
- show statistics radius
- show statistics services
- show statistics snmp
- show statistics tacacs
- show statistics tcp
- show statistics tfo
- show statistics udp
- show statistics wccp
- show statistics windows-domain
- show sysfs volumes
- show tacacs
- show tcp
- show tech-support
- show telnet
- show tfo accelerators
- show tfo auto-discovery
- show tfo bufpool
- show tfo connection
- show tfo egress-methods connection
- show tfo filtering
- show tfo status
- show tfo synq
- show transaction-logging
- show user
- show users administrative
- show version
- show wccp
- show windows-domain
- shutdown
- snmp trigger
- ssh
- tcpdump
- telnet
- terminal
- tethereal
- traceroute
- transaction-log
- type
- type-tail
- undebug
- wafs
- whoami
- windows-domain
- write
EXEC Mode Commands
Use the EXEC mode for setting, viewing, and testing system operations. In general, the user EXEC commands allow you to connect to remote devices, change terminal line settings on a temporary basis, perform basic tests, and list system information.
The EXEC mode is divided into two access levels: user and privileged.
The user EXEC mode is used by local and general system administrators, while the privileged EXEC mode is used by the root administrator. Use the enable and disable commands to switch between the two levels. Access to the user-level EXEC command line requires a valid password.
The user-level EXEC commands are a subset of the privileged-level EXEC commands. The user-level EXEC prompt is the hostname followed by a right angle bracket (>). The prompt for the privileged-level EXEC command line is the pound sign (#). To execute an EXEC command, enter the command at the EXEC system prompt and press the Return key.

Note ![]() You can change the hostname using the hostname global configuration command.
You can change the hostname using the hostname global configuration command.
In the following example, a user accesses the privileged-level EXEC command line from the user level:
WAE> enable
WAE#
To leave EXEC mode, use the exit command at the system prompt:
WAE# exit
WAE>
cd
To change from one directory to another directory in the WAAS software, use the cd EXEC command.
cd directoryname
Syntax Description
directoryname |
Directory name. |
Defaults
No default behavior or values
Command Modes
EXEC
Device Modes
application-accelerator
replication-accelerator
central-manager
Usage Guidelines
Use this command to navigate between directories and for file management. The directory name becomes the default prefix for all relative paths. Relative paths do not begin with a slash (/). Absolute paths begin with a slash (/).
Examples
The following example shows how to change to a directory using a relative path:
WAE(config)# cd local1
The following example shows how to change to a directory using an absolute path:
WAE(config)# cd /local1
Related Commands
cifs
To control CIFS adapter operations and run-time configurations, use the cifs EXEC command.
cifs {auto-discovery {disable | enable | reset-log} | mss value | restart [core | edge] | reverse-dns {active | disable | enable} | session disconnect [client-ip ipaddress | server-ip ipaddress]}
Syntax Description
Defaults
No default behavior or values
Command Modes
EXEC
Device Modes
application-accelerator
Usage Guidelines
Use the cifs restart command to restart the WAFS services for a configuration change without having to reboot the WAE.
Related Commands
clear
To clear the hardware interface, statistics, and other settings, use the clear EXEC command.
clear arp-cache [ipaddress | interface {GigabitEthernet 1-2/port | PortChannel 1-2 | Standby 1-4}]
clear cache dre
clear cdp {counters | table}
clear ip access-list counters [acl-num | acl-name]
clear logging
clear statistics {all | authentication | epm | flow monitor tcpstat-v1 | history | icmp | inline | ip | radius | running | tacacs | tcp | udp | windows-domain}
clear statistics dre [connection | global | nack | peer]
clear statistics tfo {all | auto-discovery | blacklist | filtering | peer | policy-engine | synq}
clear windows-domain-log
Syntax Description
Defaults
No default behavior or values
Command Modes
EXEC
Device Modes
application-accelerator
replication-accelerator
central-manager
Usage Guidelines
After you use the clear cache dre command, the first 1 MB of data is not optimized. Cisco WAAS does not optimize the first 1 MB of data after a restart of the tcpproxy service. Data transmitted after the first 1 MB of data will be optimized according to the configured policy.
The clear logging command removes all current entries from the syslog.txt file, but does not make an archive of the file. It puts a "Syslog cleared" message in the syslog.txt file to indicate that the syslog has been cleared, as shown in the following example:
Feb 14 12:17:18 WAE# exec_clear_logging:Syslog cleared
The clear statistics command clears all statistical counters from the parameters given. Use this command to monitor fresh statistical data for some or all features without losing cached objects or configurations.
The clear windows-domain-log command removes all current entries from the Windows domain log file.
Examples
The following example clears all entries in the syslog.txt file on the WAAS device:
WAE# clear logging
The following example clears all authentication, RADIUS and TACACS+ information on the WAAS device:
WAE# clear statistics radius
WAE# clear statistics tacacs
WAE# clear statistics authentication
The following example clears all entries in the Windows domain log file on the WAAS device:
WAE# clear windows-domain-log
Related Commands
clear users
To clear user connections or to unlock users that have been locked out, use the clear users EXEC command.
clear users [administrative | locked-out {all | username username}]
Syntax Description
Defaults
No default behavior or values.
Command Modes
EXEC
Device Modes
application-accelerator
replication-accelerator
central-manager
Usage Guidelines
The clear users administrative command clears the connections for all administrative users who are authenticated through a remote login service, such as TACACS. This command does not affect an administrative user who is authenticated through the local database.
The clear users locked-out command unlocks user accounts that have been locked out. If strong password policy is enable (see (config) authentication strict-password-policy) a user account will be locked out if the user fails three consecutive login attempts. (This does not apply to the "admin" account.)
Examples
The following example clears the connections of all authenticated users:
WAE(config)# clear users
The following example clears the connections of all administrative users authenticated through a remote login service (it does not affect administrative users authenticated through the local database):
WAE(config)# clear users administrative
The following example unlocks all locked-out user accounts:
WAE(config)# clear users locked-out all
The following example unlocks the account for username darcy:
WAE(config)# clear users locked-out username darcy
Related Commands
(config) authentication strict-password-policy
clock
To set clock functions or update the calendar, use the clock EXEC command. To clear clock functions and calendar, use the no form of this command.
clock {read-calendar | set time day month year | update-calendar}
Syntax Description
Defaults
No default behavior or values
Command Modes
EXEC
Device Modes
application-accelerator
replication-accelerator
central-manager
Usage Guidelines
If you have an outside source on your network that provides time services (such as a NTP server), you do not need to set the system clock manually. When setting the clock, enter the local time. The WAAS device calculates the UTC based on the time zone set by the clock timezone global configuration command.
Two clocks exist in the system: the software clock and the hardware clock. The software uses the software clock. The hardware clock is used only at bootup to initialize the software clock.
The set keyword sets the software clock.
Examples
The following example sets the software clock on the WAAS device:
WAE# clock set 13:32:00 01 February 2005
Related Commands
cms
To configure the Centralized Management System (CMS) embedded database parameters for a WAAS device, use the cms EXEC command.
cms {config-sync | database {backup | create | delete | downgrade [script filename] |
lcm {enable | disable} | maintenance {full | regular} | restore filename | validate} | deregister [force] | recover {identity word}}
Syntax Description
Defaults
No default behavior or values
Command Modes
EXEC
Device Modes
application-accelerator
replication-accelerator
central-manager
Usage Guidelines
The WAAS network is a collection of WAAS device and WAAS Central Manager nodes. One primary WAAS Central Manager retains the WAAS network settings and provides other WAAS network nodes with updates. Communication between nodes occurs over secure channels using the Secure Shell Layer (SSL) protocol, where each node on the WAAS network uses a Rivest, Shamir, Adelman (RSA) certificate-key pair to communicate with other nodes.
Use the cms config-sync command to enable registered WAAS devices and standby WAAS Central Manager to contact the primary WAAS Central Manager immediately for a getUpdate (get configuration poll) request before the default polling interval of 5 minutes. For example, when a node is registered with the primary WAAS Central Manager and activated, it appears as Pending in the WAAS Central Manager GUI until it sends a getUpdate request. The cms config-sync command causes the registered node to send a getUpdate request at once, and the status of the node changes as Online.
Use the cms database create command to initialize the CMS database. Before a node can join a WAAS network, it must first be registered and then activated. The cms enable global configuration command automatically registers the node in the database management tables and enables the CMS. The node sends its attribute information to the WAAS Central Manager over the SSL protocol and then stores the new node information. The WAAS Central Manager accepts these node registration requests without admission control and replies with registration confirmation and other pertinent security information required for getting updates. Activate the node using the WAAS Central Manager GUI.
Once the node is activated, it automatically receives configuration updates and the necessary security RSA certificate-key pair from the WAAS Central Manager. This security key allows the node to communicate with any other node in the WAAS network. The cms deregister command removes the node from the WAAS network by deleting registration information and database tables.
To back up the existing management database for the WAAS Central Manager, use the cms database backup command. For database backups, specify the following items:
•![]() Location, password, and user ID
Location, password, and user ID
•![]() Dump format in PostgreSQL plain text syntax
Dump format in PostgreSQL plain text syntax
The naming convention for backup files includes the time stamp.
Note ![]() For information on the procedure to back up and restore the CMS database on the WAAS Central Manager, see the Cisco Wide Area Application Services Configuration Guide.
For information on the procedure to back up and restore the CMS database on the WAAS Central Manager, see the Cisco Wide Area Application Services Configuration Guide.
When you use the cms recover identity word command when recovering lost registration information, or replacing a failed node with a new node that has having the same registration information, you must specify the device recovery key that you configured in the Modifying Config Property, System.device.recovery.key window of the WAAS Central Manager GUI.
Use the lcm command to configure local/central management (LCM) on a WAE. The LCM feature allows settings that are configured using the device CLI or GUI to be stored as part of the WAAS network-wide configuration data (enable or disable).
When you enter the cms lcm enable command, the CMS process running on WAEs and the standby WAAS Central Manager detects the configuration changes that you made on these devices using CLIs and sends the changes to the primary WAAS Central Manager.
When you enter the cms lcm disable command, the CMS process running on the WAEs and the standby WAAS Central Manager does not send the CLI changes to the primary WAAS Central Manager. Settings configured using the device CLIs will not be sent to the primary WAAS Central Manager.
If LCM is disabled, the settings configured through the WAAS Central Manager GUI will overwrite the settings configured from the WAEs; however, this rule applies only to those local device settings that have been overwritten by the WAAS Central Manager when you have configured the local device settings. If you (as the local CLI user) change the local device settings after the particular configuration has been overwritten by the WAAS Central Manager, the local device configuration will be applicable until the WAAS Central Manager requests a full device statistics update from the WAEs (clicking the Force full database update button from the Device Home window of the WAAS Central Manager GUI triggers a full update). When the WAAS Central Manager requests a full update from the device, the WAAS Central Manager settings will overwrite the local device settings.
Examples
The following example backs up the cms database management tables on the WAAS Central Manager named waas-cm:
waas-cm# cms database backup
creating backup file with label `backup'
backup file local1/acns-db-9-22-2002-17-36.dump is ready. use `copy' commands to move the
backup file to a remote host.
The following example validates the cms database management tables on the WAAS Central Manager named waas-cm:
waas-cm# cms database validate
Management tables are valid
Related Commands
cms secure-store
To configure secure store encryption, use the cms secure-store commands.
cms secure-store {init | open | change | clear}
Syntax Description
Defaults
The standard encryption and key management is the default.
Command Modes
EXEC
Device Modes
application-accelerator
replication-accelerator
central-manager
Usage Guidelines
Secure storage encryption provides stronger encryption and key management for your WAAS system. The WAAS Central Manager and WAE devices use secure storage encryption for handling passwords, managing encryption keys, and for data encryption.
When you use the cms secure-store EXEC command to enable secure store on the Central Manager, or a WAE device, the WAAS system uses strong encryption algorithms and key management policies to protect certain data on the system. This data includes encryption keys used by applications in the WAAS system, CIFS passwords, and user login passwords.
When secure store is enabled on Central Manager, the data is encrypted using an key encryption key generated from the pass phrase you enter with SHA-1 hashing and an AES 256-bit algorithm. When secure store is enabled on a WAE device, the data is encrypted using a 256-bit key encryption key generated by SecureRandom, a cryptographically strong pseudorandom number. You must enter a password to enable secure store. You must enter this password through the console terminal every time the Central Manager is rebooted.
When you enable secure store on a WAE, The WAE initializes and retrieves a new encryption key from the Central Manager. The WAE uses this key to encrypt WAFS password credentials stored on the WAE, and to encrypt the disk if disk encryption is also enabled. When you reboot the WAE after enabling secure store, the WAE retrieves the key from the Central Manager automatically, allowing normal access to the data that is stored in WAAS persistent storage.
Examples
The following example shows how to initialize and activate secure store encryption on the WAAS Central Manager:
waas-cm# cms secure-store init
enter pass-phrase(case-sensitive, no less than 8 characters)*********
re-enter pass-phrase*********
successfully initialized secure-store.
waas-cm#cms secure-store open
stopping cms..stopped
stopping keymgr..stopped.
enter pass-phrase: <pass phrase>
successfully updated cifs password in database.
successfully opened secure-store.
starting cms..started.
starting keymgr..started.
waas-cm#
The following example shows how to deactivates secure store encryption:
waas-cm#cms secure-store clear
stopping cms..stopped
stopping keymgr..stopped.
successfully updated cifs password in database.
secure-store clear
starting cms..started.
starting keymgr..started.
waas-cm#
Related CommandsRelated Commands
configure
To enter global configuration mode, use the configure EXEC command. You must be in global configuration mode to enter global configuration commands.
configure
To exit global configuration mode, use the end or exit commands. You can also press Ctrl-Z to exit from global configuration mode.
Syntax Description
This command has no arguments or keywords.
Defaults
No default behavior or values
Command Modes
EXEC
Device Modes
application-accelerator
replication-accelerator
central-manager
Usage Guidelines
Use this command to enter global configuration mode.
Examples
The following example shows how to enable global configuration mode on a WAAS device:
WAE# configure
WAE(config)#
Related Commands
copy cdrom
To copy software release files from a CD-ROM, use the copy cdrom EXEC command.
copy cdrom install filedir filename
Syntax Description
cdrom |
Copies a file from the CD-ROM. |
install |
Installs the software release file. |
filedir |
Directory location of the software release file. |
filename |
Filename of the software release file. |
Defaults
No default behaviors or values
Command Modes
EXEC
Device Modes
application-accelerator
replication-accelerator
central-manager
Related Commands
copy compactflash
To copy software release files from a CompactFlash card, use the copy compactflash EXEC command.
copy compactflash install filename
Syntax Description
compactflash |
Copies a file from the CompactFlash card. |
install |
Installs a software release file. |
filename |
Image filename. |
Defaults
No default behaviors or values
Command Modes
EXEC
Device Modes
application-accelerator
replication-accelerator
central-manager
Related Commands
copy disk
To copy the configuration or image data from a disk to a remote location using FTP or to the startup configuration, use the copy disk EXEC command.
copy disk {ftp {hostname | ip-address} remotefiledir remotefilename localfilename | startup-config filename}
Syntax Description
Defaults
No default behaviors or values
Command Modes
EXEC
Device Modes
application-accelerator
replication-accelerator
central-manager
Usage Guidelines
Use the copy disk ftp EXEC command to copy files from a SYSFS partition to an FTP server. Use the copy disk startup-config EXEC command to copy a startup configuration file to NVRAM.
Related Commands
copy ftp
To copy software configuration or image data from an FTP server, use the copy ftp EXEC command.
copy ftp {central {hostname | ip-address} remotefiledir remotefilename slotnumber [username username password | proxy {hostname | ip-address} proxy_portnum [username username password] | port port-num | md5 md5sum] | disk {hostname | ip-address} remotefiledir remotefilename localfilename | install {hostname | ip-address} remotefiledir remotefilename}
Syntax Description
Defaults
No default behaviors or values
Command Modes
EXEC
Device Modes
application-accelerator
replication-accelerator
central-manager
Usage Guidelines
Use the copy ftp disk EXEC command to copy a file from an FTP server to a SYSFS partition on the WAAS device.
Use the copy ftp install EXEC command to install an image file from an FTP server on a WAAS device. Part of the image goes to disk and part goes to flash memory. Use the copy ftp central EXEC command to download a software image into the repository from an FTP server.
You can also use the copy ftp install EXEC commands to redirect your transfer to a different location. A username and a password have to be authenticated with a primary domain controller (PDC) before the transfer of the software release file to the WAAS device is allowed.
Upgrading the BIOS
You can remotely upgrade the BIOS on the WAE-511, WAE-512, WAE-611, WAE-612, and the WAE-7326. All computer hardware has to work with software through an interface. The Basic Input Output System (BIOS) provides such an interface. It gives the computer a built-in starter kit to run the rest of the software from the hard disk drive. The BIOS is responsible for booting the computer by providing a basic set of instructions. It performs all the tasks that need to be done at start-up time, such as Power-On Self Test (POST) operations and booting the operating system from the hard disk drive. Furthermore, it provides an interface between the hardware and the operating system in the form of a library of interrupt handlers. For instance, each time a key is pressed, the CPU performs an interrupt to read that key, which is similar for other input/output devices, such as serial and parallel ports, video cards, sound cards, hard disk controllers, and so forth. Some older PCs cannot interoperate with all the modern hardware because their BIOS does not support that hardware; the operating system cannot call a BIOS routine to use it. This problem can be solved by replacing the BIOS with a newer one that does support your new hardware or by installing a device driver for the hardware.
All BIOS files needed for a particular hardware model BIOS update are available on Cisco.com as a single .bin package file. This file is a special <WAAS-installable>.bin file that you can install by using the normal software update procedure.
To update the BIOS version on a WAAS device that supports BIOS version updates, you need the following items:
•![]() FTP server with the software files
FTP server with the software files
•![]() Network connectivity between the device to be updated and the server hosting the update files
Network connectivity between the device to be updated and the server hosting the update files
•![]() Appropriate .bin BIOS update file:
Appropriate .bin BIOS update file:
–![]() 511_bios.bin
511_bios.bin
–![]() 611_bios.bin
611_bios.bin
–![]() 7326_bios.bin
7326_bios.bin

To remotely install a BIOS update file, use the copy ftp install EXEC command as follows:
WAE# copy ftp install ftp-server remote_file_dir 7326_bios.bin
After the BIOS update file is copied to your system, use the reload EXEC command to reboot as follows:
WAE# reload
The new BIOS takes effect after the system reboots.
Examples
The following example shows how to copy an image file from an FTP server and install the file on the local device:
WAE# copy ftp install 10.1.1.1 //ftp-sj.cisco.com/cisco/waas/4.0 WAAS-4.0.0-k9.bin
Enter username for remote ftp server:biff
Enter password for remote ftp server:*****
Initiating FTP download...
printing one # per 1MB downloaded
Sending:USER biff
10.1.1.1 FTP server (Version) Mon Feb 28 10:30:36 EST
2000) ready.
Password required for biff.
Sending:PASS *****
User biff logged in.
Sending:TYPE I
Type set to I.
Sending:PASV
Entering Passive Mode (128,107,193,244,55,156)
Sending:CWD //ftp-sj.cisco.com/cisco/waas/4.0
CWD command successful.
Sending PASV
Entering Passive Mode (128,107,193,244,55,156)
Sending:RETR WAAS-4.0.0-k9.bin
Opening BINARY mode data connection for ruby.bin (87376881 bytes).
###################################################################################
writing flash component:
.................................................................
The new software will run after you reload.
The following example shows how to upgrade the BIOS. All output is written to a separate file (/local1/.bios_upgrade.txt) for traceability. The hardware dependant files that are downloaded from Cisco.com for the BIOS upgrade are automatically deleted from the WAAS device after the BIOS upgrade procedure has been completed.
WAE-7326# copy ftp install upgradeserver /bios/update53/derived/ 7326_bios.bin
Enter username for remote ftp server:myusername
Enter password for remote ftp server:*****
Initiating FTP download...
printing one # per 1MB downloaded
Sending:USER myusername
upgradeserver.cisco.com FTP server (Version wu-2.6.1-18) ready.
Password required for myusername.
Sending:PASS ********
Please read the file README_dotfiles
it was last modified on Wed Feb 19 16:10:26 2005- 94 days ago
Please read the file README_first
it was last modified on Wed Feb 19 16:05:29 2005- 94 days ago
User myusername logged in.
Sending:TYPE I
Type set to I.
Sending:PASV
Entering Passive Mode (128,107,193,240,57,37)
Sending:CWD /bios/update53/derived/
CWD command successful.
Sending PASV
Entering Passive Mode (128,107,193,240,146,117)
Sending:RETR 7326_bios.bin
Opening BINARY mode data connection for 7326_bios.bin (834689 bytes).
Fri Jan 7 15:29:07 UTC 2005
BIOS installer running!
Do not turnoff the system till BIOS installation is complete.
Flash chipset:Macronix 29LV320B
0055000.FLS:280000 [80000]
Erasing block 2f:280000 - 28ffff
Erasing block 30:290000 - 29ffff
Erasing block 31:2a0000 - 2affff
Erasing block 32:2b0000 - 2bffff
Erasing block 33:2c0000 - 2cffff
Erasing block 34:2d0000 - 2dffff
Erasing block 35:2e0000 - 2effff
Erasing block 36:2f0000 - 2fffff
Programming block 2f:280000 - 28ffff
Programming block 30:290000 - 29ffff
Programming block 31:2a0000 - 2affff
Programming block 32:2b0000 - 2bffff
Programming block 33:2c0000 - 2cffff
Programming block 34:2d0000 - 2dffff
Programming block 35:2e0000 - 2effff
Programming block 36:2f0000 - 2fffff
SCSIROM.BIN:260000 [20000]
Erasing block 2d:260000 - 26ffff
Erasing block 2e:270000 - 27ffff
Programming block 2d:260000 - 26ffff
Programming block 2e:270000 - 27ffff
PXEROM.BIN:250000 [10000]
Erasing block 2c:250000 - 25ffff
Programming block 2c:250000 - 25ffff
Primary BIOS flashed successfully
Cleanup BIOS related files that were downloaded....
The new software will run after you reload.
WAE-7326#
Related Commands
copy http
To copy configuration or image files from an HTTP server to the WAAS device, use the copy http EXEC command.
copy http install {hostname | ip-address}remotefiledir remotefilename [port portnum] [proxy proxy_portnum] [username username password]
Syntax Description
Defaults
HTTP server port: 80
Command Modes
EXEC
Device Modes
application-accelerator
replication-accelerator
central-manager
Usage Guidelines
Use the copy http install EXEC command to install an image file from an HTTP server and install it on a WAAS device. It transfers the image from an HTTP server to the WAAS device using HTTP as the transport protocol and installs the software on the device. Part of the image goes to disk and part goes to flash memory. Use the copy http central EXEC command to download a software image into the repository from an HTTP server.
You can also use the copy http install EXEC commands to redirect your transfer to a different location or HTTP proxy server, by specifying the proxy hostname | ip-address option. A username and a password have to be authenticated with a primary domain controller (PDC) before the transfer of the software release file to the WAAS device is allowed.
Upgrading the BIOS
You can remotely upgrade the BIOS on the WAE-511, WAE-512, WAE-611, WAE-612, and the WAE-7326. All computer hardware has to work with software through an interface. The Basic Input Output System (BIOS) provides such an interface. It gives the computer a built-in starter kit to run the rest of the software from the hard disk drive. The BIOS is responsible for booting the computer by providing a basic set of instructions. It performs all the tasks that need to be done at start-up time, such as Power-On Self Test (POST) operations and booting the operating system from the hard disk drive. Furthermore, it provides an interface between the hardware and the operating system in the form of a library of interrupt handlers. For instance, each time a key is pressed, the CPU performs an interrupt to read that key, which is similar for other input/output devices, such as serial and parallel ports, video cards, sound cards, hard disk controllers, and so forth. Some older PCs cannot interoperate with all the modern hardware because their BIOS does not support that hardware; the operating system cannot call a BIOS routine to use it. This problem can be solved by replacing the BIOS with a newer one that does support your new hardware or by installing a device driver for the hardware.
All BIOS files needed for a particular hardware model BIOS update are available on Cisco.com as a single .bin package file. This file is a special <WAAS-installable>.bin file that you can install by using the normal software update procedure.
To update the BIOS version on a WAAS device that supports BIOS version updates, you need the following items:
•![]() HTTP server with the software files
HTTP server with the software files
•![]() Network connectivity between the device to be updated and the server hosting the update files
Network connectivity between the device to be updated and the server hosting the update files
•![]() Appropriate .bin BIOS update file:
Appropriate .bin BIOS update file:
–![]() 511_bios.bin
511_bios.bin
–![]() 611_bios.bin
611_bios.bin
–![]() 7326_bios.bin
7326_bios.bin
To install the BIOS update file on a WAAS device, use the copy http install EXEC command as follows:
WAE# copy http install http-server remote_file_dir 7326_bios.bin
[portnumber]
After the BIOS update file is copied to your system, use the reload EXEC command to reboot the WAAS device as follows:
WAE# reload
The new BIOS takes effect after the system reboots.
Examples
The following example shows how to copy an image file from an HTTP server and install the file on the WAAS device:
WAE# copy http install 10.1.1.1 //ftp-sj.cisco.com/cisco/waas/4.0 WAAS-4.0.0-k9.bin
Enter username for remote ftp server:biff
Enter password for remote ftp server:*****
Initiating FTP download...
printing one # per 1MB downloaded
Sending:USER biff
10.1.1.1 FTP server (Version) Mon Feb 28 10:30:36 EST
2000) ready.
Password required for biff.
Sending:PASS *****
User biff logged in.
Sending:TYPE I
Type set to I.
Sending:PASV
Entering Passive Mode (128,107,193,244,55,156)
Sending:CWD //ftp-sj.cisco.com/cisco/waas/4.0
CWD command successful.
Sending PASV
Entering Passive Mode (128,107,193,244,55,156)
Sending:RETR WAAS-4.0.0-k9.bin
Opening BINARY mode data connection for ruby.bin (87376881 bytes).
###################################################################################
writing flash component:
.................................................................
The new software will run after you reload.
The following example shows how to upgrade the BIOS. All output is written to a separate file (/local1/.bios_upgrade.txt) for traceability. The hardware dependant files that are downloaded from Cisco.com for the BIOS upgrade are automatically deleted from the WAAS device after the BIOS upgrade procedure has been completed.
WAE-7326# copy ftp install upgradeserver /bios/update53/derived/ 7326_bios.bin
Enter username for remote ftp server:myusername
Enter password for remote ftp server:*****
Initiating FTP download...
printing one # per 1MB downloaded
Sending:USER myusername
upgradeserver.cisco.com FTP server (Version wu-2.6.1-18) ready.
Password required for myusername.
Sending:PASS ********
Please read the file README_dotfiles
it was last modified on Wed Feb 19 16:10:26 2005- 94 days ago
Please read the file README_first
it was last modified on Wed Feb 19 16:05:29 2005- 94 days ago
User myusername logged in.
Sending:TYPE I
Type set to I.
Sending:PASV
Entering Passive Mode (128,107,193,240,57,37)
Sending:CWD /bios/update53/derived/
CWD command successful.
Sending PASV
Entering Passive Mode (128,107,193,240,146,117)
Sending:RETR 7326_bios.bin
Opening BINARY mode data connection for 7326_bios.bin (834689 bytes).
Fri Jan 7 15:29:07 UTC 2005
BIOS installer running!
Do not turnoff the system till BIOS installation is complete.
Flash chipset:Macronix 29LV320B
0055000.FLS:280000 [80000]
Erasing block 2f:280000 - 28ffff
Erasing block 30:290000 - 29ffff
Erasing block 31:2a0000 - 2affff
Erasing block 32:2b0000 - 2bffff
Erasing block 33:2c0000 - 2cffff
Erasing block 34:2d0000 - 2dffff
Erasing block 35:2e0000 - 2effff
Erasing block 36:2f0000 - 2fffff
Programming block 2f:280000 - 28ffff
Programming block 30:290000 - 29ffff
Programming block 31:2a0000 - 2affff
Programming block 32:2b0000 - 2bffff
Programming block 33:2c0000 - 2cffff
Programming block 34:2d0000 - 2dffff
Programming block 35:2e0000 - 2effff
Programming block 36:2f0000 - 2fffff
SCSIROM.BIN:260000 [20000]
Erasing block 2d:260000 - 26ffff
Erasing block 2e:270000 - 27ffff
Programming block 2d:260000 - 26ffff
Programming block 2e:270000 - 27ffff
PXEROM.BIN:250000 [10000]
Erasing block 2c:250000 - 25ffff
Programming block 2c:250000 - 25ffff
Primary BIOS flashed successfully
Cleanup BIOS related files that were downloaded....
The new software will run after you reload.
Related Commands
copy running-config
To copy a configuration or image data from the current configuration, use the copy running-config EXEC command.
copy running-config {disk filename | startup-config | tftp {hostname | ip-address} remotefilename}
Syntax Description
Defaults
No default behaviors or values
Command Modes
EXEC
Device Modes
application-accelerator
replication-accelerator
central-manager
Usage Guidelines
Use the copy running-config EXEC command to copy the WAAS device's running system configuration to a SYSFS partition, flash memory, or TFTP server. The copy running-config startup-config EXEC command is equivalent to the write memory EXEC command.
Related Commands
copy startup-config
To copy configuration or image data from the startup configuration, use the copy startup-config EXEC command.
copy startup-config {disk filename | running-config | tftp {hostname | ip-address} remotefilename}
Syntax Description
Defaults
No default behaviors or values
Command Modes
EXEC
Device Modes
application-accelerator
replication-accelerator
central-manager
Usage Guidelines
Use the copy startup-config EXEC command to copy the startup configuration file to a TFTP server or to a SYSFS partition.
Related Commands
copy sysreport
To copy system troubleshooting information from the device, use the copy sysreport EXEC command.
copy sysreport {disk filename | ftp {hostname | ip-address} remotedirectory remotefilename | tftp {hostname | ip-address} remotefilename} [start-date {day month | month day} year [end-date {day month | month day} year]]
Syntax Description
Defaults
If end-date is not specified, today's date is used.
Command Modes
EXEC
Device Modes
application-accelerator
replication-accelerator
central-manager
Usage Guidelines
The copy sysreport command consumes significant CPU and disk resources and can adversely affect system performance while it is running.
Examples
The following example shows how to copy system information to the file mysysinfo on the local WAAS device:
WAE# copy sysreport disk mysysinfo start-date 1 April 2006 end-date April 30 2006
The following example shows how to copy system information by FTP to the file foo in the root directory of the FTP server named myserver:
WAE# copy sysreport ftp myserver / foo start-date 1 April 2006 end-date April 30 2006
Related Commands
copy system-status
To copy status information from the system for debugging, use the copy system-status EXEC command.
copy system-status disk filename
Syntax Description
system-status disk |
Copies the system status to a disk file. |
filename |
Name of the file to be created on the disk. |
Defaults
No default behaviors or values
Command Modes
EXEC
Device Modes
application-accelerator
replication-accelerator
central-manager
Usage Guidelines
Use the copy system-status EXEC command to create a file on a SYSFS partition that contains hardware and software status information.
Related Commands
copy tech-support
To copy the configuration or image data from the system to use when working with Cisco TAC, use the copy tech-support EXEC command.
copy tech-support {disk filename | tftp {hostname | ip-address} remotefilename}
Syntax Description
Defaults
No default behaviors or values
Command Modes
EXEC
Device Modes
application-accelerator
replication-accelerator
central-manager
Usage Guidelines
Use the copy tech-support tftp EXEC command to copy technical support information to a TFTP server or to a SYSFS partition.
Related Commands
copy tftp
To copy configuration or image data from a TFTP server, use the copy tftp EXEC command.
copy tftp {disk {hostname | ip-address} remotefilename localfilename | running-config
{hostname | ip-address} remotefilename | startup-config {hostname | ip-address} remotefilename}
Syntax Description
Defaults
No default behaviors or values
Command Modes
EXEC
Device Modes
application-accelerator
replication-accelerator
central-manager
Usage Guidelines
Use the copy tftp disk EXEC command to copy a file from a TFTP server to disk.
Related Commands
cpfile
To make a copy of a file, use the cpfile EXEC command.
cpfile oldfilename newfilename
Syntax Description
oldfilename |
Name of the file to copy. |
newfilename |
Name of the copy to be created. |
Defaults
No default behavior or values
Command Modes
EXEC
Device Modes
application-accelerator
replication-accelerator
central-manager
Usage Guidelines
Use this EXEC command to create a copy of a file. Only SYSFS files can be copied.
Examples
The following example shows how to create a copy of a file.
WAE# cpfile fe511-194616.bin fd511-194618.bin
Related Commands
debug
To monitor and record the WAAS application acceleration and central manager functions, use the debug EXEC command. To disable debugging, use the no form of the command. (See also the undebug command.)
In the application-accelerator device mode, the debug commands are as follows:
debug authentication {content-request | user | windows-domain}
debug buf {all | dmbuf | dmsg}
debug cdp {adjacency | events | ip | packets}
debug cli {all | bin | parser}
debug cms
debug dataserver {all | clientlib | server}
debug dhcp
debug dre {aggregation | all | cache | connection {aggregation [acl] | cache [acl] | core [acl] | message [acl] | misc [acl] | acl} | core | lz | message | misc}
debug epm
debug flow monitor tcpstat-v1
debug logging all
debug ntp
debug print-spooler {all | brief | errors | warnings}
debug rbcp
debug snmp {all | cli | main | mib | traps}
debug stats {all | collections | computation | history}
debug tfo {buffer-mgr | connection [auto-discovery [acl] | comp-mgr [acl] | conn-mgr [acl] | egress-method [acl] | filtering [acl] | netio-engine [acl] | policy-engine [acl] | synq [acl] | acl] | stat-mgr | translog}
debug translog export
debug wafs {{all | core-fe | edge-fe | manager | utilities} {debug | error | info | warn}}
debug wccp {all | detail | error | events | keepalive | packets | slowstart}
Note ![]() The dre, epm, flow monitor, print-spooler, rbcp, tfo, translog, wafs, and wccp command options are supported in the application-accelerator device mode only.
The dre, epm, flow monitor, print-spooler, rbcp, tfo, translog, wafs, and wccp command options are supported in the application-accelerator device mode only.
In the central manager device mode, the debug commands are as follows:
debug aaa accounting
debug all
debug authentication {content-request | user | windows-domain}
debug buf {all | dmbuf | dmsg}
debug cdp {adjacency | events | ip | packets}
debug cli {all | bin | parser}
debug cms
debug dataserver {all | clientlib | server}
debug dhcp
debug emdb [level [levelnum]]
debug key-manager
debug logging all
debug ntp
debug rpc {detail | trace}
debug snmp {all | cli | main | mib | traps}
debug stats {all | collections | computation | history}
Note ![]() The emdb and rpc command options are supported in the central manager device mode only.
The emdb and rpc command options are supported in the central manager device mode only.
Syntax Description
The following syntax table describes the options that are available in the central manager device mode:
Defaults
No default behavior or values
Command Modes
EXEC
Device Modes
application-accelerator
replication-accelerator
central-manager
Usage Guidelines
Because the performance of the WAAS device degrades when you use the debug command, we recommend that you use this command only at the direction of Cisco TAC. For more information, see the "Obtaining Documentation and Submitting a Service Request" section on page xvi.
If the watchdog utility is not running, the message "WAAS is not running" appears.
Use the show debugging command to display enabled debug options.
Examples
The following example shows how to enable debug monitoring of user authentication, verify it is enabled, and then disable debug monitoring:
WAE# debug authentication user
WAE# show debugging
Debug authentication (user) is ON
WAE# no debug authentication user
The following example shows how to set the logging level to debug for the Core WAEs in your system, then return the logging level to its default (info):
WAE# debug wafs ?
all log level for all components
core-fe log level for Core FE
edge-fe log level for Edge FE
manager log level for Manager
utilities log level for Utilities
WAE# debug wafs core-fe ?
debug set log level to DEBUG
error set log level to ERROR
info set log level to INFO (default)
warn set log level to WARN
WAE# debug wafs core-fe debug
corefe log level set to DEBUG
Related Commands
delfile
To delete a file from the current directory, use the delfile EXEC command.
delfile filename
Syntax Description
filename |
Name of the file to delete. |
Defaults
No default behavior or values
Command Modes
EXEC
Device Modes
application-accelerator
replication-accelerator
central-manager
Usage Guidelines
Use this EXEC command to remove a file from a SYSFS partition on the disk drive of the WAAS device.
Examples
The following example shows how to delete a temporary file from the /local1 directory using an absolute path:
WAE# delfile /local1/tempfile
Related Commands
deltree
To remove a directory along with all of its subdirectories and files, use the deltree EXEC command.
deltree directory
Syntax Description
directory |
Name of the directory tree to delete. |
Defaults
No default behavior or values
Command Modes
EXEC
Device Modes
application-accelerator
replication-accelerator
central-manager
Usage Guidelines
Use this EXEC command to remove a directory and all files within the directory from the WAAS SYSFS file system. No warning is given that you are removing the subdirectories and files.
Note ![]() Be sure you do not remove files or directories required for the WAAS device to function properly.
Be sure you do not remove files or directories required for the WAAS device to function properly.
Examples
The following example shows how to delete the testdir directory from the /local1 directory:
WAE# deltree /local1/testdir
Related Commands
dir
To view details of one file or all files in a directory, use the dir EXEC command.
dir [directory]
Syntax Description
directory |
(Optional) Name of the directory to list. |
Defaults
No default behavior or values
Command Modes
EXEC
Device Modes
application-accelerator
replication-accelerator
central-manager
Usage Guidelines
Use this EXEC command to view a detailed list of files contained within the working directory, including names, sizes, and time created. The lls EXEC command produces the same output.
Examples
The following example shows a detailed list of all the files for the current directory:
WAE# dir
size time of last change name
------------- ------------------------- -----------
4096 Fri Feb 24 14:40:00 2006 <DIR> actona
4096 Tue Mar 28 14:42:44 2006 <DIR> core_dir
4096 Wed Apr 12 20:23:10 2006 <DIR> crash
4506 Tue Apr 11 13:52:45 2006 dbupgrade.log
4096 Tue Apr 4 22:50:11 2006 <DIR> downgrade
4096 Sun Apr 16 09:01:56 2006 <DIR> errorlog
4096 Wed Apr 12 20:23:41 2006 <DIR> logs
16384 Thu Feb 16 12:25:29 2006 <DIR> lost+found
4096 Wed Apr 12 03:26:02 2006 <DIR> sa
24576 Sun Apr 16 23:38:21 2006 <DIR> service_logs
4096 Thu Feb 16 12:26:09 2006 <DIR> spool
9945390 Sun Apr 16 23:38:20 2006 syslog.txt
10026298 Thu Apr 6 12:25:00 2006 syslog.txt.1
10013564 Thu Apr 6 12:25:00 2006 syslog.txt.2
10055850 Thu Apr 6 12:25:00 2006 syslog.txt.3
10049181 Thu Apr 6 12:25:00 2006 syslog.txt.4
4096 Thu Feb 16 12:29:30 2006 <DIR> var
508 Sat Feb 25 13:18:35 2006 wdd.sh.signed
The following example shows only the detailed information for the logs directory:
WAE# dir logs
size time of last change name
------------- ------------------------- -----------
4096 Thu Apr 6 12:13:50 2006 <DIR> actona
4096 Mon Mar 6 14:14:41 2006 <DIR> apache
4096 Sun Apr 16 23:36:40 2006 <DIR> emdb
4096 Thu Feb 16 11:51:51 2006 <DIR> export
92 Wed Apr 12 20:23:20 2006 ftp_export.status
4096 Wed Apr 12 20:23:43 2006 <DIR> rpc_httpd
0 Wed Apr 12 20:23:41 2006 snmpd.log
4096 Sun Mar 19 18:47:29 2006 <DIR> tfo
Related Commands
disable
To turn off privileged EXEC commands, use the disable EXEC command.
disable
Syntax Description
This command has no arguments or keywords.
Defaults
No default behavior or values
Command Modes
EXEC
Device Modes
application-accelerator
replication-accelerator
central-manager
Usage Guidelines
Use the WAAS software CLI EXEC mode for setting, viewing, and testing system operations. This command mode is divided into two access levels, user and privileged. To access privileged-level EXEC mode, enter the enable EXEC command at the user access level prompt and specify a privileged EXEC password (superuser or admin-equivalent password) when prompted for a password.
WAE> enable
Password:
The disable command places you in the user-level EXEC shell (notice the prompt change).
Examples
The following example enters the user-level EXEC mode from the privileged EXEC mode:
WAE# disable
WAE>
Related Commands
disk
To configure disks on a WAAS device, use the disk EXEC command.
disk delete-partitions diskname
disk disk-name diskxx replace
disk insert diskname
disk recreate-raid
disk reformat diskname
disk scan-errors diskname
Command Modes
EXEC
Device Modes
application-accelerator
replication-accelerator
central-manager
Usage Guidelines
Logical Disk Handling with RAID-5
Logical disk handling with Redundant Array of Independent Disks-5 (RAID-5) is implemented in WAAS as a hardware feature. RAID-5 devices can create a single logical disk drive that may contain up to six physical hard disk drives, providing increased logical disk capacity. (The WAE-7341 supports four disks, and the WAE-7371 supports six disks.)
Systems with RAID-5 continue operating if one of the physical drives fails (RAID-5 moves the drive to the Defunct state). RAID-5 also permits hot-swapping of the disk hardware after the failed drive is properly shutdown. (For the disk removal and replacement procedure for RAID-5 systems, see the Cisco Wide Area Application Services Configuration Guide, Chapter 14.)
Logical Disk Handling with RAID-1
RAID-1 is implemented in WAAS as a software feature. A RAID-1 WAAS device can use two disk drives to increase reliability. RAID-1 provides disk mirroring (data is written redundantly to two or more drives). The goal is higher reliability through redundancy. With RAID-1, file system write performance may be affected because each disk write must be executed against two disk drives. RAID-1 (mirroring) is used for all file systems on the RAID-1 device. This setup ensures reliable execution of the software in all cases.
Note ![]() The WAAS software uses the CONTENT file system for both the Wide Area File Services (WAFS) file system and the data redundancy elimination (DRE) cache.
The WAAS software uses the CONTENT file system for both the Wide Area File Services (WAFS) file system and the data redundancy elimination (DRE) cache.
Hot Swap for WAE-612, WAE-7326, WAE-7341, and WAE-7371 Disk Drives
This release of WAAS supports hot swap functionality for both failed disk replacement and scheduled disk maintenance. On the WAE-612 and WAE-7326, use the disk disk-name diskxx shutdown global configuration command to shut down a disk for scheduled disk maintenance. On the WAE-7341 and WAE-7371, use the disk disk-name diskxx replace EXEC command to shut down a disk. (For the scheduled disk maintenance procedure, see the Cisco Wide Area Application Services Configuration Guide, Chapter 14.)
You must wait for the disk to be completely shut down before you physically remove the disk from the WAE. When the RAID removal process is complete, WAAS generates a disk failure alarm and trap. In addition, a syslog ERROR message is logged.
If the software removes a failed disk during the RAID rebuild process, a RAID rebuild failure alarm is generated. If you administratively shut down the disk during the RAID rebuild process, a RAID rebuild abort alarm is generated instead.
If the removal event occurs while the RAID is in the rebuild process, the RAID removal process may take up to one minute before it is successful. The exact duration of this process depends on the size of the disk.
Automatic Failed Disk Handling
The disk hot swap functionality automatically disables a failed disk if the system detects one critical disk alarm. The software removes the failed disk automatically regardless of the setting for disk error-handling.
Replacing a Failed Disk
For WAE-7341 and WAE-7371 models, when you replace a failed disk that was automatically disabled by the software, the disk automatically returns to service. For WAE-612 and WAE-7326 models, when you replace a failed disk that was automatically disabled by the software, use the disk insert command in EXEC mode to bring the disk back into service. For all other models, see the (config) disk disk-name command section.
Recreating the RAID-5 Disk Array
To recreate the logical disk array for RAID-5 systems, use the EXEC mode disk recreate-raid command, as shown in following configuration sequence:
WAE-7341(config)# disk logical shutdown
WAE-7341# reload
WAE-7341# copy running-config startup-config
Wait for the system to boot up.
WAE-7341# disk recreate-raid
WAE-7341(config)# no disk logical shutdown
WAE-7341# reload
WAE-7341# copy running-config startup-config
After the system boots, wait approximately half an hour for all of the filesystems to be recreated.
Reinstall the software by entering copy ftp install in EXEC mode.
For 300 GB SAS drives, recreating and synchronizing the RAID array may take up to five hours. While the RAID-5 synchronization is running in the background, the system will be fully functional; however, performance may be affected by the background operation.
Disk Information
To identify which disks have been identified as failed or bad, use the show disks failed-disk-id EXEC command. Do not reinsert any disk with a serial number shown in this list.
Note ![]() This command is not available on WAE-7341 and WAE-7371 models.
This command is not available on WAE-7341 and WAE-7371 models.
Reformatting a SCSI Disk Drive
Use the disk reformat EXEC command to reformat a SCSI disk drive on a WAAS device. The SCSI drive cannot be in use when you execute this command.
Note ![]() This command is only available on WAE-612 systems with SCSI drives. This command is removed for WAE-611 and WAE-7326 systems in WAAS 4.0.13.
This command is only available on WAE-612 systems with SCSI drives. This command is removed for WAE-611 and WAE-7326 systems in WAAS 4.0.13.
The following scenario shows how to reformat a SCSI drive:
1. ![]() Unmount the filesystem and remove the disk from the RAID-1 array by using the disk disk-name diskxx shutdown command in global configuration mode.
Unmount the filesystem and remove the disk from the RAID-1 array by using the disk disk-name diskxx shutdown command in global configuration mode.
WAE611(config)# disk disk-name disk01 shutdown
2. ![]() Reformat the disk. On completion of this command the drive is blank.
Reformat the disk. On completion of this command the drive is blank.
WAE611# disk reformat disk01
3. ![]() Bring the disk back into service by using the no disk disk-name diskxx shutdown command in global configuration mode.
Bring the disk back into service by using the no disk disk-name diskxx shutdown command in global configuration mode.
WAE611(config)# no disk disk-name disk01 shutdown
To use the disk scan errors command, follow the same procedure as for the disk reformat command.
Removing All Disk Partitions on a Single Disk Drive and
Removing the Disk Partition on the Logical Drive for RAID-5 Systems
Use the disk delete-partitions EXEC command to remove all disk partitions on a single disk drive on a WAAS device or to remove the disk partition on the logical drive for RAID-5 systems.
Use this command when you want to add a new disk drive that was previously used with another operating system (for example, a Microsoft Windows or Linux operating system). When asked if you want to erase everything on the disk, specify "yes" to proceed, as follows:
WAE# disk delete-partitions disk01
This will erase everything on disk. Are you sure? [no] yes
Note ![]() When you use the disk delete-partitions EXEC command on the WAE-7341 or WAE-7371 models, the command deletes the entire logical volume. The individual disk name option is not available on these platforms.
When you use the disk delete-partitions EXEC command on the WAE-7341 or WAE-7371 models, the command deletes the entire logical volume. The individual disk name option is not available on these platforms.
Related Commands
(config) disk logical shutdown
dnslookup
To resolve a host or domain name to an IP address, use the dnslookup EXEC command.
dnslookup {hostname | domainname}
Syntax Description
hostname |
Name of DNS server on the network. |
domainname |
Name of domain. |
Defaults
No default behavior or values
Command Modes
EXEC
Device Modes
application-accelerator
replication-accelerator
central-manager
Examples
The following three examples show how the dnslookup command is used to resolve the hostname myhost to IP address 172.31.69.11, abd.com to IP address 192.168.219.25, and an IP address used as a hostname to 10.0.11.0:
WAE# dnslookup myhost
official hostname: myhost.abc.com
address: 172.31.69.11
WAE# dnslookup abc.com
official hostname: abc.com
address: 192.168.219.25
WAE# dnslookup 10.0.11.0
official hostname: 10.0.11.0
address: 10.0.11.0
enable
To access privileged EXEC commands, use the enable EXEC command.
enable
Syntax Description
This command has no arguments or keywords.
Defaults
No default behavior or values
Command Modes
EXEC
Device Modes
application-accelerator
replication-accelerator
central-manager
Usage Guidelines
Use the WAAS software CLI EXEC mode for setting, viewing, and testing system operations. This command mode is divided into two access levels: user and privileged. To access privileged-level EXEC mode, enter the enable EXEC command at the user access level prompt and specify a privileged EXEC password (superuser or admin-equivalent password) when prompted for a password.
In TACACS+, there is an enable password feature that allows an administrator to define a different enable password per administrative-level user. If an administrative-level user logs in to the WAAS device with a normal-level user account (privilege level of 0) instead of an admin or admin-equivalent user account (privilege level of 15), that user must enter the admin password to access privileged-level EXEC mode.
WAE> enable
Password:
Note ![]() This caveat applies even if the WAAS users are using TACACS+ for login authentication.
This caveat applies even if the WAAS users are using TACACS+ for login authentication.
The disable command takes you from privileged EXEC mode to user EXEC mode.
Examples
The following example shows how to access privileged EXEC mode:
WAE> enable
WAE#
Related Commands
exit
To terminate privileged-level EXEC mode and return to the user-level EXEC mode, use the exit command.
exit
Syntax Description
This command has no arguments or keywords.
Defaults
No default behavior or values
Command Modes
All modes
Device Modes
application-accelerator
replication-accelerator
central-manager
Usage Guidelines
This command is equivalent to the Ctrl-Z or the end command. The exit command issued in the user level EXEC shell terminates the console or Telnet session.
Examples
The following example shows how to terminate privileged-level EXEC mode and return to the user-level EXEC mode:
WAE# exit
WAE>
find-pattern
To search for a particular pattern in a file, use the find-pattern command in EXEC mode.
find-pattern {binary reg-express filename | case {binary reg-express filename | count reg-express filename | lineno reg-express filename | match reg-express filename | nomatch reg-express filename | recursive reg-express filename} | count reg-express filename | lineno reg-express filename | match reg-express filename | nomatch reg-express filename | recursive reg-express filename}
Syntax Description
Defaults
No default behavior or values
Command Modes
EXEC
Device Modes
application-accelerator
replication-accelerator
central-manager
Usage Guidelines
Use this EXEC command to search for a particular regular expression pattern in a file.
Examples
The following example shows how to search a file recursively for a case-sensitive pattern:
WAE# find-pattern case recursive admin removed_core
-rw------- 1 admin root 95600640 Oct 12 10:27 /local/local1/core_dir/
core.3.0.0.b5.eh.2796
-rw------- 1 admin root 97054720 Jan 11 11:31 /local/local1/core_dir/
core.cache.3.0.0.b131.cnbuild.14086
-rw------- 1 admin root 96845824 Jan 11 11:32 /local/local1/core_dir/
core.cache.3.0.0.b131.cnbuild.14823
-rw------- 1 admin root 101580800 Jan 11 12:01 /local/local1/core_dir/
core.cache.3.0.0.b131.cnbuild.15134
-rw------- 1 admin root 96759808 Jan 11 12:59 /local/local1/core_dir/
core.cache.3.0.0.b131.cnbuild.20016
-rw------- 1 admin root 97124352 Jan 11 13:26 /local/local1/core_dir/
core.cache.3.0.0.b131.cnbuild.8095
The following example shows how to search a file for a pattern and print the matching lines:
WAE# find-pattern match 10 removed_core
Tue Oct 12 10:30:03 UTC 2004
-rw------- 1 admin root 95600640 Oct 12 10:27 /local/local1/core_dir/
core.3.0.0.b5.eh.2796
-rw------- 1 admin root 101580800 Jan 11 12:01 /local/local1/core_dir/
core.cache.3.0.0.b131.cnbuild.15134
The following example shows how to search a file for a pattern and print the number of matching lines:
WAE# find-pattern count 10 removed_core
3
Related Commands
help
To obtain online help for the command-line interface, use the help EXEC command.
help
Syntax Description
This command has no arguments or keywords.
Defaults
No default behavior or values
Command Modes
EXEC and global configuration
Device Modes
application-accelerator
replication-accelerator
central-manager
Usage Guidelines
You can obtain help at any point in a command by entering a question mark (?). If nothing matches, the help list will be empty, and you must back up until entering a ? shows the available options.
Two styles of help are provided:
•![]() Full help is available when you are ready to enter a command argument (for example, show ?) and describes each possible argument.
Full help is available when you are ready to enter a command argument (for example, show ?) and describes each possible argument.
•![]() Partial help is provided when you enter an abbreviated command and you want to know what arguments match the input (for example, show stat?).
Partial help is provided when you enter an abbreviated command and you want to know what arguments match the input (for example, show stat?).
Examples
The following example shows the output of the help EXEC command:
WAE# help
Help may be requested at any point in a command by entering a question mark '?'. If
nothing matches, the help list will be empty and you must backup until entering a '?'
shows the available options.
Two styles of help are provided:
1. Full help is available when you are ready to enter a command argument.
2. Partial help is provided when an abbreviated argument is entered.
install
To install a new software image (such as the WAAS software) into flash on the WAAS device, use the install EXEC command.
install imagefilename
Syntax Description
imagefilename |
Name of the .bin file you want to install. |
Defaults
No default behavior or values
Command Modes
EXEC
Device Modes
application-accelerator
replication-accelerator
central-manager
Usage Guidelines
The install command loads the system image into flash memory and copies components of the optional software to the software file system (swfs) partition.
Note ![]() If you are installing a system image that contains optional software, make sure that an SWFS partition is mounted on disk00.
If you are installing a system image that contains optional software, make sure that an SWFS partition is mounted on disk00.
To install a system image, copy the image file to the SYSFS directory, local1 or local2. Before executing the install command, change the present working directory to the directory where the system image resides. When the install command is executed, the image file is expanded. The expanded files overwrite the existing files on the WAAS device. The newly installed version takes effect after the system image is reloaded.
Note ![]() The install command does not accept .pax files. Files should be of the type .bin (for example, cache-sw.bin). Also, if the release being installed does not require a new system image, then it may not be necessary to write to Flash memory. If the newer version has changes that require a new system image to be installed, then the install command may result in a write to Flash memory.
The install command does not accept .pax files. Files should be of the type .bin (for example, cache-sw.bin). Also, if the release being installed does not require a new system image, then it may not be necessary to write to Flash memory. If the newer version has changes that require a new system image to be installed, then the install command may result in a write to Flash memory.
Examples
The following example loads the system image contained in the wae511-cache-300.bin file:
WAE# install wae511-cache-300.bin
Related Commands
less
To display a file using the LESS application, use the less EXEC command.
less file_name
Syntax Description
file_name |
Name of the file to be displayed. |
Defaults
No default behavior or values
Command Modes
EXEC
Device Modes
application-accelerator
replication-accelerator
central-manager
Usage Guidelines
LESS is an application that displays text files a page at a time. You can use LESS to view the contents of a file, but not edit it. LESS offers some additional features when compared to conventional text file viewer applications such as type. These features are as follows:
•![]() Backward movement—LESS allows you to move backward in the displayed text. Use k, Ctrl-k, y, or Ctrl-y to move backward. See the summary of LESS commands for more details; to view the summary, press h or H while displaying a file in LESS.
Backward movement—LESS allows you to move backward in the displayed text. Use k, Ctrl-k, y, or Ctrl-y to move backward. See the summary of LESS commands for more details; to view the summary, press h or H while displaying a file in LESS.
•![]() Searching and highlighting—LESS allows you to search for text in the file that you are viewing. You can search forward and backward. LESS highlights the text that matches your search to make it easy to see where the match is.
Searching and highlighting—LESS allows you to search for text in the file that you are viewing. You can search forward and backward. LESS highlights the text that matches your search to make it easy to see where the match is.
•![]() Multiple file support—LESS allows you to switch between different files, remembering your position in each file. You can also do a search that spans all the files you are working with.
Multiple file support—LESS allows you to switch between different files, remembering your position in each file. You can also do a search that spans all the files you are working with.
Examples
The following example shows how to display the text of the syslog.txt file using the LESS application:
WAE# less syslog.txt
lls
To view a long list of directory names, use the lls EXEC command.
lls [directory]
Syntax Description
directory |
(Optional) Name of the directory for which you want a long list of files. |
Defaults
No default behavior or values
Command Modes
EXEC
Device Modes
application-accelerator
replication-accelerator
central-manager
Usage Guidelines
This command provides detailed information about files and subdirectories stored in the present working directory (including size, date, time of creation, SYSFS name, and long name of the file). This information can also be viewed with the dir command.
Examples
The following example provides a detailed list of the files in the current directory:
WAE# lls
size time of last change name
-------------- ------------------------- -----------
4096 Fri Feb 24 14:40:00 2006 <DIR> actona
4096 Tue Mar 28 14:42:44 2006 <DIR> core_dir
4096 Wed Apr 12 20:23:10 2006 <DIR> crash
4506 Tue Apr 11 13:52:45 2006 dbupgrade.log
4096 Tue Apr 4 22:50:11 2006 <DIR> downgrade
4096 Sun Apr 16 09:01:56 2006 <DIR> errorlog
4096 Wed Apr 12 20:23:41 2006 <DIR> logs
16384 Thu Feb 16 12:25:29 2006 <DIR> lost+found
4096 Wed Apr 12 03:26:02 2006 <DIR> sa
24576 Sun Apr 16 23:54:30 2006 <DIR> service_logs
4096 Thu Feb 16 12:26:09 2006 <DIR> spool
9951236 Sun Apr 16 23:54:20 2006 syslog.txt
10026298 Thu Apr 6 12:25:00 2006 syslog.txt.1
10013564 Thu Apr 6 12:25:00 2006 syslog.txt.2
10055850 Thu Apr 6 12:25:00 2006 syslog.txt.3
10049181 Thu Apr 6 12:25:00 2006 syslog.txt.4
4096 Thu Feb 16 12:29:30 2006 <DIR> var
508 Sat Feb 25 13:18:35 2006 wdd.sh.signed
Related Commands
ls
To view a list of files or subdirectory names within a directory, use the ls EXEC command.
ls [directory]
Syntax Description
directory |
(Optional) Name of the directory for which you want a list of files. |
Defaults
No default behavior or values
Command Modes
EXEC
Device Modes
application-accelerator
replication-accelerator
central-manager
Usage Guidelines
Use the ls directory command to list the filenames and subdirectories within a particular directory.
Use the ls command to list the filenames and subdirectories of the current working directory.
Use the pwd command to view the present working directory.
Examples
The following example shows the files and subdirectories that are listed within the root directory:
WAE# ls
actona
core_dir
crash
dbupgrade.log
downgrade
errorlog
logs
lost+found
sa
service_logs
spool
syslog.txt
syslog.txt.1
syslog.txt.2
syslog.txt.3
syslog.txt.4
var
wdd.sh.signed
Related Commands
mkdir
To create a directory, use the mkdir EXEC command.
mkdir directory
Syntax Description
directory |
Name of the directory to create. |
Defaults
No default behavior or values
Command Modes
EXEC
Device Modes
application-accelerator
replication-accelerator
central-manager
Usage Guidelines
Use this EXEC command to create a new directory or subdirectory in the WAAS file system.
Examples
The following example shows how to create a new directory, oldpaxfiles:
WAE# mkdir /oldpaxfiles
Related Commands
mkfile
To create a new file, use the mkfile EXEC command.
mkfile filename
Syntax Description
filename |
Name of the file you want to create. |
Defaults
No default behavior or values
Command Modes
EXEC
Device Modes
application-accelerator
replication-accelerator
central-manager
Usage Guidelines
Use this EXEC command to create a new file in any directory of the WAAS device.
Examples
The following example shows how to create a new file, traceinfo, in the root directory:
WAE# mkfile traceinfo
Related Commands
ntpdate
To set the software clock (time and date) on a WAAS device using a NTP server, use the ntpdate EXEC command.
ntpdate {hostname | ip-address} [key {authentication-key}]
Syntax Description
Defaults
No default behavior or values
Command Modes
EXEC
Device Modes
application-accelerator
replication-accelerator
central-manager
Usage Guidelines
Use NTP to find the current time of day and set the current time on the WAAS device to match. The time must be saved to the hardware clock using the clock save command if it is to be restored after a reload.
Examples
The following example shows how to set the software clock on the WAAS device using an NTP server:
WAE# ntpdate 10.11.23.40
Related Commands
ping
To send echo packets for diagnosing basic network connectivity on networks, use the ping EXEC command.
ping {hostname | ip-address}
Syntax Description
hostname |
Hostname of system to ping. |
ip-address |
IP address of system to ping. |
Defaults
No default behavior or values
Command Modes
EXEC
Device Modes
application-accelerator
replication-accelerator
central-manager
Usage Guidelines
To use this command with the hostname argument, be sure that DNS functionality is configured the WAAS device. To force the timeout of a nonresponsive host, or to eliminate a loop cycle, press Ctrl-C.
Examples
The following example shows how to send echo packets to a machine with address 172.19.131.189 to verify its availability on the network:
WAE# ping 172.19.131.189
PING 172.19.131.189 (172.19.131.189) from 10.1.1.21 : 56(84) bytes of
data.
64 bytes from 172.19.131.189: icmp_seq=0 ttl=249 time=613 usec
64 bytes from 172.19.131.189: icmp_seq=1 ttl=249 time=485 usec
64 bytes from 172.19.131.189: icmp_seq=2 ttl=249 time=494 usec
64 bytes from 172.19.131.189: icmp_seq=3 ttl=249 time=510 usec
64 bytes from 172.19.131.189: icmp_seq=4 ttl=249 time=493 usec
--- 172.19.131.189 ping statistics ---
5 packets transmitted, 5 packets received, 0% packet loss
round-trip min/avg/max/mdev = 0.485/0.519/0.613/0.047 ms
WAE#
pwd
To view the present working directory on a WAAS device, use the pwd EXEC command.
pwd
Syntax Description
This command has no arguments or keywords.
Defaults
No default behavior or values
Command Modes
EXEC
Device Modes
application-accelerator
replication-accelerator
central-manager
Usage Guidelines
Use this EXEC command to display the present working directory of the WAAS device.
Examples
The following example shows how to display the current working directory:
WAE# pwd
/local1
Related Commands
reload
To halt and perform a cold restart on a WAAS device, use the reload EXEC command.
reload [force]
Syntax Description
force |
(Optional) Forces a reboot without further prompting. |
Defaults
No default behavior or values
Command Modes
EXEC
Device Modes
application-accelerator
replication-accelerator
central-manager
Usage Guidelines
To reboot a WAAS device, use the reload command. If no configurations are saved to flash memory, you are prompted to enter configuration parameters upon restart. Any open connections are dropped after you issue this command, and the file system is reformatted upon restart.
Examples
The following example shows how to halt operation of the WAAS device and reboot it with the configuration saved in flash memory. You are not prompted for confirmations during the process.
WAE# reload force
Related Commands
rename
To rename a file on a WAAS device, use the rename EXEC command.
rename oldfilename newfilename
Syntax Description
oldfilename |
Original filename. |
newfilename |
New filename. |
Defaults
No default behavior or values
Command Modes
EXEC
Device Modes
application-accelerator
replication-accelerator
central-manager
Usage Guidelines
Use this command to rename any SYSFS file without making a copy of the file.
Examples
The following example shows how to rename the errlog.txt file to old_errlog.txt:
WAE# rename errlog.txt old_errlog.txt
Related Commands
restore
To restore the device to its manufactured default status, removing user data from disk and flash memory, use the restore EXEC command.
restore {factory-default [preserve basic-config] | rollback}
Syntax Description
Defaults
No default behavior or values
Command Modes
EXEC
Device Modes
application-accelerator
replication-accelerator
central-manager
Usage Guidelines
Use this EXEC command to restore data on disk and in flash memory to the factory default, while preserving particular time stamp evaluation data, or to roll back the configuration to the last functional data and device configuration.
This command erases all existing content on the device; however, your network settings are preserved and the device is accessible through a Telnet and Secure Shell (SSH) session after it reboots.
Backing up the Central Manager Database
Before you use the restore factory-default command on your primary WAAS Central Manager or change over from the primary to a standby WAAS Central Manager, be sure to back up the WAAS Central Manager database and copy the backup file to a safe location that is separate from that of the WAAS Central Manager. You must halt the operation of the WAAS Central Manager before you enter the backup and restore commands.
By removing the WAAS Central Manager database, all configuration records for the entire WAAS network are deleted. If you do not have a valid backup file or a standby WAAS Central Manager, you must reregister every WAE with the WAAS Central Manager because all previously configured data is lost.
If you used your standby WAAS Central Manager to store the database while you reconfigured the primary, you can simply register the former primary as a new standby WAAS Central Manager.
If you created a backup file while you configured the primary WAAS Central Manager, you can copy the backup file to this newly reconfigured WAAS Central Manager.
Rolling Back the Configuration
You can roll back the software and configuration of a WAAS device to a previous version using the restore rollback command. You would roll back software only in cases in which a newly installed version of the WAAS software is not functioning properly.
The restore rollback command installs the last saved WAAS.bin image on the system disk. A WAAS.bin image is created during software installation and stored on the system disk. If the WAAS device does not have a saved version, the software is not rolled back.
Note ![]() While WAFS to WAAS migration is supported, rollback from WAAS to WAFS is not supported.
While WAFS to WAAS migration is supported, rollback from WAAS to WAFS is not supported.
Examples
The following two examples show how to use the restore factory-default and restore factory-default preserve basic-config commands. Because configuration parameters and data are lost, prompts are given before initiating the restore operation to ensure that you want to proceed.
WAE# restore factory-default
This command will wipe out all of data on the disks
and wipe out WAAS CLI configurations you have ever made.
If the box is in evaluation period of certain product,
the evaluation process will not be affected though.
It is highly recommended that you stop all active services
before this command is run.
Are you sure you want to go ahead?[yes/no]
WAE# restore factory-default preserve basic-config
This command will wipe out all of data on the disks
and all of WAAS CLI configurations except basic network
configurations for keeping the device online.
The to-be-preserved configurations are network interfaces,
default gateway, domain name, name server and hostname.
If the box is in evaluation period of certain product,
the evaluation process will not be affected.
It is highly recommended that you stop all active services
before this command is run.
Are you sure you want to go ahead?[yes/no]
Note ![]() You can enter basic configuration parameters (such as IP address, hostname, and name server) at this point, or later through entries in the command-line interface.
You can enter basic configuration parameters (such as IP address, hostname, and name server) at this point, or later through entries in the command-line interface.
The following example shows that entering the show disks details command after the restore command is used verifies that the restore command has removed data from the partitioned file systems SYSFS, WAAS, and PRINTSPOOLFS:
WAE# show disks details
Physical disk information:
disk00: Normal (h00 c00 i00 l00 - DAS) 140011MB(136.7GB)
disk01: Normal (h00 c00 i01 l00 - DAS) 140011MB(136.7GB)
Mounted filesystems:
MOUNT POINT TYPE DEVICE SIZE INUSE FREE USE%
/ root /dev/root 35MB 30MB 5MB 85%
/swstore internal /dev/md1 991MB 333MB 658MB 33%
/state internal /dev/md2 3967MB 83MB 3884MB 2%
/disk00-04 CONTENT /dev/md4 122764MB 33MB 122731MB 0%
/local/local1 SYSFS /dev/md5 3967MB 271MB 3696MB 6%
.../local1/spool PRINTSPOOL /dev/md6 991MB 16MB 975MB 1%
/sw internal /dev/md0 991MB 424MB 567MB 42%
Software RAID devices:
DEVICE NAME TYPE STATUS PHYSICAL DEVICES AND STATUS
/dev/md0 RAID-1 NORMAL OPERATION disk00/00[GOOD] disk01/00[GOOD]
/dev/md1 RAID-1 NORMAL OPERATION disk00/01[GOOD] disk01/01[GOOD]
/dev/md2 RAID-1 NORMAL OPERATION disk00/02[GOOD] disk01/02[GOOD]
/dev/md3 RAID-1 NORMAL OPERATION disk00/03[GOOD] disk01/03[GOOD]
/dev/md4 RAID-1 NORMAL OPERATION disk00/04[GOOD] disk01/04[GOOD]
/dev/md5 RAID-1 NORMAL OPERATION disk00/05[GOOD] disk01/05[GOOD]
/dev/md6 RAID-1 NORMAL OPERATION disk00/06[GOOD] disk01/06[GOOD]
Currently content-filesystems RAID level is not configured to change.
The following example shows how to upgrade or restore an older version of the WAAS software. In the first example below, version Y of the software is installed (using the copy command), but the administrator has not switched over to it yet, so the current version is still version X. The system is then reloaded (using the reload command), and it verifies that version Y is the current version running.
The following example shows that the software is rolled back to version X (using the restore rollback command), and the software is reloaded again:
WAE# copy ftp install server path waas.versionY.bin
WAE# show version
Cisco Wide Area Application Services Software (WAAS)
Copyright (c) 1999-2006 by Cisco Systems, Inc.
Cisco Wide Area Application Services Software Release 4.0.0 (build b340 Mar 25 2
006)
Version: fe611-4.0.0.340
Compiled 17:26:17 Mar 25 2006 by cnbuild
System was restarted on Mon Mar 27 15:25:02 2006.
The system has been up for 3 days, 21 hours, 9 minutes, 17 seconds.
WAE# show version last
Nothing is displayed.
WAE# show version pending
WAAS 4.0.1 Version Y
WAE# reload
...... reloading ......
WAE# show version
Cisco Wide Area Application Services Software (WAAS)
...
WAE# restore rollback
WAE# reload
...... reloading ......
Because flash memory configurations were removed after the restore command was used, the show startup-config command does not return any flash memory data. The show running-config command returns the default running configurations.
Related Commands
rmdir
To delete a directory on a WAAS device, use the rmdir EXEC command.
rmdir directory
Syntax Description
directory |
Name of the directory that you want to delete. |
Defaults
No default behavior or values
Command Modes
EXEC
Device Modes
application-accelerator
replication-accelerator
central-manager
Usage Guidelines
Use this EXEC command to remove any directory from the WAAS file system. The rmdir command only removes empty directories.
Examples
The following example shows how to delete the oldfiles directory from the local1 directory:
WAE# rmdir /local1/oldfiles
Related Commands
scp
To copy files between network hosts, use the scp command.
scp [1][2][4][6][B][C][p][q][r][v] [c cipher] [F config-file] [i id-file] [l limit]
[o ssh_option] [P port] [S program] [[user @] host : file] [...] [[user-n @] host-n : file-n]
Syntax Description
Command Modes
EXEC
Device Modes
application-accelerator
replication-accelerator
central-manager
Usage Guidelines
The scp command uses SSH for transferring data between hosts.
This command prompts you for passwords or pass phrases when needed for authentication.
Related Commands
script
To execute a script provided by Cisco or check the script for errors, use the script EXEC command.
script {check | execute} file_name
Syntax Description
check |
Checks the validity of the script. |
execute |
Executes the script. The script file must be a SYSFS file in the current directory. |
file_name |
Name of the script file. |
Defaults
No default behavior or values
Command Modes
EXEC
Device Modes
application-accelerator
replication-accelerator
central-manager
Usage Guidelines
The script EXEC command opens the script utility, which allows you to execute Cisco-supplied scripts or check errors in those scripts. The script utility can read standard terminal input from the user if the script you run requires input from the user.
Note ![]() The script utility is designed to run only Cisco-supplied scripts. You cannot execute script files that lack Cisco signatures or that have been corrupted or modified.
The script utility is designed to run only Cisco-supplied scripts. You cannot execute script files that lack Cisco signatures or that have been corrupted or modified.
Examples
The following example shows how to check for errors in the script file test_script.pl:
WAE# script check test_script.pl
setup
To configure basic configuration settings (general settings, device network settings, and disk configuration) on the WAAS device or to complete basic configuration after upgrading to WAAS software, use the setup EXEC command.
setup
Syntax Description
This command has no arguments or keywords.
Defaults
No default behavior or values
Command Modes
EXEC
Device Modes
application-accelerator
replication-accelerator
central-manager
Usage Guidelines
For instructions on using the setup command, see the Cisco Wide Area Application Services Quick Configuration Guide.
Examples
The following example shows the first screen of the wizard when you enter the setup EXEC command on a WAAS device that is running the WAAS software:
WAE# setup
Please choose an interface to configure from the following list:
1: GigabitEthernet 1/0
2: GigabitEthernet 2/0
Enter choice:
.
.
.
Press the ESC key at any time to quit this session
show aaa accounting
To display the AAA accounting configuration information for a WAAS device, use the show aaa EXEC command.
show aaa accounting
Defaults
No default behavior or values
Command Modes
EXEC
Device Modes
application-accelerator
replication-accelerator
central-manager
Usage Guidelines
Use this EXEC command to display configuration information for the following AAA accounting types:
•![]() Exec shell
Exec shell
•![]() Command (for normal users and superusers)
Command (for normal users and superusers)
•![]() System
System
Examples
Table 3-1 describes the fields shown in the show aaa accounting display.
Related Commands
show adapter
To display the status and configuration of the EndPoint Mapper (EPM) adapter, use the show adapter EXEC command.
show adapter epm
Syntax Description
epm |
Specifies the Microsoft PortMapper adapter. |
Defaults
No default behavior or values
Command Modes
EXEC
Device Modes
application-accelerator
Usage Guidelines
This command is valid for the WAE application-accelerator appliances; it is not valid for the Central Manager (CM) appliance.
Examples
Table 3-2 describes the fields shown in the show adapter epm display.
Related Commands
show alarms
To display information on various types of alarms, their status, and history on a WAAS device, use the show alarms EXEC command.
show alarms [critical [detail [support]] | detail [support] | history [start_num [end_num [detail [support]]] | critical [start_num [end_num [detail [support]]]] | detail [support] | major [start_num [end_num [detail [support]]]] | minor [start_num [end_num [detail [support]]]]] | detail [support] | major [detail [support]] | minor [detail [support]] | status]
Syntax Description
Defaults
No default behavior or values.
Command Modes
EXEC
Device Modes
application-accelerator
replication-accelerator
central-manager
Usage Guidelines
The Node Health Manager in the WAAS software enables WAAS applications to raise alarms to draw attention in error/significant conditions. The Node Health Manager, which is the data repository for such alarms, aggregates the health and alarm information for the applications, services, and resources (for example, disk drives) that are being monitored on the WAAS device. For example, this feature gives you a mechanism to determine if a WAE is receiving overwhelming number of alarms. These alarms are referred to as "WAAS software alarms."
The WAAS software uses SNMP to report error conditions by generating SNMP traps. The following WAAS applications can generate a WAAS software alarm:
•![]() Node Health Manager (Alarm overload condition)
Node Health Manager (Alarm overload condition)
•![]() System Monitor (sysmon) for disk failures
System Monitor (sysmon) for disk failures
The three levels of alarms in WAAS software are as follows:
•![]() Critical—Alarms that affect the existing traffic through the WAE, and are considered fatal (the WAE cannot recover and continue to process traffic).
Critical—Alarms that affect the existing traffic through the WAE, and are considered fatal (the WAE cannot recover and continue to process traffic).
•![]() Major—Alarms which indicate a major service (for example, the cache service) has been damaged or lost. Urgent action is necessary to restore this service. However, other node components are fully functional and the existing service should be minimally impacted.
Major—Alarms which indicate a major service (for example, the cache service) has been damaged or lost. Urgent action is necessary to restore this service. However, other node components are fully functional and the existing service should be minimally impacted.
•![]() Minor—Alarms which indicate that a condition that will not affect a service has occurred, but that corrective action is required to prevent a serious fault from occurring.
Minor—Alarms which indicate that a condition that will not affect a service has occurred, but that corrective action is required to prevent a serious fault from occurring.
You can configure alarms using the snmp-server enable traps alarms global configuration command.
Use the show alarms critical EXEC command to display the current critical alarms being generated by WAAS software applications. Use the show alarms critical detail EXEC command to display additional details for each of the critical alarms being generated. Use the show alarms critical detail support EXEC command to display an explanation about the condition that triggered the alarm and how you can find out the cause of the problem. Similarly, you can use the show alarms major and show alarms minor EXEC commands to display the details of major and minor alarms.
Use the show alarms history EXEC command to display a history of alarms that have been raised and cleared by WAAS software on the WAAS device since the last software reload. The WAAS software retains the last 100 alarm raise and clear events only.
Use the show alarms status EXEC command to display the status of current alarms, and the WAAS device's alarm overload status and alarm overload configuration.
Examples
Table 3-3 describes the fields shown in the show alarms history display.
Table 3-4 describes the fields shown in the show alarms status display.
Related Commands
(config) alarm overload-detect
(config) snmp-server enable traps
show arp
To display the ARP table for a WAAS device, use the show arp EXEC command.
show arp
Syntax Description
This command has no arguments or keywords.
Defaults
No default behavior or values
Command Modes
EXEC
Device Modes
application-accelerator
replication-accelerator
central-manager
Usage Guidelines
Use the show arp command to display the Internet-to-Ethernet address translation tables of the Address Resolution Protocol. Without flags, the current ARP entry for the host name is displayed.
Examples
Table 3-5 describes the fields shown in the show arp display.
show authentication
To display the authentication configuration for a WAAS device, use the show authentication EXEC command.
show authentication {user | content-request}
Syntax Description
user |
Displays authentication configuration for user login to the system. |
content-request |
Displays content request authentication configuration information in the disconnected mode. |
s
Defaults
No default behavior or values
Command Modes
EXEC
Device Modes
application-accelerator
replication-accelerator
central-manager
Usage Guidelines
When the WAAS device authenticates a user through an NTLM, LDAP, TACACS+, RADIUS, or Windows domain server, a record of the authentication is stored locally. As long as the entry is stored, subsequent attempts to access restricted Internet content by the same user do not require additional server lookups. To display the local and remote authentication configuration for user login, use the show authentication user EXEC command.
To display the content request authentication configuration information in the disconnected mode, use the show authentication content-request EXEC command.
Examples
Table 3-6 describes the fields shown in the show authentication user display.
Table 3-7 describes the field in the show authentication content-request display.
Related Commands
show statistics authentication
show auto-register
To display the status of a WAE's automatic registration feature, use the show auto-register EXEC command.
show auto-register
Syntax Description
This command has no arguments or keywords.
Defaults
No default behavior or values
Command Modes
EXEC
Device Modes
application-accelerator
Examples
Table 3-8 describes the output in the show auto-register display.
|
|
|
|---|---|
Auto registration is enabled. |
Configuration status of the autoregistration feature. |
Auto registration is disabled. |
Related Commands
show banner
To display the message of the day (MOTD), login, and EXEC banner settings, use the show banner EXEC command.
show banner
Syntax Description
This command has no arguments or keywords.
Defaults
No default behavior or values
Command Modes
EXEC
Device Modes
application-accelerator
replication-accelerator
central-manager
Examples
Table 3-9 describes the fields shown in the show banner display.
Related Commands
show bypass
To display static bypass configuration information for a WAE, use the show bypass EXEC command.
show bypass list
Syntax Description
list |
Displays the bypass list entries. Maximum of 50. |
Defaults
No default behavior or values
Command Modes
EXEC
Device Modes
application-accelerator
Usage Guidelines
The maximum number of static bypass entries is 50.
Examples
Table 3-10 describes the fields shown in the show bypass list display.
Related Commands
show cdp
To display CDP configuration information, use the show cdp EXEC command.
show cdp [entry neighbor [protocol | version [protocol]] | holdtime | interface [FastEthernet slot/port | GigabitEthernet slot/port] | neighbors [detail | FastEthernet slot/port [detail] | GigabitEthernet slot/port [detail]] | run | timer | traffic]
Syntax Description
Defaults
No default behavior or values
Command Modes
EXEC
Device Modes
application-accelerator
replication-accelerator
central-manager
Usage Guidelines
The show cdp command displays information regarding how frequently CDP packets are resent to neighbors, the length of time that CDP packets are held by neighbors, the disabled status of CDP Version 2 multicast advertisements, CDP Ethernet interface ports, and general CDP traffic information.
Examples
Table 3-11 describes the fields shown in the show cdp display.
Table 3-12 describes the fields shown in the show cdp entry neighbor display.
Table 3-13 describes the fields shown in the show cdp entry neighbor protocol display.
Table 3-14 describes the fields shown in the show cdp entry neighbor version display.
Table 3-15 describes the field in the show cdp holdtime display.
Table 3-16 describes the fields shown in the show cdp interface display.
Table 3-17 describes the fields shown in the show cdp neighbors display.
Table 3-18 describes the fields shown in the show cdp neighbors detail display.
Table 3-19 describes the field in the show cdp run display.
|
|
|
|---|---|
CDP is XX. |
Shows whether CDP is enabled or disabled. |
Table 3-20 describes the field in the show cdp timer display.
|
|
|
|---|---|
cdp timer XX |
Time when CDP information is resent to neighbors. |
Table 3-21 describes the fields shown in the show cdp traffic display.
Related Commands
show cifs
To display CIFS run-time information, use the show cifs EXEC command.
show cifs {auto-discovery [enabled | host-db | last] | cache {disk-use | entry-count} | connectivity peers | mss | requests {count | waiting} | sessions {count | list}}
Syntax Description
Defaults
No default behavior or values
Command Modes
EXEC
Device Modes
application-accelerator
Usage Guidelines
Use the show cifs cache command to view information about caching efficiency. You might use this command to determine if the cache contains sufficient space or if more space is needed. If you have a performance issue, you might use this command to see whether or not the cache is full.
Use the show cifs connectivity peers command to validate the WAN link state and the Edge to Core connectivity. This command is useful for general monitoring and debugging.
Use the show cifs requests count or show cifs requests waiting command to monitor the load for CIFS traffic. You might also use this command for debugging purposes to isolate requests that are not processing.
Use the show cifs sessions count or show cifs sessions list command to view session information. You might use this command to monitor connected users during peak and off-peak hours.
Related Commands
show clock
To display information about the system clock on a WAAS device, use the show clock EXEC command.
show clock [detail | standard-timezones {all | details timezone | regions | zones region-name}]
Syntax Description
Defaults
No default behavior or values
Command Modes
EXEC
Device Modes
application-accelerator
replication-accelerator
central-manager
Usage Guidelines
The WAAS device has several predefined "standard" time zones. Some of these time zones have built-in summer time information while others do not. For example, if you are in an eastern region of the United States (US), you must use US/Eastern time zone that includes summer time information for the system clock to adjust automatically every April and October. There are about 1500 "standard" time zone names.
Strict checking disables the clock summertime command when a standard time zone is configured. You can only configure summertime if the time zone is not a standard time zone (that is, if the time zone is a "customized zone").
The show clock standard-timezones all EXEC command enables you to browse through all standard timezones and choose from these predefined time zones. This enables you to choose a customized name that does not conflict with the predefined names of the standard time zones. Most predefined names of the standard time zones have two components, a region name and a zone name. You can list time zones by several criteria, such as regions and zones. To display all first level time zone names organized into directories by region, use the show clock standard-timezones region EXEC command.
The show clock command displays the local date and time information and the show clock detail command shows optional detailed date and time information.
Examples
Table 3-22 describes the field in the show clock display.
|
|
|
|---|---|
Local time |
Day of the week, month, date, time (hh:mm:ss), and year in local time relative to the UTC offset. |
Table 3-23 describes the fields shown in the show clock detail display.
Related Commands
show cms
To display Centralized Management System (CMS) embedded database content and maintenance status and other information for a WAAS device, use the show cms EXEC command.
show cms {database content {dump filename | text | xml} | info | processes}
Syntax Description
Defaults
No default behavior or values
Command Modes
EXEC
Device Modes
application-accelerator
replication-accelerator
central-manager
Examples
Table 3-24 describes the fields shown in the show cms info display for WAAS application engines.
Table 3-25 describes the fields shown in the show cms info display for WAAS Central Managers.
Table 3-26 describes the field in the show cms database content text display.
Table 3-27 describes the field in the show cms database content xml display.
Related Commands
show cms secure-store
To display secure disk encryption status, use the show cms secure-store EXEC command.
show cms secure-store
Syntax Description
This command has no keywords or arguments.
Defaults
No default behavior or values
Command Modes
EXEC
Device Modes
application-accelerator
replication-accelerator
central-manager
Examples
The following example, shows that secure disk encryption is fully operational (both initialized and open):
WAE# show cms secure-store
secure-store initialized and open
The command will display one of the following status messages:
Related Commands
show debugging
To display the state of each debugging option that was previously enabled on a WAAS device, use the show debugging EXEC command.
show debugging
Syntax Description
This command has no arguments or keywords.
Command Modes
EXEC
Device Modes
application-accelerator
replication-accelerator
central-manager
Usage Guidelines
This command shows which debug options have been enabled or disabled. If there are no debug options configured, this command shows no output.
The dre, epm, flow, print-spooler, rbcp, tfo, translog, wafs, and wccp command options are supported in the application-accelerator device mode only. The emdb and rpc command options are supported in the central manager device mode only.
This command displays only the type of debugging enabled, not the specific subset of the command.
Examples
The following example shows that the debug tfo buffer-mgr and the debug tfo connection commands coupled with the show debugging command display the states of tfo buffer-mgr and tfo connection debugging options:
WAE# debug tfo buffer-mgr
WAE# debug tfo connection
WAE# show debugging
tfo bufmgr debugging is on
tfo compmgr debugging is on
tfo connmgr debugging is on
tfo netio debugging is on
tfo statmgr debugging is on
tfo translog debugging is on
Related Commands
show device-mode
To display the configured or current device mode of a WAAS device, use the show device-mode EXEC command.
show device-mode {configured | current}
Syntax Description
configured |
Displays the configured device mode, which has not taken effect yet. |
current |
Displays the current device mode. |
Command Modes
EXEC
Device Modes
application-accelerator
replication-accelerator
central-manager
Usage Guidelines
You must deploy the WAAS Central Manager on a dedicated appliance. The device mode feature allows you to deploy a WAAS device as either a WAAS Central Manager or a WAE. Because you must deploy a WAAS Central Manager on a dedicated appliance, a WAAS device can only operate in one device mode; either in central-manager mode or application-accelerator mode.
If the configured and current device modes differ, a reload is required for the configured device mode to take effect.
To display the current device mode of a WAAS device, enter the show device mode EXEC command:
WAE# show device-mode
To display the current mode in which the WAAS device is operating, enter the show device-mode current EXEC command:
WAE# show device-mode current
Current device mode: application-accelerator
To display the configured device mode that has not yet taken effect, enter the show device-mode configured EXEC command. For example, if you had entered the device mode central-manager global configuration command on a WAAS device to change its device mode to central manager but have not yet entered the copy run start EXEC command to save the running configuration on the device, then if you were to enter the show device-mode configured command on the WAAS device, the command output would indicate that the configured device mode is central-manager:
WAE# show device-mode configured
Configured device mode: central-manager
Examples
Table 3-28 describes the field in the show device-mode current display.
|
|
|
|---|---|
Current device mode |
Current mode in which the WAAS device is operating. |
Table 3-29 describes the field in the show device-mode configured display.
|
|
|
|---|---|
Configured device mode |
Device mode that has been configured, but has not yet taken effect. |
Related Commands
show disks
To view information about the WAAS device disks, use the show disks EXEC command.
show disks {details | failed-disk-id | failed-sectors [disk_name] | tech-support [details]}
Syntax Description
Defaults
No default behavior or values
Command Modes
EXEC
Device Modes
application-accelerator
replication-accelerator
central-manager
Usage Guidelines
The show disks details EXEC command displays the percentage or amount of disk space allocated to each file system, and the operational status of the disk drives, after reboot.
The WAAS software supports filtering of multiple syslog messages for a single, failed section on IDE, SCSI, and SATA disks. Enter the show disks failed-sectors EXEC command to display a list of failed sectors on all disk drives.
WAE# show disks failed-sectors
disk00
=========
89923
9232112
disk01
=========
(None)
To display a list of failed sectors for only a specific disk drive, specify the name of the disk when entering the show disks failed-sectors command. The following example shows how to display a list of failed sectors for disk01:
WAE# show disks failed-sectors disk01
disk01
=========
(None)
If there are disk failures, a message is displayed, notifying you about this situation when you log in.
Proactively Monitoring Disk Health with SMART
The ability to proactively monitor the health of disks is available using SMART. SMART provides you with hard drive diagnostic information and information about impending disk failures.
SMART is supported by most disk vendors and is a standard method used to determine how healthy a disk is. SMART attributes include several read-only attributes (for example, the power on hours attribute, the load and unload count attribute) that provide the WAAS software with information regarding the operating and environmental conditions that may indicate an impending disk failure.
SMART support is vendor and drive technology (IDE or SCSI disk drives) dependent. Each disk vendor has a different set of supported SMART attributes.
Even though SMART attributes are vendor dependent there is a common way of interpreting most SMART attributes. Each SMART attribute has a normalized current value and a threshold value. When the current value exceeds the threshold value, the disk is considered to have "failed." The WAAS software monitors the SMART attributes and reports any impending failure through syslog messages, SNMP traps, and alarms.
To display SMART information, use the show disks tech-support EXEC command. To display more detailed SMART information, enter the show disks tech-support details EXEC command. The output from the show tech-support EXEC command also includes SMART information.
Examples
Table 3-30 describes the fields shown in the show disks failed-disk-id display.
|
|
|
|---|---|
Diskxx |
Number and location of the physical disk. |
Alpha-numeric string |
Serial number of the disk. |
Table 3-31 describes the fields shown in the show disks details display.
In the following example, the output shows that partition 04 and partition 05 on disks disk00 and disk01 are GOOD, and the RAIDed partitions /dev/md4 & /dev/md5 are in NORMAL OPERATION. However, the RAIDed partition /dev/md8 has an issue with one of the drives. Disk04 with partition 00 is GOOD, but the status shows ONE OR MORE DRIVES ABNORMAL because there is no pair on this partition.
/dev/md4 RAID-1 NORMAL OPERATION disk00/04[GOOD]
disk01/04[GOOD]
/dev/md5 RAID-1 NORMAL OPERATION disk00/05[GOOD]
disk01/05[GOOD]
...
/dev/md8 RAID-1 ONE OR MORE DRIVES ABNORMAL disk04/00[GOOD]
Table 3-32 describes some typical fields in the show disks tech-support display for a RAID-1 appliance that supports SMART. SMART attributes are vendor dependent; each disk vendor has a different set of supported SMART attributes.
Table 3-33 describes the fields in the show disks tech-support details display for a RAID-1 appliance that supports SMART. Details in this display depend on the drive manufacturer and vary between drives.
Table 3-34 describes the fields shown in the show disks tech-support display for a RAID-5 appliance.
Related Commands
show egress-methods
To view the egress method that is configured and that is being used on a particular WAE, use the show egress-methods EXEC command.
show egress-methods
Syntax Description
This command has no arguments or keywords.
Command Modes
EXEC
Device Modes
application-accelerator
Examples
Table 3-35 describes the fields shown in the show egress-methods display.
Related Commands
show tfo egress-methods connection
show flash
To display the flash memory version and usage information for a WAAS device, use the show flash EXEC command.
show flash
Syntax Description
This command has no arguments or keywords.
Defaults
No default behavior or values
Command Modes
EXEC
Device Modes
application-accelerator
replication-accelerator
central-manager
Examples
Table 3-36 describes the fields shown in the show flash display.
show hardware
To display system hardware status for a WAAS device, use the show hardware EXEC command.
show hardware
Syntax Description
This command has no arguments or keywords.
Defaults
No default behavior or values
Command Modes
EXEC
Device Modes
application-accelerator
replication-accelerator
central-manager
Usage Guidelines
The show hardware command lists the system hardware status, including the version number, the startup date and time, the run time since startup, the microprocessor type and speed, the amount of physical memory available, and a list of disk drives.
Examples
Table 3-37 describes the fields shown in the show hardware display.
Related Commands
show hosts
To view the hosts on a WAAS device, use the show hosts EXEC command.
show hosts
Syntax Description
This command has no arguments or keywords.
Defaults
No default behavior or values
Command Modes
EXEC
Device Modes
application-accelerator
replication-accelerator
central-manager
Usage Guidelines
The show hosts command lists the name servers and their corresponding IP addresses. It also lists the host names, their corresponding IP addresses, and their corresponding aliases (if applicable) in a host table summary.
Examples
Table 3-38 describes the fields shown in the show hosts display.
show inetd
To display the status of TCP/IP services on a WAAS device, use the show inetd EXEC command.
show inetd
Syntax Description
This command has no arguments or keywords.
Defaults
No default behavior or values
Command Modes
EXEC
Device Modes
application-accelerator
replication-accelerator
central-manager
Usage Guidelines
The show inetd EXEC command displays the enabled or disabled status of TCP/IP services on the WAAS device. You can ignore the TFTP service status because TFTP is not supported on WAAS.
Examples
Table 3-39 describes the fields shown in the show inetd display.
Related Commands
show interface
To display the hardware interface information for a WAAS device, use the show interface EXEC command.
show interface {GigabitEthernet slot/port} | {ide control_num} | {InlineGroup slot/grpnumber} | {InlinePort slot/grpnumber/{lan | wan}} | {PortChannel port-num} | {scsi device_num}
| {Standby group_num | usb}
Syntax Description
Defaults
No default behavior or values
Command Modes
EXEC
Device Modes
application-accelerator
replication-accelerator
central-manager
Examples
Table 3-40 describes the fields shown in the show interface GigabitEthernet display.
The following example displays information for inlineGroup 0 in slot 1 configured on the WAE inline network adapter:
WAE612# show interface inlineGroup 1/0
Interface is in intercept operating mode.
Standard NIC mode is off.
Disable bypass mode is off.
VLAN IDs configured for inline interception: All
Watchdog timer is enabled.
Timer frequency: 1600 ms.
Autoreset frequency 500 ms.
The watchdog timer will expire in 1221 ms.
Table 3-41 describes the fields shown in the show interface InlinePort display.
Table 3-42 describes the fields shown in the show interface PortChannel display.
Table 3-43 describes the field shown in the show interface scsi display.
Table 3-44 describes the fields shown in the show interface standby display.
Related Commands
show inventory
To display the system inventory information for a WAAS device, use the show inventory EXEC command.
show inventory
Syntax Description
This command has no arguments or keywords.
Defaults
No default behavior or values
Command Modes
EXEC
Device Modes
application-accelerator
replication-accelerator
central-manager
Usage Guidelines
The show inventory EXEC command allows you to view the UDI for a WAAS device. This identity information is stored in the WAAS device's nonvolatile memory.
The UDI is electronically accessed by the product operating system or network management application to enable identification of unique hardware devices. The data integrity of the UDI is vital to customers. The UDI that is programmed into the WAAS device's nonvolatile memory is equivalent to the UDI that is printed on the product label and on the carton label. This UDI is also equivalent to the UDI that can be viewed through any electronic means and in all customer-facing systems and tools. Currently, there is only CLI access to the UDI; there is no SNMP access to the UDI information.
You can also use the show tech-support EXEC command to display the WAAS device UDI.
Examples
Table 3-45 describes the fields shown in the show inventory display.
Related Commands
show ip access-list
To display the access lists that are defined and applied to specific interfaces or applications on a WAAS device, use the show ip access-list EXEC command.
show ip access-list [acl-name | acl-num]
Syntax Description
Defaults
Displays information about all defined access lists.
Command Modes
EXEC
Device Modes
application-accelerator
replication-accelerator
central-manager
Usage Guidelines
Use the show ip access-list EXEC command to display the access lists that have been defined on the WAAS device. Unless you identify a specific access list by name or number, the system displays information about all the defined access lists, including the following sections:
•![]() Available space for new lists and conditions
Available space for new lists and conditions
•![]() Defined access lists
Defined access lists
•![]() References by interface and application
References by interface and application
Examples
Table 3-46 describes the fields shown in the show ip access-list display.
Related Commands
show ip routes
To display the IP routing table for a WAAS device, use the show ip routes EXEC command.
show ip routes
Syntax Description
This command has no arguments or keywords.
Defaults
No default behavior or values
Command Modes
EXEC
Device Modes
application-accelerator
replication-accelerator
central-manager
Usage Guidelines
This command displays the IP route table, which lists all of the different routes that are configured on the WAE. The WAE uses this table to determine the next hop. This table includes routes from three sources: the WAE GigabitEthernet interfaces, any user-configured static routes, and the default gateway. The last line in this table shows the default route.
Examples
Table 3-47 describes the fields shown in the show ip routes display.
Related Commands
show kerberos
To display the Kerberos authentication configuration for a WAAS device, use the show kerberos EXEC command.
show kerberos
Syntax Description
This command has no arguments or keywords.
Defaults
No default behavior or values
Command Modes
EXEC
Device Modes
application-accelerator
replication-accelerator
central-manager
Usage Guidelines
Use the system message log to view information about events that have occurred on a WAAS device. The syslog.txt file is contained in the /local1 directory.
Examples
Table 3-48 describes the fields shown in the show kerberos display.
Related Commands
show key-manager
To display key manager information for each WAAS device, use the show key-manager EXEC command.
show key-manager {key | status}
Syntax Description
key |
Shows detailed key manager information for each WAE device that is registered to the Central Manager. |
status |
Displays the overall encryption status information |
Defaults
No default behavior or values
Command Modes
EXEC
Device Modes
central-manager
Examples
Table 3-49 describes the fields shown in the show key-manager key display.
Related Commands
show logging
To display the system message log configuration for a WAAS device, use the show logging EXEC command.
show logging
Syntax Description
This command has no arguments or keywords.
Defaults
No default behavior or values
Command Modes
EXEC
Device Modes
application-accelerator
replication-accelerator
central-manager
Usage Guidelines
Use the system message log to view information about events that have occurred on a WAAS device. The syslog.txt file is contained in the /local1 directory.
Examples
The following example displays the syslog host configuration on a WAAS device:
WAE# show logging
Syslog to host is disabled
Priority for host logging is set to: warning
Syslog to console is disabled
Priority for console logging is set to: warning
Syslog to disk is enabled
Priority for disk logging is set to: notice
Filename for disk logging is set to: /local1/syslog.txt
Syslog facility is set to *
Syslog disk file recycle size is set to 1000000
Related Commands
show memory
To display memory blocks and statistics for a WAAS device, use the show memory EXEC command.
show memory
Syntax Description
This command has no arguments or keywords.
Defaults
No default behavior or values
Command Modes
EXEC
Device Modes
application-accelerator
replication-accelerator
central-manager
Examples
Table 3-50 describes the fields shown in the show memory display.
show ntp
To display the NTP parameters for a WAAS device, use the show ntp EXEC command.
show ntp status
Syntax Description
status |
Displays NTP status. |
Defaults
No default behavior or values
Command Modes
EXEC
Device Modes
application-accelerator
replication-accelerator
central-manager
Examples
Table 3-51 describes the fields shown in the show ntp status display.
Related Commands
show policy-engine application
To display application policy information for a WAE, use the show policy-engine application EXEC command.
show policy-engine application {classifier [app-classifier] | dynamic | name}
Syntax Description
Command Modes
EXEC
Device Modes
application-accelerator
Usage Guidelines
Use the show policy-engine application dynamic command to display auto-discovered CIFS file servers that are added to the list. The servers are visible in the dynamic listing for a limited time (3 minutes by default) after any activity stops, and then they are dropped from the dynamic list until another client request causes them to be auto-discovered again.
Examples
Table 3-52 describes the fields shown in the show policy-engine application classifier display.
Table 3-53 describes the fields shown in the show policy-engine application dynamic display.
Table 3-54 describes the fields shown in the show policy-engine application name display.
Related Commands
(config) policy-engine application classifier
(config) policy-engine application map adaptor EPM
(config) policy-engine application map adaptor WAFS transport
(config) policy-engine application map basic delete
(config) policy-engine application map basic disable
(config) policy-engine application map basic insert
(config) policy-engine application map basic list
(config) policy-engine application map basic move
(config) policy-engine application map basic name
(config) policy-engine application map other optimize DRE
(config) policy-engine application map other optimize full
(config) policy-engine application map other pass-through
(config) policy-engine application name
show policy-engine status
To display high-level information about a WAE's policy engine, use the show policy-engine status EXEC command. This information includes the usage of the available resources, which include application names, classifiers, and conditions.
show policy-engine status
Command Modes
EXEC
Device Modes
application-accelerator
Examples
Table 3-55 describes the fields shown in the show policy-engine status display.
Related Commands
(config) policy-engine application classifier
(config) policy-engine application map adaptor EPM
(config) policy-engine application map adaptor WAFS transport
(config) policy-engine application map basic delete
(config) policy-engine application map basic disable
(config) policy-engine application map basic insert
(config) policy-engine application map basic list
(config) policy-engine application map basic move
(config) policy-engine application map basic name
(config) policy-engine application map other optimize DRE
(config) policy-engine application map other optimize full
(config) policy-engine application map other pass-through
(config) policy-engine application name
show print-services
To display administrative users who have access to configuration privileges, print services, or print service processes on a WAAS device, use the show print-services EXEC command.
show print-services {drivers user username | process}
Syntax Description
process |
Displays information about the print server and print spooler. |
drivers |
Displays printer drivers on this print server. |
user username |
Specifies a username that belongs to the print admin group. |
Defaults
No default behavior or values
Command Modes
EXEC
Device Modes
application-accelerator
replication-accelerator
central-manager
Examples
Table 3-56 describes the fields shown in the show print-services process display.
Related Commands
show processes
To display CPU or memory processes for a WAAS device, use the show processes EXEC command.
show processes [cpu | debug pid | memory | system [delay 1-60 | count 1-100]]
Syntax Description
Defaults
No default behavior or values
Command Modes
EXEC
Device Modes
application-accelerator
replication-accelerator
central-manager
Usage Guidelines
Use the EXEC commands shown in this section to track and analyze system CPU utilization.
The show processes debug command displays extensive internal system call information and a detailed account of each system call (along with arguments) made by each process and the signals it has received.
Use the show processes system command to display system load information in terms of updates. The delay option specifies the delay between updates, in seconds. The count option specifies the number of updates that are displayed. This command displays these items:
•![]() A list of all processes in wide format.
A list of all processes in wide format.
•![]() Two tables listing the processes that utilize CPU resources. The first table displays the list of processes in descending order of utilization of CPU resources based on a snapshot taken after the processes system (ps) output is displayed. The second table displays the same processes based on a snapshot taken 5 seconds after the first snapshot.
Two tables listing the processes that utilize CPU resources. The first table displays the list of processes in descending order of utilization of CPU resources based on a snapshot taken after the processes system (ps) output is displayed. The second table displays the same processes based on a snapshot taken 5 seconds after the first snapshot.
•![]() Virtual memory used by the corresponding processes in a series of five snapshots, each separated by 1 second.
Virtual memory used by the corresponding processes in a series of five snapshots, each separated by 1 second.
Note ![]() CPU utilization and system performance are severely affected when you use these commands. We therefore recommend that you avoid using these commands, especially the show processes debug command, unless it is absolutely necessary.
CPU utilization and system performance are severely affected when you use these commands. We therefore recommend that you avoid using these commands, especially the show processes debug command, unless it is absolutely necessary.
Examples
Table 3-57 describes the fields shown in the show processes display.
show radius-server
To display RADIUS configuration information for a WAAS device, use the show radius-server EXEC command.
show radius-server
Syntax Description
This command has no arguments or keywords.
Defaults
No default behavior or values
Command Modes
EXEC
Device Modes
application-accelerator
replication-accelerator
central-manager
Examples
Table 3-58 describes the fields shown in the show radius-server display.
Related Commands
show running-config
To display a WAAS device's current running configuration information on the terminal, use the show running-config EXEC command. This command replaces the write terminal command.
show running-config
Syntax Description
This command has no arguments or keywords.
Defaults
No default behavior or values
Command Modes
EXEC
Device Modes
application-accelerator
replication-accelerator
central-manager
Usage Guidelines
Use this EXEC command in conjunction with the show startup-config command to compare the information in running memory to the startup configuration used during bootup.
Examples
The following example displays the currently running configuration of a WAAS device:
WAE# show running-config
! WAAS version 4.0.0
!
device mode central-manager
!
!
hostname waas-cm
!
!
!
!
!
exec-timeout 60
!
!
primary-interface GigabitEthernet 1/0
!
!
...
Related Commands
show services
To display services-related information for a WAAS device, use the show services EXEC command.
show services {ports [port-num] | summary}
Syntax Description
ports |
Displays services by port number. |
port-num |
(Optional) Up to 8 port numbers (1-65535). |
summary |
Displays the services summary. |
Defaults
No default behavior or values
Command Modes
EXEC
Device Modes
application-accelerator
replication-accelerator
central-manager
Examples
The following example displays a summary of the services:
WAE# show services summary
Service Ports
-----------------------------------------------------
CMS 1100 5256
NLM 4045
WAFS 1099
emdb 5432
MOUNT 3058
MgmtAgent 5252
WAFS_tunnel 4050
CMS_db_vacuum 5257
show smb-conf
To view a WAAS device's current values of the Samba configuration file, smb.conf, use the show smb-conf EXEC command.
show smb-conf
Syntax Description
This command has no arguments or keywords.
Defaults
No default behavior or values
Command Modes
EXEC
Device Modes
application-accelerator
replication-accelerator
central-manager
Usage Guidelines
This command displays the global, print$, and printers parameters values of the smb.conf file for troubleshooting purposes. For a description of these parameters and their values, see the "(config) smb-conf" command.
Examples
The following example displays all of the parameter values for the current configuration:
WAE# show smb-conf
Current smb-conf configurations -->
smb-conf section "global" name "ldap ssl" value "start_tls"
smb-conf section "printers" name "printer admin" value "root"
Output of current smb.conf file on disk -->
==============================================
# File automatically generated
[global]
idmap uid = 70000-200000
idmap gid = 70000-200000
winbind enum users = no
winbind enum groups = no
winbind cache time = 10
winbind use default domain = yes
printcap name = cups
load printers = yes
printing = cups
cups options = "raw"
force printername = yes
lpq cache time = 0
log file = /local/local1/errorlog/samba.log
max log size = 50
socket options = TCP_NODELAY SO_RCVBUF=8192 SO_SNDBUF=8192
smb ports = 50139
local master = no
domain master = no
preferred master = no
dns proxy = no
template homedir = /local/local1/
template shell = /admin-shell
ldap ssl = start_tls
comment = Comment:
netbios name = MYFILEENGINE
realm = ABC
wins server = 10.10.10.1
password server = 10.10.10.10
security = domain
[print$]
path = /state/samba/printers
guest ok = yes
browseable = yes
read only = yes
write list = root
[printers]
path = /local/local1/spool/samba
browseable = no
guest ok = yes
writable = no
printable = yes
printer admin = root
==============================================
Related Commands
show snmp
To check the status of SNMP communications for a WAAS device, use the show snmp EXEC command.
show snmp {alarm-history | engine ID | event | group | stats | user}
Syntax Description
Defaults
No default behavior or values
Command Modes
EXEC
Device Modes
application-accelerator
replication-accelerator
central-manager
Usage Guidelines
This EXEC command provides information on various SNMP variables and statistics on SNMP operations.
Examples
Table 3-59 describes the fields shown in the show snmp alarm-history display.
|
|
|
|---|---|
Index |
Displays the serial number of the listed alarms. |
Type |
Indicates whether the alarm has been Raised (R) or Cleared (C). |
Sev |
Levels of alarm severity: Critical (Cr), Major (Ma), or Minor (Mi). |
Alarm ID |
Traps sent by a WAE contain numeric alarm IDs. |
ModuleID |
Traps sent by a WAE contain numeric module IDs. (See Table 3-60 to map module names to module IDs.) |
Category |
Traps sent by a WAE contain numeric category IDs. (See Table 3-61 to map category names to category IDs.) |
Descr |
Provides description of the WAAS software alarm and the application that generated the alarm. |
Table 3-60 summarizes the mapping of module names to module IDs.
|
|
|
|---|---|
AD_DATABASE |
8000 |
NHM |
1 |
NHM/NHM |
2500 |
nodemgr |
2000 |
standby |
4000 |
sysmon |
1000 |
UNICAST_DATA_RECEIVER |
5000 |
UNICAST_DATA_SENDER |
6000 |
Table 3-61 summarizes the mapping of category names to category IDs.
|
|
|
|---|---|
Communications |
1 |
Service Quality |
2 |
Processing Error |
3 |
Equipment |
4 |
Environment |
5 |
Content |
6 |
Table 3-62 describes the fields shown in the show snmp engineID display.
|
|
|
|---|---|
Local SNMP Engine ID |
String that identifies the copy of SNMP on the local device. |
Table 3-63 describes the fields shown in the show snmp event display. The show snmp event command displays information about the SNMP events that were set using the "snmp trigger" command:
Table 3-64 describes the fields shown in the show snmp group display.
Table 3-65 describes the fields shown in the show snmp stats display.
Table 3-66 describes the fields shown in the show snmp user display.
Related Commands
(config) snmp-server community
(config) snmp-server enable traps
(config) snmp-server mib persist event
(config) snmp-server notify inform
show ssh
To display the status and configuration information of the Secure Shell (SSH) service for a WAAS device, use the show ssh EXEC command.
show ssh
Syntax Description
This command has no arguments or keywords.
Defaults
No default behavior or values
Command Modes
EXEC
Device Modes
application-accelerator
replication-accelerator
central-manager
Examples
Table 3-67 describes the fields shown in the show ssh display.
Related Commands
show standby
To display information about a standby interface on a WAAS device, use the show standby EXEC command.
show standby
Syntax Description
This command has no arguments or keywords.
Defaults
No default behavior or values
Command Modes
EXEC
Device Modes
application-accelerator
replication-accelerator
central-manager
Usage Guidelines
To display information about a specific standby group configuration, enter the show interface standby standby group_num EXEC command.
Examples
Table 3-68 describes the fields shown in the show standby display.
Related Commands
show startup-config
To display the startup configuration for a WAAS device, use the show startup-config EXEC command.
show startup-config
Syntax Description
This command has no keywords or arguments.
Defaults
No default behavior or values
Command Modes
EXEC
Device Modes
application-accelerator
replication-accelerator
central-manager
Usage Guidelines
Use this EXEC command to display the configuration used during an initial bootup, stored in NVRAM. Note the difference between the output of this command versus the show running-config command.
Examples
The following example displays the configuration saved for use on startup of the WAAS device:
WAE# show startup-config
! WAAS version 4.0.0
!
device mode central-manager
!
!
hostname Edge-WAE1
!
!
!
!
!
exec-timeout 60
!
!
primary-interface GigabitEthernet 1/0
!
!
!
interface GigabitEthernet 1/0
ip address 10.10.10.33 255.255.255.0
exit
interface GigabitEthernet 2/0
shutdown
...
Related Commands
show statistics authentication
To display authentication statistics for a WAAS device, use the show statistics authentication EXEC command.
show statistics authentication
Syntax Description
This command has no arguments or keywords.
Defaults
No default behavior or values
Command Modes
EXEC
Device Modes
application-accelerator
replication-accelerator
central-manager
Usage Guidelines
Use the show statistics authentication command to display the number of authentication access requests, denials, and allowances recorded.
Examples
The following example displays the statistics related to authentication on the WAAS device:
WAE# show statistics authentication
Authentication Statistics
--------------------------------------
Number of access requests: 115
Number of access deny responses: 12
Number of access allow responses: 103
Related Commands
show statistics cifs
To display the CIFS statistics information, use the show statistics cifs EXEC command.
show statistics cifs {cache eviction | requests}
Syntax Description
cache |
Displays the statistics for CIFS cache. |
eviction |
Displays the status of CIFS cache eviction. |
requests |
Displays the statistics for CIFS requests. |
Defaults
No default behavior or values
Command Modes
EXEC
Device Modes
application-accelerator
Usage Guidelines
Use the show statistics cifs EXEC command to view the CIFS traffic details itemized by request type. This command is useful when you want to understand how the system is being used. For example, are requests mostly for data transfer, browsing, database activity, or for some other purpose? You might correlate these statistics with performance issues for troubleshooting purposes, or you may use them to determine what specific performance optimizations to configure.
Examples
Table 3-69 describes the fields in the show statistics cifs requests display.
Related Commands
show statistics content-distribution-network
To display the status of a WAE or device group that is registered with a WAAS Central Manager, use the show statistics content-distribution-network EXEC command. This command is available on only WAAS Central Managers.
show statistics content-distribution-network device status device_id
Syntax Description
device status |
Displays the status of a WAE or device group that is registered with the WAAS Central Manager. |
device_id |
Name or ID of the device or device group. |
Defaults
No default behavior or values
Command Modes
EXEC
Device Modes
central-manager
Usage Guidelines
Use the show statistics content-distribution-network EXEC command to display the identification details about a WAE or WAEs in a device group, and verify if a WAE is online.
Examples
The following example displays the identification details of a WAE that is registered with the WAAS Central Manager:
WAE# show statistics content-distribution-network device status edge-wae-11
Device id="CdmConfig_142" name="edge-wae-11" status="Online";
show statistics dre
To display Data Redundancy Elimination (DRE) general statistics for a WAE, use the show statistics dre EXEC command.
show statistics dre
Command Modes
EXEC
Device Modes
application-accelerator
Examples
Table 3-70 describes the fields shown in the show statistics dre display. This command shows the aggregated statistics for all connections.
Related Commands
show statistics dre connection
show statistics dre connection
To display Data Redundancy Elimination (DRE) connection statistics for a WAE, use the show statistics dre connection EXEC command.
show statistics dre connection [active [client-ip {ip_address | hostname} | client-port port |
id connection_id | last | peer-no peer_id | server-ip {ip_address | hostname} | server-port port] | client-ip {ip_address | hostname} | client-port port | id connection_id | last | peer-no peer_id | server-ip {ip_address | hostname} | server-port port]
Syntax Description
Command Modes
EXEC
Device Modes
application-accelerator
Usage Guidelines
This command displays the statistics for individual TCP connections on which DRE compression is being applied. This information is updated in real time.
Using this command without any options displays a one-line summary of all the TCP connections on the WAE for which DRE is applied. To obtain detailed statistics for a connection, use the command options to filter the connection. While most filters show detail statistics, some filters (such as, peer no.) show summary information and not details.
Examples
Table 3-71 describes the fields shown in the show statistics dre connection display.
Related Commands
show statistics dre connection
show statistics dre peer
To display Data Redundancy Elimination (DRE) peer statistics for a WAE, use the show statistics dre peer EXEC command.
show statistics dre peer {context context-value [ip ip-address | peer-id peer-id |
peer-no peer-no] | ip ip-address [context context-value | ip ip-address | peer-id peer-id | peer-no peer-no] | peer-id peer-id [context context-value | ip ip-address | peer-no peer-no] |
peer-no peer-no [context context-value | ip ip-address | peer-id peer-id]}
Syntax Description
Command Modes
EXEC
Device Modes
application-accelerator
Examples
Table 3-72 describes the fields shown in the show statistics dre peer display. This command shows the DRE peer device connection information.
Related Commands
show statistics dre connection
show statistics epm
To display EndPoint Mapper (EPM) statistics for a WAE, use the show statistics epm EXEC command.
show statistics epm
Command Modes
EXEC
Device Modes
application-accelerator
Usage Guidelines
This command displays the number of total requests and responses recorded.
Examples
Table 3-73 describes the fields shown in the show statistics epm display.
Related Commands
(config) policy-engine application map adaptor EPM
show statistics flow
To display flow statistics for a WAAS device, use the show statistics flow EXEC command.
show statistics flow {filters | monitor tcpstat-v1}
Syntax Description
filters |
Displays flow filter statistics. |
monitor |
Displays flow performance statistics. |
tcpstat-v1 |
Displays tcpstat-v1 collector statistics. |
Defaults
No default behavior or values
Command Modes
EXEC
Device Modes
application-accelerator
Examples
Table 3-76 describes the fields shown in the show statistics flow filters display.
Table 3-75 describes the fields shown in the show statistics flow monitor display.
Related Commands
show statistics icmp
To display ICMP statistics for a WAAS device, use the show statistics icmp EXEC command.
show statistics icmp
Syntax Description
This command has no arguments or keywords.
Defaults
No default behavior or values
Command Modes
EXEC
Device Modes
application-accelerator
replication-accelerator
central-manager
Examples
Table 3-76 describes the fields shown in the show statistics icmp display.
Related Commands
show statistics ip
To display IP statistics for a WAAS device, use the show statistics ip EXEC command.
show statistics ip
Syntax Description
This command has no arguments or keywords.
Defaults
No default behavior or values
Command Modes
EXEC
Device Modes
application-accelerator
replication-accelerator
central-manager
Examples
Table 3-77 describes the fields shown in the show statistics ip display.
Related Commands
show statistics key-manager
To display key manager information for each WAAS device, use the show statistics key-manager EXEC command.
show statistics key-manager
Syntax Description
This command has no arguments or keywords.
Defaults
No default behavior or values
Command Modes
EXEC
Device Modes
central-manager
Examples
Table 3-78 describes the fields shown in the show statistics key-manager display.
Related Commands
show statistics key-manager
show statistics netstat
To display Internet socket connection statistics for a WAAS device, use the show statistics netstat EXEC command.
show statistics netstat
Syntax Description
This command has no arguments or keywords.
Defaults
No default behavior or values
Command Modes
EXEC
Device Modes
application-accelerator
replication-accelerator
central-manager
Examples
Table 3-79 describes the fields shown in the show statistics netstat display.
show statistics radius
To display RADIUS authentication statistics for a WAAS device, use the show statistics radius EXEC command.
show statistics radius
Syntax Description
This command has no arguments or keywords.
Defaults
No default behavior or values
Command Modes
EXEC
Device Modes
application-accelerator
replication-accelerator
central-manager
Examples
Table 3-80 describes the fields shown in the show statistics radius display.
Related Commands
show statistics services
To display services statistics for a WAAS device, use the show statistics services EXEC command.
show statistics services
Syntax Description
This command has no arguments or keywords.
Defaults
No default behavior or values
Command Modes
EXEC
Device Modes
application-accelerator
replication-accelerator
central-manager
Examples
Table 3-81 describes the fields shown in the show statistics services display.
Related Commands
show statistics snmp
To display SNMP statistics for a WAAS device, use the show statistics snmp EXEC command.
show statistics snmp
Syntax Description
This command has no arguments or keywords.
Defaults
No default behavior or values
Command Modes
EXEC
Device Modes
application-accelerator
replication-accelerator
central-manager
Examples
Table 3-82 describes the fields shown in the show statistics snmp display.
Related Commands
show statistics tacacs
To display TACACS+ authentication and authorization statistics for a WAAS device, use the show statistics tacacs EXEC command.
show statistics tacacs
Syntax Description
This command has no arguments or keywords.
Defaults
No default behavior or values
Command Modes
EXEC
Device Modes
application-accelerator
replication-accelerator
central-manager
Examples
Table 3-83 describes the fields shown in the show statistics tacacs display.
Related Commands
show statistics tcp
To display TCP statistics for a WAAS device, use the show statistics tcp EXEC command.
show statistics tcp
Syntax Description
This command has no arguments or keywords.
Defaults
No default behavior or values
Command Modes
EXEC
Device Modes
application-accelerator
replication-accelerator
central-manager
Examples
Table 3-84 describes the fields shown in the show statistics tcp display.
Related Commands
show statistics tfo
To display Traffic Flow Optimization (TFO) statistics for a WAE, use the show statistics tfo EXEC command.
show statistics tfo [application app-name | pass-through | peer | saving app-name]
Syntax Description
Command Modes
EXEC
Device Modes
application-accelerator
Examples
Table 3-85 describes the fields shown in the show statistics tfo command.
Related Commands
show statistics udp
To display User Datagram Protocol (UDP) statistics for a WAAS device, use the show statistics udp EXEC command.
show statistics udp
Syntax Description
This command has no arguments or keywords.
Defaults
No default behavior or values
Command Modes
EXEC
Device Modes
application-accelerator
replication-accelerator
central-manager
Examples
Table 3-86 describes the fields shown in the show statistics udp display.
show statistics wccp
To display WCCP statistics for a WAE, use the show statistics wccp EXEC command.
show statistics wccp gre
Syntax Description
gre |
Displays WCCP generic routing encapsulation packet-related statistics. |
Defaults
No default behavior or values
Command Modes
EXEC
Device Modes
application-accelerator
Usage Guidelines
GRE is a Layer 3 technique that allows datagrams to be encapsulated into IP packets at the WCCP-enabled router and then redirected to a WAE (the transparent proxy server). At this intermediate destination, the datagrams are decapsulated and then routed to an origin server to satisfy the request if a cache miss occurs. In doing so, the trip to the origin server appears to the inner datagrams as one hop. Usually, the redirected traffic using GRE is referred to as GRE tunnel traffic. With GRE, all redirection is handled by the router software.
With WCCP redirection, a Cisco router does not forward the TCP SYN packet to the destination because the router has WCCP enabled on the destination port of the connection. Instead, the WCCP-enabled router encapsulates the packet using GRE tunneling and sends it to the WAE that has been configured to accept redirected packets from this WCCP-enabled router.
After receiving the redirected packet, the WAE does the following:
1. ![]() Strips the GRE layer from the packet.
Strips the GRE layer from the packet.
2. ![]() Decides whether it should accept this redirected packet and process the request for the content as follows:
Decides whether it should accept this redirected packet and process the request for the content as follows:
a. ![]() If the WAE accepts the request, it sends a TCP SYN ACK packet to the client. In this response packet, the WAE uses the IP address of the original destination (origin server) that was specified as the source address so that the WAE can be invisible (transparent) to the client; it acts as if it is the destination that the client's TCP SYN packet was trying to reach.
If the WAE accepts the request, it sends a TCP SYN ACK packet to the client. In this response packet, the WAE uses the IP address of the original destination (origin server) that was specified as the source address so that the WAE can be invisible (transparent) to the client; it acts as if it is the destination that the client's TCP SYN packet was trying to reach.
b. ![]() If the WAE does not accept the request, it reencapsulates the TCP SYN packet in GRE and sends it back to the WCCP-enabled router. The router identifies that the WAE is not interested in this connection and forwards the packet to its original destination (the origin server).
If the WAE does not accept the request, it reencapsulates the TCP SYN packet in GRE and sends it back to the WCCP-enabled router. The router identifies that the WAE is not interested in this connection and forwards the packet to its original destination (the origin server).
For example, a WAE would not accept the request because it is configured to bypass requests that originate from a certain set of clients or that are destined to a particular set of servers.
Examples
Table 3-87 describes the fields shown in the show statistics wccp gre display.
Related Commands
(config) wccp flow-redirect enable
show statistics windows-domain
To display Windows domain server information for a WAAS device, use the show statistics windows-domain EXEC command.
show statistics windows-domain
Syntax Description
This command has no arguments or keywords.
Defaults
No default behavior or values
Command Modes
EXEC
Device Modes
application-accelerator
replication-accelerator
central-manager
Usage Guidelines
Use the show statistics windows-domain EXEC command to view the Windows domain server statistics, then clear the counters for these statistics by entering the clear statistics windows-domain EXEC command.
Examples
Table 3-88 describes the fields shown in the show statistics windows-domain display.
Related Commands
show sysfs volumes
To display system file system (sysfs) information for a WAAS device, use the show sysfs volumes EXEC command.
show sysfs volumes
Syntax Description
This command has no arguments or keywords.
Command Modes
EXEC
Device Modes
application-accelerator
replication-accelerator
central-manager
Usage Guidelines
The system file system (sysfs) stores log files, including transaction logs, syslogs, and internal debugging logs. It also stores system image files and operating system files.
Examples
Table 3-89 describes the fields shown in the show sysfs volumes display.
Related CommandsRelated Commands
show tacacs
To display TACACS+ authentication protocol configuration information for a WAAS device, use the show tacacs EXEC command.
show tacacs
Syntax Description
This command has no arguments or keywords.
Defaults
No default behavior or values
Command Modes
EXEC
Device Modes
application-accelerator
replication-accelerator
central-manager
Examples
Table 3-90 describes the fields shown in the show tacacs display.
Related Commands
show tcp
To display TCP configuration information for a WAAS device, use the show tcp EXEC command.
show tcp
Syntax Description
This command has no arguments or keywords.
Defaults
No default behavior or values
Command Modes
EXEC
Device Modes
application-accelerator
replication-accelerator
central-manager
Examples
Table 3-91 describes the fields shown in the show tcp display. This command displays the settings configured with the tcp global configuration command.
Related Commands
show tech-support
To view information necessary for Cisco's TAC to assist you, use the show tech-support EXEC command.
show tech-support [page]
Syntax Description
page |
(Optional) Displays output page by page. |
Defaults
No default behavior or values
Command Modes
EXEC
Device Modes
application-accelerator
replication-accelerator
central-manager
Usage Guidelines
Use this command to view system information necessary for TAC to assist you with a WAAS device. We recommend that you log the output to a disk file. (See the "(config) logging" command.)
Examples
The following example displays technical support information:
Note ![]() Because the show tech-support command output can be long, excerpts are shown in this example.
Because the show tech-support command output can be long, excerpts are shown in this example.
WAE# show tech-support
------------------ version and hardware --------------------
Cisco Wide Area Application Services Software (WAAS)
Copyright (c) 1999-2006 by Cisco Systems, Inc.
...
Version: ce510-4.0.0.180
Compiled 18:08:17 Feb 16 2006 by cnbuild
System was restarted on Fri Feb 17 23:09:53 2006.
The system has been up for 5 weeks, 3 days, 2 hours, 9 minutes, 49 seconds.
CPU 0 is GenuineIntel Intel(R) Celeron(R) CPU 2.40GHz (rev 2) running at 2401MHz
.
Total 1 CPU.
512 Mbytes of Physical memory.
...
BIOS Information:
Vendor : IBM
Version : -[PLEC52AUS-C.52]-
Rel. Date : 05/19/03
...
List of all disk drives:
Physical disk information:
disk00: Normal (IDE disk) 76324MB( 74.5GB)
disk01: Normal (IDE disk) 76324MB( 74.5GB)
Mounted filesystems:
MOUNT POINT TYPE DEVICE SIZE INUSE FREE USE%
/ root /dev/root 31MB 26MB 5MB 83%
/sw internal /dev/md0 991MB 430MB 561MB 43%
/swstore internal /dev/md1 991MB 287MB 704MB 28%
/state internal /dev/md2 3967MB 61MB 3906MB 1%
/disk00-04 CONTENT /dev/md4 62539MB 32MB 62507MB 0%
/local/local1 SYSFS /dev/md5 3967MB 197MB 3770MB 4%
.../local1/spool PRINTSPOOL /dev/md6 991MB 16MB 975MB 1%
Software RAID devices:
DEVICE NAME TYPE STATUS PHYSICAL DEVICES AND STATUS
/dev/md0 RAID-1 NORMAL OPERATION disk00/00[GOOD] disk01/00[GOOD]
/dev/md1 RAID-1 NORMAL OPERATION disk00/01[GOOD] disk01/01[GOOD]
/dev/md0 RAID-1 NORMAL OPERATION disk00/00[GOOD] disk01/00[GOOD]
/dev/md1 RAID-1 NORMAL OPERATION disk00/01[GOOD] disk01/01[GOOD]
/dev/md2 RAID-1 NORMAL OPERATION disk00/02[GOOD] disk01/02[GOOD]
...
Currently content-filesystems RAID level is not configured to change.
------------------ running configuration -------------------
! WAAS version 4.0.0
!
!
...
------------------ processes --------------------
CPU average usage since last reboot:
cpu: 0.00% User, 1.79% System, 3.21% User(nice), 95.00% Idle
--------------------------------------------------------------------
PID STATE PRI User T SYS T COMMAND
----- ----- --- ------ ------ --------------------
1 S 0 20138 21906 (init)
2 S 0 0 0 (migration/0)
3 S 19 0 0 (ksoftirqd/0)
4 S -10 0 0 (events/0)
5 S -10 0 0 (khelper)
17 S -10 0 0 (kacpid)
93 S -10 0 0 (kblockd/0)
...
Related Commands
show disks details
show processes memory
show cdp entry
show cdp neighbors
show alarms all
show statistics tfo application
show statistics tfo saving
show statistics tfo pass-through
show statistics tfo peer
show tfo bufpool accounting
show policy-engine application
show disks SMART-info
show disks SMART-info details
show disks failed-sectors
show telnet
To display Telnet services configuration for a WAAS device, use the show telnet EXEC command.
show telnet
Syntax Description
This command has no arguments or keywords.
Defaults
Enabled
Command Modes
EXEC
Device Modes
application-accelerator
replication-accelerator
central-manager
Examples
The following example displays whether or not Telnet is enabled on the WAAS device:
WAE# show telnet
telnet service is enabled
Related Commands
show tfo accelerators
To display Traffic Flow Optimization (TFO) accelerators information for a WAE, use the show tfo accelerators EXEC command.
show tfo accelerators
Syntax Description
This command has no arguments or keywords.
Command Modes
EXEC
Device Modes
application-accelerator
Examples
The following example displays TFO accelerator information for the WAE:
WAE# show tfo accelerators
Name: TFO State: Registered, Handling Level: 100%
Keepalive timeout: 3.0 seconds, Session timeouts: 0, Total timeouts: 0
Last keepalive received 00.5 Secs ago
Last registration occurred 11:21:43:38.4 Days:Hours:Mins:Secs ago
Name: EPM State: Registered, Handling Level: 100%
Keepalive timeout: 5.0 seconds, Session timeouts: 0, Total timeouts: 0
Last keepalive received 00.2 Secs ago
Last registration occurred 11:21:43:36.7 Days:Hours:Mins:Secs ago
Name: CIFS State: Not Registered, Handling Level: 0%
Keepalive timeout: 0.0 seconds, Session timeouts: 0, Total timeouts: 0
Last keepalive received -Never-
Last Registration occurred -Never-
Related Commands
show tfo auto-discovery
To display Traffic Flow Optimization (TFO) auto-discovery statistics for a WAE, use the show tfo auto-discovery EXEC command.
show tfo auto-discovery [blacklist {entries [netmask netmask] [|] | statistics [|]}] [list] [| {begin regex [regex] | exclude regex [regex] | include regex [regex]}]
Syntax Description
Command Modes
EXEC
Device Modes
application-accelerator
Examples
The following example displays TFO auto-discovery statistics for the WAE:
WAE# show tfo auto-discovery
Auto discovery structure:
Allocation Failure: 0
Allocation Success: 6615
Deallocations: 6615
Timed Out: 0
Auto discovery table:
Bucket Overflows: 0
Table Overflows: 0
Entry Adds: 6615
Entry Drops: 6615
Entry Count: 0
Lookups: 6624
Bind hash add failures: 0
Route Lookup:
Failures: 0
Success: 0
Socket:
Allocation failures: 0
Accept pair allocation failures: 0
Unix allocation failures: 0
Connect lookup failures: 0
Packets:
Memory allocation failures: 0
Total Sent: 6624
Total Received: 13228
Incorrect length or checksum received: 0
Invalid filtering tuple received: 0
Received for dead connection: 0
Ack dropped in synack received state: 0
Non Syn dropped in nostate state: 0
Auto discovery failure:
No peer or asymmetric route: 6604
Insufficient option space: 0
Invalid connection state: 0
Missing Ack conf: 0
Auto discovery success TO:
Internal server: 0
External server: 0
Auto discovery success FOR:
Internal client: 0
External client: 0
Auto discovery success SYN retransmission:
Zero retransmit: 0
One retransmit: 0
Two+ retransmit: 0
Auto discovery Miscellaneous:
Intermediate device: 0
RST received: 0
SYNs found with our device id: 0
SYN retransmit count resets: 0
Related Commands
show tfo bufpool
To display Traffic Flow Optimization (TFO) buffer pool information for a WAE, use the show tfo bufpool EXEC command.
show tfo bufpool {accounting | from-index index | owner-connection conn-id |
owner-module {RElib | tcpproxy} [from-index index | owner-connection conn-id |
state {free | in-use} [from-index index | owner-connection conn-id | to-index index] |
to-index index] | state {free | in-use} [from-index index | owner-connectionconn-id |
to-index index] | to-index index}
Syntax Description
Command Modes
EXEC
Device Modes
application-accelerator
Examples
The following example displays TFO buffer pool information for the WAE:
WAE# show tfo bufpool accounting
Total buffer pool size: 80740352 bytes
Free buffer: 80740352 bytes, in 78848 units (unit size: 1024 bytes)
Used buffer: 0 bytes, in 0 units
Buffer usage by module:
Tcpproxy: using 0 bytes, in 0 units
RElib: using 0 bytes, in 0 units
LZlib: using 0 bytes, in 0 units
Buffer usage by connection:
Related Commands
show tfo connection
To display Traffic Flow Optimization (TFO) connection information for a WAE, use the show tfo connection EXEC command.
show tfo connection [[summary] | [client-ip host-address | client-port port | peer-id mac |
server-ip host-address | server-port port]]
Syntax Description
Command Modes
EXEC
Device Modes
application-accelerator
Usage Guidelines
Using this command without options displays detailed information about each of the TFO connections for a WAE. To display a summary list of the connections, use the summary option.
For the listed connections that have the F, D or L optimization policy, you can find additional information on DRE statistics by using the show statistics dre connection command with the id option to identify a specific connection id.
Examples
The following example displays a summary of TFO optimized connections for the WAE:
WAE# show tfo connection summary
Optimized Connection List
Policy summary order: Our's, Peer's, Negotiated, Applied
F: Full optimization, D: DRE only, L: LZ Compression, T: TCP Optimization
Local-IP:Port Remote-IP:Port ConId PeerId Policy
10.77.156.99:59950 10.77.156.106:10005 21 00:11:25:ac:3e:04 F,F,F,F
10.77.156.99:59951 10.77.156.106:10007 22 00:11:25:ac:3e:04 F,F,F,F
10.77.156.99:59952 10.77.156.106:10008 23 00:11:25:ac:3e:04 F,F,F,F
10.77.156.99:59953 10.77.156.106:10009 24 00:11:25:ac:3e:04 F,F,F,F
10.77.156.99:59954 10.77.156.106:10010 25 00:11:25:ac:3e:04 F,F,F,F
Related Commands
show statistics dre connection
show tfo egress-methods connection
To display detailed egress method-related information about the connection segments for a WAE, use the show tfo egress-methods connection EXEC command.
show tfo egress-methods connection [local-ip ipaddress | local-port port | remote-ip ipaddress | remote-port port]
Syntax Description
Command Modes
EXEC
Device Modes
application-accelerator
Usage Guidelines
Using this command without options displays detailed information about each of the TFO connections for a WAE.
This command displays egress method-related information about connection segments in an environment where the data flow from start-point to end-point is being transparently intercepted by multiple devices. A connection tuple represents one segment of an end-to-end connection that is intercepted by a WAAS device (WAE) for processing.
For example, a single client-server connection may have three segments (see Figure 3-1):
•![]() Between the client and the Edge WAE
Between the client and the Edge WAE
•![]() Between the Edge WAE and the Core WAE
Between the Edge WAE and the Core WAE
•![]() Between the Core WAE and the server
Between the Core WAE and the server
In this example, the Edge WAE has two connection tuples for the two segments that it participates in:
•![]() One connection tuple to represent the Client—Edge segment
One connection tuple to represent the Client—Edge segment
•![]() One connection tuple to represent the Edge—Core segment
One connection tuple to represent the Edge—Core segment
In the show output, these two connection tuples appear as TUPLE and MATE. (See Table 3-92.) The important information to view is the local and remote IP address of the connection tuple and not whether it is marked as TUPLE or MATE.
Figure 3-1 Topology with Three Segments and Corresponding Connection Tuples
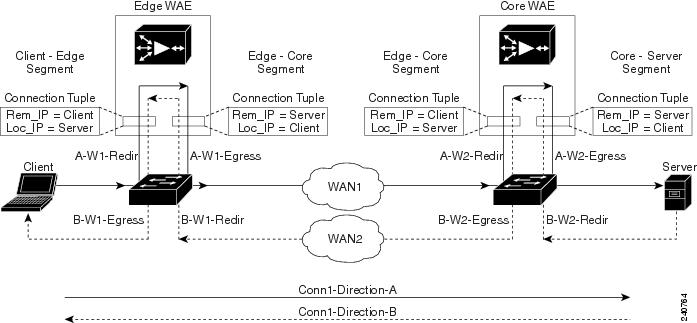
Because the WAAS device is transparent to both the client-end of the connection and the server-end of the connection, the local IP address for a connection tuple depends on the segment in the end-to-end topology.
For example, when WAAS intercepts a packet from the client, this packet enters the connection tuple that represents the Client—Edge segment. On this tuple, the WAAS device appears to the client as though it were the server: the local IP address in this connection tuple is the IP address of the server, while the remote IP address in this connection tuple is that of the client. Similarly, when the Edge WAE sends data to the client, the packet egresses from this connection tuple as though it were coming from the server.
When WAAS sends a packet to the server, the packet egresses from the connection tuple that represents the Edge—Core segment. On this tuple, the WAAS device appears to the server as though it were the client: the local IP address in the connection tuple is the IP address of the client, while the remote IP address in this connection tuple is that of the server. Similarly, when the Edge WAE intercepts a packet from the Core WAE, the data in this connection tuple appears to be coming from the server.
Examples
Table 3-92 describes the fields shown in the show tfo egress-methods connection display.
Each time a packet enters the connection tuple, the intercepting device IP address or MAC address is recorded. The updates field in the command output indicates whether the intercepting device IP address or intercepting device MAC address has been recorded. If, for example, the ID MAC address updates field is zero (0), the MAC address was not recorded, and the ID MAC address field will be blank. The recorded intercepting device information is used when a packet egresses from the WAE.
If the egress method for the connection tuple is IP forwarding, the updates fields are always zero (0) because the intercepting device information is neither required nor recorded for the IP forwarding egress method.
If the intercept method is WCCP GRE redirect and the egress method is WCCP GRE, only the IP address field is updated and recorded. The MAC address information is neither required nor recorded because the destination address in the GRE header only accepts an IP address.
If the intercept method is WCCP L2 redirect and the egress method is WCCP GRE, both the MAC address and the IP address fields are updated and recorded because incoming WCCP L2 packets contain only a MAC header. The MAC address is recorded and the intercepting device IP address is derived from a reverse ARP lookup and is then recorded, also. When packets egress the connection tuple in this scenario, they will have a GRE header with the destination IP address of the intercepting device that was recorded.
The updates count may be greater than 1 in certain topologies. For example, in a redundant router topology, where for the same direction of the same connection between two hosts, packets may be coming in from different intercepting routers. Each time a packet comes in, the intercepting device MAC or IP address is compared against the last recorded address. If the MAC or IP address has changed, the updates field is incremented and the new MAC or IP address is recorded.
Related Commands
show tfo filtering
To display information about the incoming and outgoing TFO flows that the WAE currently has, use the show tfo filtering EXEC command.
show tfo filtering [list [| {begin regex [regex] | exclude regex [regex] | include regex [regex] }]] [| {begin regex [regex] | exclude regex [regex] | include regex [regex]}]
Syntax Description
Command Modes
EXEC
Device Modes
application-accelerator
Usage Guidelines
This command lists TCP flows that the WAE is currently optimizing. It also includes TCP flows that are not being optimized but that are being passed through by the WAE. A "P" in the State column indicates a passed through flow.
Examples
The following examples display TFO connection information for the WAE:
WAE# show tfo filtering
Number of filtering tuples: 2
Packets dropped due to ttl expiry: 0
Packets dropped due to bad route: 0
Syn packets dropped with our own id in the options: 0
Syn packets received and dropped on estab. conn: 0
Syn-Ack packets received and dropped on estab. conn: 0
Packets recvd on in progress conn. and not handled: 0
Packets dropped due to peer connection alive: 0
Packets dropped due to invalid TCP flags: 0
Packets dropped by FB packet input notifier: 0
Packets dropped by FB packet output notifier: 0
Number of errors by FB tuple create notifier: 0
Number of errors by FB tuple delete notifier: 0
Dropped WCCP GRE packets due to invalid WCCP service: 0
Dropped WCCP L2 packets due to invalid WCCP service: 0
WAE# show tfo filtering list
E: Established, S: Syn, A: Ack, F: Fin, R: Reset
s: sent, r: received, O: Options, P: Passthrough
B: Bypass, T: Timedout, C: Closed
Local-IP:Port Remote-IP:Port Tuple(Mate) State
10.99.11.200:1398 10.99.22.200:80 0xcba709c0(0xcba70a00) E
10.99.11.200:1425 10.99.22.200:80 0xcba70780(0xcba707c0) E
10.99.11.200:1439 10.99.22.200:5222 0xcba703c0(0xcba70b40) Sr
10.99.11.200:1440 10.99.22.200:5222 0xcba70400(0xcba70440) Sr
10.99.22.200:1984 10.99.11.200:80 0xcba70600(0xcba70640) E
10.99.22.200:1800 10.99.11.200:23 0xcba70480(0x0 ) PE
10.99.11.200:1392 10.99.22.200:80 0xcba70f80(0x0 ) E
10.99.22.200:20 10.99.11.200:1417 0xcba701c0(0xcba70180) E
10.99.11.200:1417 10.99.22.200:20 0xcba70180(0x0 ) E
10.99.22.200:1987 10.99.11.200:80 0xcba70240(0xcba70200) E
10.99.11.200:1438 10.99.22.200:5222 0xcba70900(0xcba70580) Sr
10.99.22.200:1990 10.99.11.200:80 0xcba70100(0xcba70140) E
10.99.22.200:80 10.99.11.200:1426 0xcba70740(0xcba70700) E
10.99.22.200:80 10.99.11.200:1425 0xcba707c0(0xcba70780) E
10.99.22.200:1985 10.99.11.200:80 0xcba70a40(0xcba70a80) E
10.99.22.200:80 10.99.11.200:1410 0xcba70500(0xcba70540) E
10.99.22.200:80 10.99.11.200:1398 0xcba70a00(0xcba709c0) E
10.99.22.200:80 10.99.11.200:1392 0xcba70f40(0xcba70f80) E
10.0.19.5:54247 10.1.242.5:80 0xc9e5b400(0xc9e5b100) ED
Note ![]() Some state descriptions are missing from the legend. D = Done. The "ED" state occurs when one socket in the pair is closed (D), but the mate is still established (E).
Some state descriptions are missing from the legend. D = Done. The "ED" state occurs when one socket in the pair is closed (D), but the mate is still established (E).
Related Commands
show tfo status
To display global Traffic Flow Optimization (TFO) status information for a WAE, use the show tfo status EXEC command.
show tfo status
Command Modes
EXEC
Device Modes
application-accelerator
Examples
The following example displays global TFO status information for the WAE:
WAE# show tfo status
Optimization Status:
Configured: optimize full
Current: optimize full
TFO is up since Sat Feb 25 13:18:51 2006
TFO is functioning normally.
Total number of optimized connections since start: 0
Number of active connections: 0
Total number of peers: 0
Related Commands
show tfo synq
To display the cumulative statistics for the SynQ module, use the show tfo synq EXEC command.
show tfo synq [list [| {begin regex [regex] | exclude regex [regex] | include regex [regex]}]] [| {begin regex [regex] | exclude regex [regex] | include regex [regex]}]
Syntax Description
Command Modes
EXEC
Device Modes
application-accelerator
Usage Guidelines
Use the show tfo synq list command to list connections that are currently being tracked in the SynQ module.
Examples
The following example displays the output for the show tfo synq command:
WWAE# show tfo synq
Synq structures allocations success: 0
Synq structures allocations failure: 0
Synq structures deallocations: 0
Synq table entry adds: 0
Synq table entry drops: 0
Synq table entry lookups: 0
Synq table overflows: 0
Synq table entry count: 0
Packets received by synq: 0
Packets received with invalid filtering tuple: 0
Non-syn packets received: 0
Locally originated/terminating syn packets received: 0
Retransmitted syn packets received while in Synq: 0
Synq user structure allocations success: 0
Synq user structure allocations failure: 0
Synq user structure deallocations: 0
show transaction-logging
To display the transaction log configuration settings and a list of archived transaction log files for a WAE, use the show transaction-logging EXEC command.
show transaction-logging
Syntax Description
This command has no arguments or keywords.
Defaults
No default behavior or values
Command Modes
EXEC
Device Modes
application-accelerator
Usage Guidelines
Use the show transaction-log or show transaction-logging EXEC commands to display information about the current configuration of transaction logging on a WAE. Both of these EXEC commands display the same output. Transaction log file information is displayed for HTTP and WMT MMS caching proxy transactions and TFTP and ICAP transactions.
Note ![]() For security reasons, passwords are never displayed in the output of the show transaction-log EXEC command.
For security reasons, passwords are never displayed in the output of the show transaction-log EXEC command.
Examples
The following example displays information about the current configuration of transaction logging on a WAE:
WAAE# show transaction-logging
Transaction log configuration:
---------------------------------------
TFO Logging is disabled.
TFO Archive interval: every-day every 1 hour
TFO Maximum size of archive file: 2000000 KB
TFO logging to remote syslog host is disabled.
TFO remote syslog host is not configured.
TFO facility is the default "*" which is "user".
Exporting files to ftp servers is disabled.
Related Commands
show user
To display user identification number and username information for a particular user of a WAAS device, use the show user EXEC command.
show user {uid number | username name}
Syntax Description
Command Default
No default behavior or values
Command Modes
EXEC
Device Modes
application-accelerator
replication-accelerator
central-manager
Examples
Table 3-93 describes the fields shown in the show user display.
Related Commands
show users administrative
To display users with administrative privileges or users that have been locked out, use the show users administrative EXEC command.
show users administrative {history | logged-in | locked-out}
Syntax Description
Defaults
No default behavior or values
Command Modes
EXEC
Device Modes
application-accelerator
replication-accelerator
central-manager
Examples
The following example displays a list of users that had logged in to an appliance in the past:
WAE# show users administrative history
<username> <line> <ip address/host> <login details>
<username> <line> <ip address/host> <login details>
<username> <line> <ip address/host> <login details>
Table 3-94 describes the fields shown in the show users administrative history display.
The following example displays a list of users that are currently logged in to an appliance:
WAE# show users administrative logged-in
<username> <line> <ip address/host> <login details>
<username> <line> <ip address/host> <login details>
<username> <line> <ip address/host> <login details>
Table 3-95 describes the fields shown in the show users administrative logged-in display.
The following example displays a list of users that are locked out of the appliance:
WAE# show users administrative locked-out
<username>
<username>
You can use the username data with the clear users locked-out username username EXEC mode command. See "clear users".
Related Commands
show version
To display version information about the WAAS software that is running on the WAAS device, use the show version EXEC command.
show version [last | pending]
Syntax Description
last |
Displays the version information for the last saved image. |
pending |
Displays the version information for the pending upgraded image. |
Defaults
No default behavior or values
Command Modes
EXEC
Device Modes
application-accelerator
replication-accelerator
central-manager
Examples
Table 3-96 describes the fields shown in the show version display.
show wccp
To display Web Cache Connection Protocol (WCCP) information for a WAE, use the show wccp EXEC command.
show wccp wide-area-engines
show wccp flows {tcp-promiscuous} [summary]
show wccp gre
show wccp masks {tcp-promiscuous} [summary]
show wccp routers
show wccp services [detail]
show wccp slowstart {tcp-promiscuous} [summary]
show wccp status
Syntax Description
Defaults
No default behavior or values
Command Modes
EXEC
Device Modes
application-accelerator
Examples
The following example shows the output of the show wccp services command:
WAE# show wccp services
Services configured on this File Engine
TCP Promiscuous 61
TCP Promiscuous 62
The following example is partial output from the show wccp services detail command:
WAE# show wccp services detail
Service Details for TCP Promiscuous 61 Service
Service Enabled : Yes
Service Priority : 34
Service Protocol : 6
Application : Unknown
Service Flags (in Hex) : 501
Service Ports : 0 0 0 0
: 0 0 0 0
Security Enabled for Service : No
Multicast Enabled for Service : No
Weight for this Web-CE : 0
Negotiated forwarding method : GRE
Negotiated assignment method : HASH
Negotiated return method : GRE
Received Values:
Source IP mask (in Hex) : 0
Destination IP mask (in Hex) : 0
Source Port mask (in Hex) : 0
Destination Port mask (in Hex) : 0
Calculated Values:
Source IP mask (in Hex) : 0
Destination IP mask (in Hex) : 1741
Source Port mask (in Hex) : 0
Destination Port mask (in Hex) : 0
Service Details for TCP Promiscuous 62 Service
Service Enabled : Yes
Service Priority : 34
Service Protocol : 6
Application : Unknown
Service Flags (in Hex) : 502
Service Ports : 0 0 0 0
: 0 0 0 0
Security Enabled for Service : No
Multicast Enabled for Service : No
Weight for this Web-CE : 0
Negotiated forwarding method : GRE
Negotiated assignment method : HASH
Negotiated return method : GRE
Received Values:
Source IP mask (in Hex) : 0
Destination IP mask (in Hex) : 0
Source Port mask (in Hex) : 0
Destination Port mask (in Hex) : 0
Calculated Values:
Source IP mask (in Hex) : 0
Destination IP mask (in Hex) : 1741
Source Port mask (in Hex) : 0
Destination Port mask (in Hex) : 0
The following example is the output from the show wccp routers command:
WAE# show wccp routers
Router Information for Service: TCP Promiscuous 61
Routers Configured and Seeing this File Engine(1)
Router Id Sent To Recv ID
0.0.0.0 10.10.20.1 00000000
Routers not Seeing this File Engine
10.10.20.1
Routers Notified of but not Configured
-NONE-
Multicast Addresses Configured
-NONE-
Router Information for Service: TCP Promiscuous 62
Routers Configured and Seeing this File Engine(1)
Router Id Sent To Recv ID
0.0.0.0 10.10.20.1 00000000
Routers not Seeing this File Engine
10.10.20.1
Routers Notified of but not Configured
-NONE-
Multicast Addresses Configured
-NONE-
The following example is the output from the show wccp status command:
WAE# show wccp status
WCCP version 2 is enabled and currently active
Table 3-97 describes the fields shown in the show wccp gre display.
Related Commands
(config) wccp flow-redirect enable
show windows-domain
To display Windows domain configuration information for a WAAS device, use the show windows-domain EXEC command.
show windows-domain
Syntax Description
This command has no arguments or keywords.
Command Modes
EXEC
Device Modes
application-accelerator
replication-accelerator
central-manager
Examples
Table 3-98 describes the fields shown in the show windows-domain display.
Related Commands
shutdown
To shut down the WAAS device use the shutdown EXEC command.
shutdown [poweroff]
Syntax Description
poweroff |
(Optional) Turns off the power after closing all applications and operating system. |
Defaults
No default behavior or values
Command Modes
EXEC
Device Modes
application-accelerator
replication-accelerator
central-manager
Usage Guidelines
A controlled shutdown refers to the process of properly shutting down a WAAS device without turning off the power on the device. With a controlled shutdown, all of the application activities and the operating system are properly stopped on a WAE, but the power remains on. Controlled shutdowns of a WAAS device can help you minimize the downtime when the WAAS device is being serviced.
Note ![]() A WAAS device cannot be powered on again through the WAAS software after a software poweroff. You must press the power button once on a WAAS device to bring it back online.
A WAAS device cannot be powered on again through the WAAS software after a software poweroff. You must press the power button once on a WAAS device to bring it back online.
The shutdown EXEC command facilitates a proper shutdown for WAAS device, and is supported on all WAE hardware models. The shutdown poweroff command is also supported by all of the WAE hardware models as they support the ACPI.
The shutdown command closes all applications and stops all system activities, but keeps the power on. The fans continue to run and the power LED is on, indicating that the device is still powered on. The device console displays the following menu after the shutdown process is completed:
================= SHUTDOWN SHELL =================
System has been shut down.
You can
0. Power down system by pressing and holding power button
1. Reload system by software
2. Power down system by software
[1-2]?
The shutdown poweroff command closes all applications and the operating system, stops all system activities, and turn off the power. The fans stop running and the power LED starts flashing, indicating that the device has been powered off.
Note ![]() If you use the shutdown or shutdown poweroff commands, the device does not perform a file system check when you power on and boot the device the next time.
If you use the shutdown or shutdown poweroff commands, the device does not perform a file system check when you power on and boot the device the next time.
Table 3-99 describes the shutdown-only operation and the shutdown poweroff operation for a WAAS device.
You can enter the shutdown EXEC command from a console session or from a remote session (Telnet or SSH version 1 or SSH version 2) to perform shutdown on a WAAS device.
To perform a shutdown on a WAAS device, enter the shutdown EXEC command as follows:
WAE# shutdown
When you are asked if you want to save the system configuration, enter yes.
System configuration has been modified. Save?[yes]:yes
When you are asked if you want to proceed with the shutdown, press Enter to proceed with the shutdown operation.
Device can not be powered on again through software after shutdown.
Proceed with shutdown?[confirm]
A message appears, reporting that all services are being shut down on this WAE.
Shutting down all services, will timeout in 15 minutes.
shutdown in progress ..System halted.
After the system is shut down (the system has halted), a WAAS software shutdown shell displays the current state of the system (for example, "System has been shut down") on the console. You are asked whether you want to perform a software power off (the Power down system by software option), or if you want to reload the system through the software.
================= SHUTDOWN SHELL =================
System has been shut down.
You can either
Power down system by pressing and holding power button
or
1. Reload system through software
2. Power down system through software
To power down the WAAS device, press and hold the power button on the WAAS device, or use one of the following methods to perform a shutdown poweroff:
•![]() From the console command line, enter 2 when prompted, as follows:
From the console command line, enter 2 when prompted, as follows:
================= SHUTDOWN SHELL =================
System has been shut down.
You can either
Power down system by pressing and holding power button
or
1. Reload system through software
2. Power down system through software
•![]() From the WAAS CLI, enter the shutdown poweroff EXEC command as follows:
From the WAAS CLI, enter the shutdown poweroff EXEC command as follows:
WAE# shutdown poweroff
When you are asked if you want to save the system configuration, enter yes.
System configuration has been modified. Save?[yes]:yes
When you are asked to confirm your decision, press Enter.
Device can not be powered on again through software after poweroff.
Proceed with poweroff?[confirm]
Shutting down all services, will timeout in 15 minutes.
poweroff in progress ..Power down.
Examples
The following example shows that the shutdown command is used to close all applications and stop all system activities:
WAE1# shutdown
System configuration has been modified. Save?[yes]:yes
Device can not be powered on again through software after shutdown.
Proceed with shutdown?[confirm]
Shutting down all services, will timeout in 15 minutes.
shutdown in progress ..System halted.
The following example shows that the shutdown poweroff command is used to close all applications, stop all system activities, and then turn off power to the WAAS device:
WAE2# shutdown poweroff
System configuration has been modified. Save?[yes]:yes
Device can not be powered on again through software after poweroff.
Proceed with poweroff?[confirm]
Shutting down all services, will timeout in 15 minutes.
poweroff in progress ..Power down.
snmp trigger
To configure thresholds for a user-selected MIB object for monitoring purposes on a WAAS device, use the snmp trigger EXEC command. Use the no form of this command to return the setting to the default value.
snmp trigger {create mibvar [wildcard] [wait-time [absent [LINE | mibvar1 mibvar1] [LINE | mibvar2 mibvar2] [LINE | mibvar3 mibvar3] [LINE] | equal [absolute value [[LINE | mibvar1 mibvar1] [LINE | mibvar2 mibvar2] [LINE | mibvar3 mibvar3] [LINE] | delta value [LINE | mibvar1 mibvar1] [LINE | mibvar2 mibvar2] [LINE | mibvar3 mibvar3] [LINE]] | falling [absolute value [LINE | mibvar1 mibvar] [LINE | mibvar2 mibvar2] [LINE | mibvar3 mibvar3] [LINE] | delta value [LINE | mibvar1 mibvar1] [LINE | mibvar2 mibvar2] [LINE | mibvar3 mibvar3] [LINE]] | greater-than [absolute value [LINE | mibvar1 mibvar1] [LINE | mibvar2 mibvar2] [LINE | mibvar3 mibvar3] [LINE] | delta value [LINE | mibvar1 mibvar1] [LINE | mibvar2 mibvar2] [LINE | mibvar3 mibvar3] [LINE]] | less-than [absolute value [LINE | mibvar1 mibvar1] [LINE | mibvar2 mibvar2] [LINE | mibvar3 mibvar3] [LINE] | delta value [LINE | mibvar1 mibvar1] [LINE | mibvar2 mibvar2] [LINE | mibvar3 mibvar3] [LINE]] | on-change [[LINE | mibvar1 mibvar1][LINE | mibvar2 mibvar2] [LINE | mibvar3 mibvar3] [LINE]] | present [LINE | mibvar1 mibvar1] [LINE | mibvar2 mibvar2] [LINE | mibvar3 mibvar3] [LINE] | rising [absolute value [LINE | mibvar1 mibvar1] [LINE | mibvar2 mibvar2] [LINE | mibvar3 mibvar3] [LINE] | delta value [LINE | mibvar1 mibvar1] [LINE | mibvar2 mibvar2] [LINE | mibvar3 mibvar3] [LINE]]]] | delete mibvar}
Syntax Description
Defaults
No default behavior or values
Command Modes
EXEC
Device Modes
application-accelerator
replication-accelerator
central-manager
Usage Guidelines
Using the snmp trigger global configuration command, you can define additional SNMP traps for other MIB objects of interest to your particular configuration. You can select any MIB object from any of the support MIBs for your trap. The trap can be triggered based on a variety of tests:
•![]() absent—A specified MIB object that was present at the last sampling is no longer present as of the current sampling.
absent—A specified MIB object that was present at the last sampling is no longer present as of the current sampling.
•![]() equal—The value of the specified MIB object is equal to the specified threshold.
equal—The value of the specified MIB object is equal to the specified threshold.
•![]() falling—The value of the specified MIB object has fallen below the specified threshold value. After a trap is generated against this condition, another trap for this same condition is not generated until the sampled MIB object value rises above the threshold value and then falls below the falling threshold value again.
falling—The value of the specified MIB object has fallen below the specified threshold value. After a trap is generated against this condition, another trap for this same condition is not generated until the sampled MIB object value rises above the threshold value and then falls below the falling threshold value again.
•![]() greater-than—The value of the specified MIB object is greater than the specified threshold value.
greater-than—The value of the specified MIB object is greater than the specified threshold value.
•![]() less-than—The value of the specified MIB object is less than the specified threshold value.
less-than—The value of the specified MIB object is less than the specified threshold value.
•![]() on-change—The value of the specified MIB object has changed since the last sampling.
on-change—The value of the specified MIB object has changed since the last sampling.
•![]() present—A specified MIB object is present as of the current sampling that was not present at the previous sampling.
present—A specified MIB object is present as of the current sampling that was not present at the previous sampling.
•![]() rising—The value of the specified MIB object has risen above the specified threshold. After a trap is generated against this condition, another trap for this same condition is not generated until the sampled MIB object value falls below the threshold value and then rises above the rising threshold value again.
rising—The value of the specified MIB object has risen above the specified threshold. After a trap is generated against this condition, another trap for this same condition is not generated until the sampled MIB object value falls below the threshold value and then rises above the rising threshold value again.
The threshold value can be based on an absolute sample type or on a delta sample type. An absolute sample type is one in which the test is evaluated against a fixed integer value between zero and 4294967295. A delta sample type is one in which the test is evaluated against the change in the MIB object value between the current sampling and the previous sampling.
After you configure SNMP traps, you must use the snmp-server enable traps event global configuration command for the event traps you just created to be generated. Also, to preserve SNMP trap configuration across a system reboot, you must configure event persistence using the snmp mib persist event global configuration command, and save the MIB data using the write mib-data EXEC command.
Examples
The following example shows how to create a threshold for the MIB object esConTabIsConnected so that a trap is sent when the connection from the Edge WAE to the Core WAE is lost:
WAE# snmp trigger create esConTabIsConnected ?
<60-600> The number of seconds to wait between trigger sample
wildcard Option to treat the MIB variable as wildcarded
WAE# snmp trigger create esConTabIsConnected wildcard 600 ?
absent Absent existence test
equal Equality threshold test
falling Falling threshold test
greater-than Greater-than threshold test
less-than Less-than threshold test
on-change Changed existence test
present Present present test
rising Rising threshold test
WAE# snmp trigger create esConTabIsConnected wildcard 600 falling ?
absolute Absolute sample type
delta Delta sample type
WAE# snmp trigger create esConTabIsConnected wildcard 600 falling absolute ?
<0-4294967295> Falling threshold value
WAE# snmp trigger create esConTabIsConnected wildcard 600 falling absolute 1 ?
LINE Trigger-comment
mibvar1 Optional mib object to add to the notification
WAE# snmp trigger create esConTabIsConnected wildcard 600 falling absolute 1 "Lost the
connection with the core server."
WAE# configure
WAE(config)# snmp-server enable traps event
Once you have configured the WAE to send SNMP traps, you can view the results of these newly created traps using the show snmp events EXEC command.
You can also delete user-created SNMP traps. The following example shows how to delete the trap set for esConTabIsConnected that we created in the previous example.
WAE# snmp trigger delete esConTabIsConnected
Related Commands
(config) snmp-server community
(config) snmp-server enable traps
(config) snmp-server mib persist event
(config) snmp-server notify inform
ssh
To allow secure encrypted communications between an untrusted client machine and a WAAS device over an insecure network, use the ssh EXEC command.
ssh options
Syntax Description
options |
Options to use with the ssh EXEC command. For more information about the possible options, see Request for Comments (RFC 4254) at http://www.rfc-archive.org/getrfc.php?rfc=4254. |
Defaults
By default, the Secure Shell (SSH) feature is disabled on a WAAS device.
Command Modes
EXEC
Device Modes
application-accelerator
replication-accelerator
central-manager
Usage Guidelines
SSH consists of a server and a client program. Like Telnet, you can use the client program to remotely log in to a machine that is running the SSH server, but unlike Telnet, messages transported between the client and the server are encrypted. The functionality of SSH includes user authentication, message encryption, and message authentication.
Note ![]() The Telnet daemon can still be used with the WAAS device. SSH does not replace Telnet.
The Telnet daemon can still be used with the WAAS device. SSH does not replace Telnet.
Related Commands
tcpdump
To dump network traffic, use the tcpdump EXEC command.
tcpdump [LINE]
Syntax Description
LINE |
(Optional) Dump options. |
Defaults
No default behavior or values
Command Modes
EXEC
Device Modes
application-accelerator
replication-accelerator
central-manager
Usage Guidelines
TCPdump is a utility that allows a user to intercept and capture packets passing through a network interface, making it useful for troubleshooting network applications.
During normal network operation, only the packets which are addressed to a network interface are intercepted and passed on to the upper layers of the TCP/IP protocol layer stack. Packets which are not addressed to the interface are ignored. In Promiscuous mode, the packets which are not intended to be received by the interface are also intercepted and passed on to the higher levels of the protocol stack. TCPdump works by putting the network interface into promiscuous mode. TCPdump uses the free libpcap (packet capture library).
Use the -h option to view the options available, as shown in this example:
WAE# tcpdump -h
tcpdump version 3.8.1 (jlemon)
libpcap version 0.8
Usage: tcpdump [-aAdDeflLnNOpqRStuUvxX] [-c count] [ -C file_size ]
[ -E algo:secret ] [ -F file ] [ -i interface ] [ -r file ]
[ -s snaplen ] [ -T type ] [ -w file ] [ -y datalinktype ]
[ expression ]
Examples
The following example starts a network traffic dump to a file named tcpdump.txt:
WAE# tcpdump -w tcpdump.txt
Related Commands
telnet
To log in to a WAAS device using the Telnet client, use the telnet EXEC command.
telnet {hostname | ip-address} [portnum]
Syntax Description
hostname |
Hostname of the network device. |
ip-address |
IP address of the network device. |
portnum |
(Optional) Port number (1-65535). Default port number is 23. |
Defaults
The default port number is 23.
Command Modes
EXEC
Device Modes
application-accelerator
replication-accelerator
central-manager
Usage Guidelines
UNIX shell functions such as escape and the suspend command are not available in the Telnet client. Multiple Telnet sessions are also not supported. This Telnet client allows you to specify a destination port.
Examples
The following example shows several ways that you can log in to a WAAS device using the Telnet client:
WAE# telnet cisco-wae
WAE# telnet 10.168.155.224
WAE# telnet cisco-wae 2048
WAE# telnet 10.168.155.224 2048
Related Commands
terminal
To set the number of lines displayed in the console window, or to display the current console debug command output, use the terminal EXEC command.
terminal {length length | monitor [disable]}
Syntax Description
Defaults
The default is 24 lines.
Command Modes
EXEC
Device Modes
application-accelerator
replication-accelerator
central-manager
Usage Guidelines
When 0 is entered as the length parameter, the output to the screen does not pause. For all nonzero values of length, the -More- prompt is displayed when the number of output lines matches the specified length number. The -More- prompt is considered a line of output. To view the next screen, press the Spacebar. To view one line at a time, press the Enter key.
The terminal monitor command allows a Telnet session to display the output of the debug commands that appear on the console. Monitoring continues until the Telnet session is terminated.
Examples
The following example sets the number of lines to display to 20:
WAE# terminal length 20
The following example configures the terminal for no pausing:
WAE# terminal length 0
Related Commands
All show commands
tethereal
To analyze network traffic from the command line, use the tethereal EXEC command.
tethereal [LINE]
Syntax Description
LINE |
(Optional) Options. |
Defaults
No default behavior values
Command Modes
EXEC
Device Modes
application-accelerator
replication-accelerator
central-manager
Usage Guidelines
Tethereal is the command line version of the network traffic analyzer tool Ethereal. Like TCPdump, it also uses the packet capture library (libpcap). Aside from network traffic analysis, Tethereal also provides facilities for decoding packets.
The following example shows the options available with the WAAS tethereal command:
WAE# tethereal -h
This is GNU tethereal 0.10.6
(C) 1998-2004 Gerald Combs <gerald@ethereal.com>
Compiled with GLib 1.2.9, with libpcap 0.6, with libz 1.1.3, without libpcre,
without UCD-SNMP or Net-SNMP, without ADNS.
NOTE: this build does not support the "matches" operator for Ethereal filter
syntax.
Running with libpcap (version unknown) on Linux 2.4.16.
tethereal [ -vh ] [ -DlLnpqSVx ] [ -a <capture autostop condition> ] ...
[ -b <number of ring buffer files>[:<duration>] ] [ -c <count> ]
[ -d <layer_type>==<selector>,<decode_as_protocol> ] ...
[ -f <capture filter> ] [ -F <output file type> ] [ -i <interface> ]
[ -N <resolving> ] [ -o <preference setting> ] ... [ -r <infile> ]
[ -R <read filter> ] [ -s <snaplen> ] [ -t <time stamp format> ]
[ -T pdml|ps|psml|text ] [ -w <savefile> ] [ -y <link type> ]
[ -z <statistics string> ]
Valid file type arguments to the "-F" flag:
libpcap - libpcap (tcpdump, Ethereal, etc.)
rh6_1libpcap - RedHat Linux 6.1 libpcap (tcpdump)
suse6_3libpcap - SuSE Linux 6.3 libpcap (tcpdump)
modlibpcap - modified libpcap (tcpdump)
nokialibpcap - Nokia libpcap (tcpdump)
lanalyzer - Novell LANalyzer
ngsniffer - Network Associates Sniffer (DOS-based)
snoop - Sun snoop
netmon1 - Microsoft Network Monitor 1.x
netmon2 - Microsoft Network Monitor 2.x
ngwsniffer_1_1 - Network Associates Sniffer (Windows-based) 1.1
ngwsniffer_2_0 - Network Associates Sniffer (Windows-based) 2.00x
visual - Visual Networks traffic capture
5views - Accellent 5Views capture
niobserverv9 - Network Instruments Observer version 9
default is libpcap
Related Commands
traceroute
To trace the route between a WAAS device to a remote host, use the traceroute EXEC command.
traceroute {hostname | ip-address}
Syntax Description
hostname |
Name of remote host. |
ip-address |
IP address of remote host. |
Defaults
No default behavior values
Command Modes
EXEC
Device Modes
application-accelerator
replication-accelerator
central-manager
Usage Guidelines
Traceroute is a widely available utility on most operating systems. Much like ping, it is a valuable tool for determining connectivity in a network. Ping allows the user to find out if there is a connection between two end systems. Traceroute does this as well, but also lists the intermediate routers between the two systems. Users can therefore see the possible routes packets can take from one system to another. Use traceroute to find the route to a remote host, when either the hostname or the IP address is known.
Examples
The following example traces the route between the WAAS device and a device with an IP address of 10.0.0.0:
WAE# traceroute 10.0.0.0
traceroute to 10.0.0.0 (10.0.0.0), 30 hops max, 38 byte packets
1 sblab2-rtr.abc.com (192.168.10.1) 0.959 ms 0.678 ms 0.531 ms
2 192.168.1.1 (192.168.1.1) 0.665 ms 0.576 ms 0.492 ms
3 172.24.115.66 (172.24.115.66) 0.757 ms 0.734 ms 0.833 ms
4 sjc20-sbb5-gw2.abc.com (192.168.180.93) 0.683 ms 0.644 ms 0.544 ms
5 sjc20-rbb-gw5.abc.com (192.168.180.9) 0.588 ms 0.611 ms 0.569 ms
6 sjce-rbb-gw1.abc.com (172.16.7.249) 0.746 ms 0.743 ms 0.737 ms
7 sj-wall-2.abc.com (172.16.7.178) 1.505 ms 1.101 ms 0.802 ms
8 * * *
9 * * *
.
.
.
29 * * *
30 * * *
Related Commands
transaction-log
To force the exporting or the archiving of the transaction log, use the transaction-log EXEC command.
transaction-log {export | tfo force archive}
Syntax Description
export |
Forces the archiving of a WAE's transaction file. |
tfo force archive |
Forces the archiving of the Traffic Flow Optimization (TFO) transaction log file. |
Command Modes
EXEC
Device Modes
application-accelerator
Examples
The following example forces the archiving of the transaction file on the WAE:
WAE# transaction-log export
The following example forces the archiving of a WAE's TFO transaction log file:
WAE# transaction-log tfo force archive
Related Commands
type
To display a file, use the type EXEC command.
type filename
Syntax Description
filename |
Name of file. |
Defaults
No default behavior or values
Command Modes
EXEC
Device Modes
application-accelerator
replication-accelerator
central-manager
Usage Guidelines
Use this EXEC command to display the contents of a file within any file directory on a WAAS device. This command may be used to monitor features such as transaction logging or system logging (syslog).
Examples
The following example shows how to display the contents of the syslog.txt file:
WAE# type /local1/syslog.txt
Related Commands
type-tail
To view a specified number of lines of the end of a log file, to view the end of the file continuously as new lines are added to the file, to start at a particular line in the file, or to include or exclude specific lines in the file, use the type-tail command in EXEC mode.
type-tail filename [line | follow | | {begin LINE | exclude LINE | include LINE}]
Syntax Description
Defaults
Last ten lines are shown.
Command Modes
EXEC
Device Modes
application-accelerator
replication-accelerator
central-manager
Usage Guidelines
This EXEC command allows you to monitor a log file by letting you view the end of the file. You can specify the number of lines at the end of the file that you want to view, or you can follow the last line of the file as it continues to log new information. To stop the last line from continuously scrolling as with the follow option, use the key sequence Ctrl-C.
You can further indicate the type of information to display using the output modifiers. These allow you to include or exclude specific lines or to indicate where to begin displaying the file.
Examples
The following example looks for a list of log files in the /local1 directory and then displays the last ten lines of the syslog.txt file. In this example, the number of lines to display is not specified, so the default of ten lines is used:
WAE# ls /local1
actona
core_dir
crash
dbupgrade.log
downgrade
errorlog
logs
lost+found
sa
service_logs
spool
syslog.txt
syslog.txt.1
syslog.txt.2
syslog.txt.3
syslog.txt.4
var
wdd.sh.signed
WAE# type-tail /local1/syslog.txt
Apr 17 00:21:09 edge-wae-11 java: %CE-CMS-4-700001: unable to get https
equest throughput stats(error 4)
Apr 17 00:21:09 edge-wae-11 java: %CE-CMS-4-700001: ds_getStruct got err
r : 4 for key stat/cache/ftp connection 5
Apr 17 00:21:09 edge-wae-11 java: %CE-CMS-4-700001: ds_getStruct: unable
to get `stat/cache/ftp' from dataserver
Apr 17 00:21:09 edge-wae-11 java: %CE-CMS-4-700001: unable to get ftp-ov
r-http request throughput stats(error 4)
Apr 17 00:21:09 edge-wae-11 java: %CE-CMS-4-700001: setValues getMethod
all ...
Apr 17 00:21:09 edge-wae-11 java: %CE-CMS-4-700001: setValues found...
Apr 17 00:21:48 edge-wae-11 java: %CE-CMS-4-700001: ds_getStruct got err
r : 4 for key stat/cache/http/perf/throughput/requests/sum connection 5
Apr 17 00:21:48 edge-wae-11java: %CE-CMS-4-700001: ds_getStruct: unable
to get `stat/cache/http/perf/throughput/requests/sum' from dataserver
Apr 17 00:21:48 edge-wae-11 java: %CE-CMS-4-700001: unable to get http r
quest throughput stats(error 4)
Apr 17 00:23:20 edge-wae-11 java: %CE-TBD-3-100000: WCCP_COND_ACCEPT: TU
LE DELETE conditional accept tuple {Source IP [port] = 0.0.0.0 [0] Destinatio
IP [port] = 32.60.43.2 [53775] }returned error: -1 errno 9
The following example follows the syslog.txt file as it grows:
WAE# type-tail /local1/syslog.txt follow
undebug
To disable debugging functions, use the undebug EXEC command. (See also the no form of the debug EXEC command.)
In the application-accelerator device mode, the undebug commands are as follows:
undebug aaa accounting
undebug all
undebug authentication {content-request | user | windows-domain}
undebug buf {all | dmbuf | dmsg}
undebug cdp {adjacency | events | ip | packets}
undebug cli {all | bin | parser}
undebug cms
undebug dataserver {all | clientlib | server}
undebug dhcp
undebug dre {aggregation | all | cache | connection {aggregation [acl] | cache [acl] | core [acl] | message [acl] | misc [acl] | acl} | core | lz | message | misc}
undebug epm
undebug flow monitor tcpstat-v1
undebug logging all]
undebug ntp
undebug print-spooler {all | brief | errors | warnings}
undebug rbcp
undebug snmp {all | cli | main | mib | traps}
undebug tfo {buffer-mgr | connection [auto-discovery [acl] | comp-mgr [acl] | conn-mgr [acl] | egress-method [acl] | filtering [acl] | netio-engine [acl] | policy-engine [acl] | synq [acl] | acl] | stat-mgr | translog}
undebug translog export
undebug wafs {{all | core-fe | edge-fe | manager | utilities} {debug | error | info | warn}}
undebug wccp {all | detail | error | events | keepalive | packets | slowstart}
Note ![]() The dre, epm, flow, print-spooler, rbcp, tfo, translog, wafs, and wccp command options are supported in the application-accelerator device mode only.
The dre, epm, flow, print-spooler, rbcp, tfo, translog, wafs, and wccp command options are supported in the application-accelerator device mode only.
In the central manager device mode, the undebug commands are as follows:
undebug aaa accounting
undebug all
undebug authentication {content-request | user | windows-domain}
undebug buf {all | dmbuf | dmsg}
undebug cdp {adjacency | events | ip | packets}
undebug cli {all | bin | parser}
undebug cms
undebug dataserver {all | clientlib | server}
undebug dhcp
undebug emdb [level [levelnum]]
undebug logging all
undebug ntp
undebug rpc {detail | trace}
undebug snmp {all | cli | main | mib | traps}
Note ![]() The emdb, key-manager, and rpc command options are supported in the central manager device mode only.
The emdb, key-manager, and rpc command options are supported in the central manager device mode only.
Syntax Description
The following syntax table describes the options that are available in the central manager device mode:
Defaults
No default behavior or values
Command Modes
EXEC
Device Modes
application-accelerator
replication-accelerator
central-manager
Usage Guidelines
We recommend that the debug and undebug commands be used only at the direction of Cisco Systems technical support personnel.
Related Commands
wafs
To back up, restore, or create a system report about the Wide Area File Services (WAFS)-related network configuration, plus the configurations of file servers, printers, users, and so forth, on a WAE, use the wafs EXEC command.
wafs {backup-config filename | restore-config filename |
sysreport [filename | date-range from_date end_date filename]}
Note ![]() Executing the wafs sysreport command can temporarily impact the performance of your WAE.
Executing the wafs sysreport command can temporarily impact the performance of your WAE.
Syntax Description
Defaults
No default behavior or values
Command Modes
EXEC
Device Modes
application-accelerator
Usage Guidelines
The wafs backup-config EXEC command is used when back up of basic network configuration is not sufficient (performed using the copy running-config command), for example, when you want to back up system configurations before making any changes using the WAAS CLI global configuration mode and you want to protect the current configuration from loss of data by erroneous operations.
The wafs restore-config automatically performs a reload function. We strongly recommend that you re-register your WAE on completion of this command.
This wafs command is also useful when backup and system restoration, or generation of a system report, are not available from the WAAS Central Manager GUI.
Examples
The following example creates a backup file of the WAFS configuration information:
WAE# wafs ?
backup-config backup system configurations to a file.
restore-config restore system configurations from a file. WARNING: After
restoring configuration, the system needs to be restarted and
re-registered.
sysreport system report to a file
WAE# wafs backup-config backup.tar.gz
system configuration is stored in file /local/local1/backup.tar.gz
The following example restores a system with previously saved WAAS configuration information:
WAE# wafs restore-config backup.tar.gz
Restoring configurations ...
After upload is completed the File Engine will be reloaded. We strongly recommend you
re-register after the engine is reloaded.
Related Commands
whoami
To display the username of the current user, use the whoami EXEC command.
whoami
Syntax Description
This command has no arguments or keywords.
Defaults
No default behavior or values
Command Modes
EXEC
Device Modes
application-accelerator
replication-accelerator
central-manager
Usage Guidelines
Use this EXEC command to display the username of the current user.
Examples
The following example displays your username:
WAE# whoami
admin
Related Commands
windows-domain
To access the Windows domain utilities on a WAAS device, use the windows-domain EXEC command.
windows-domain diagnostics {findsmb | getent | net | nmblookup | smbclient | smbstatus | smbtree | tdbbackup | tdbdump | testparm | wbinfo}
Syntax Description
Defaults
No default behavior or values
Command Modes
EXEC
Device Modes
application-accelerator
replication-accelerator
central-manager
Usage Guidelines
Use this command to activate the selected Windows domain diagnostic utility.
Examples
The following example shows the options available for the Get Entity utility:
WAE# windows-domain diagnostics getent --help
Usage: getent [OPTION...] database [key ...]
getent - get entries from administrative database.
-s, --service=CONFIG Service configuration to be used
-?, --help Give this help list
--usage Give a short usage message
-V, --version Print program version
Mandatory or optional arguments to long options are also mandatory or optional
for any corresponding short options.
Supported databases:
aliases ethers group hosts netgroup networks passwd protocols rpc
services shadow
The following example shows the options available for the NMB Lookup Utility for troubleshooting NetBIOS name resolution and browsing:
WAE# windows-domain diagnostics nmblookup -h
Usage: [-?TV] [--usage] [-B BROADCAST-ADDRESS] [-f VAL] [-U STRING] [-M VAL]
[-R VAL] [-S VAL] [-r VAL] [-A VAL] [-d DEBUGLEVEL] [-s CONFIGFILE]
[-l LOGFILEBASE] [-O SOCKETOPTIONS] [-n NETBIOSNAME] [-W WORKGROUP]
[-i SCOPE] <NODE> ...
The following example shows the options available for the Samba Client Utility for troubleshooting the Windows environment and integration:
WAE# windows-domain diagnostics smbclient -h
Usage: [-?EgVNkP] [--usage] [-R NAME-RESOLVE-ORDER] [-M HOST] [-I IP] [-L HOST]
[-t CODE] [-m LEVEL] [-T <c|x>IXFqgbNan] [-D DIR] [-c STRING] [-b BYTES]
[-p PORT] [-d DEBUGLEVEL] [-s CONFIGFILE] [-l LOGFILEBASE]
[-O SOCKETOPTIONS] [-n NETBIOSNAME] [-W WORKGROUP] [-i SCOPE]
[-U USERNAME] [-A FILE] [-S on|off|required] service <password>
The following example shows the options available for the TDB Backup Utility:
WAE# windows-domain diagnostics tdbbackup -h
Usage: tdbbackup [options] <fname...>
-h this help message
-s suffix set the backup suffix
-v verify mode (restore if corrupt)
The following example shows the use of the -u option of the WinBind Utility to view the information about a user registered in a Windows domain:
WAE# windows-domain diagnostics wbinfo -u
administrator
guest
user98
tuser1
WAE# show user username user98
Uid : 70012
Username : user98
Password : *****
Privilege : super user
Configured in : Windows Domain database
WAE# show user uid 70012
Uid : 70012
Username : user98
Password : *****
Privilege : super user
Configured in : Windows Domain database
The following example shows how to register a Windows domain:
WAE# windows-domain diagnostics
net join -S<domain server> -U<domain admin username>%<domain admin password>
Related Commands
write
To save startup configurations on a WAAS device, use the write EXEC command.
write [erase | memory | mib-data | terminal]
Syntax Description
Defaults
The configuration is written to NVRAM by default.
Command Modes
EXEC
Device Modes
application-accelerator
replication-accelerator
central-manager
Usage Guidelines
Use this command to either save running configurations to NVRAM or to erase memory configurations. Following a write erase command, no configuration is held in memory, and a prompt for configuration specifics occurs after you reboot the WAAS device.
Use the write terminal command to display the current running configuration in the terminal session window. The equivalent command is show running-config.
Examples
The following example saves the current startup configuration to memory:
WAE# write memory
 Feedback