Release 1.3: Cisco StadiumVision Mobile Reporter Administration Guide
Bias-Free Language
The documentation set for this product strives to use bias-free language. For the purposes of this documentation set, bias-free is defined as language that does not imply discrimination based on age, disability, gender, racial identity, ethnic identity, sexual orientation, socioeconomic status, and intersectionality. Exceptions may be present in the documentation due to language that is hardcoded in the user interfaces of the product software, language used based on RFP documentation, or language that is used by a referenced third-party product. Learn more about how Cisco is using Inclusive Language.
- Updated:
- October 30, 2013
Chapter: Using the Cisco StadiumVision Mobile Reporter Reporting Functionality
Using the Cisco StadiumVision Mobile Reporter Reporting Functionality
This module describes how to access and to generate various reports for both the admin and marketing user. This module contains the following sections:
•![]() Accessing the Cisco StadiumVision Mobile Reporter GUI
Accessing the Cisco StadiumVision Mobile Reporter GUI
User Roles
The Cisco StadiumVision Mobile Reporter has two user roles by default:
•![]() admin—provides access to the following reports and functions:
admin—provides access to the following reports and functions:
–![]() Data export to .csv files. detailed in Table 1
Data export to .csv files. detailed in Table 1
–![]() Upload Event Schedule
Upload Event Schedule
–![]() Upload Upgrade File
Upload Upgrade File
–![]() Disk Utilization
Disk Utilization
–![]() Current Viewers
Current Viewers
–![]() System State Report
System State Report
–![]() System Tools
System Tools
–![]() Event Scorecard
Event Scorecard
•![]() marketing—provides access to live and historical reports only:
marketing—provides access to live and historical reports only:
–![]() Event Scorecard
Event Scorecard
–![]() Peak Concurrent Video Viewers
Peak Concurrent Video Viewers
–![]() Unique Video Viewers
Unique Video Viewers
–![]() Total Video Viewing Time
Total Video Viewing Time
–![]() Client Demographic
Client Demographic
–![]() Concurrent Clients
Concurrent Clients
–![]() Concurrent WiFi Clients
Concurrent WiFi Clients
Log into the Cisco StadiumVision Mobile Reporter user interface using the credentials in .
|
|
|
|
|---|---|---|
Cisco StadiumVision Mobile Reporter |
http://reporter ip address |
• • |
How to Change System Account Passwords
To change the admin or marketing user account passwords, use the following procedure. You must have SNE TAC access to perform this task.
Step 1 ![]() Log on with an snetac account to access the command line prompt.
Log on with an snetac account to access the command line prompt.
Step 2 ![]() Execute the following command:
Execute the following command:
$ /var/svm/bin/svmcass
Column Family assumptions read from /home/x/.cassandra/assumptions.json
Connected to: "Test Cluster" on 127.0.0.1/9160
Welcome to Cassandra CLI version 1.1.6
Type 'help;' or '?' for help.
Type 'quit;' or 'exit;' to quit.
Step 3 ![]() Execute the following commands to change the marketing and admin user account passwords:
Execute the following commands to change the marketing and admin user account passwords:
[default@BDASchema] set Users['marketing']['Password']='myNewPassword';
Value inserted.
Elapsed time: 55 msec(s).
[default@BDASchema] set Users['admin']['Password']='adminNewPassword';
Value inserted.
Elapsed time: 2.97 msec(s).
Step 4 ![]() Exit the procedure.
Exit the procedure.
[default@BDASchema] exit;
Accessing the Cisco StadiumVision Mobile Reporter GUI
The Cisco StadiumVision Mobile Reporter GUI provides the following features:
•![]() A scorecard with quality and uptake scores—for both the season and a chosen event
A scorecard with quality and uptake scores—for both the season and a chosen event
•![]() Reports via data export for a chosen event
Reports via data export for a chosen event
•![]() Event schedule upload with downloadable templates
Event schedule upload with downloadable templates
•![]() ISO upgrade file upload
ISO upgrade file upload
•![]() Disk utilization report
Disk utilization report
•![]() Current viewers report
Current viewers report
•![]() System state report
System state report
Uploading Event Schedule Information
The event schedule is used by the Cisco StadiumVision Mobile Reporter to know when event data is to be collected and processed into predefined reports and charts. The Event and Season reports depend on the event schedule to define a time period for each event and for the sports season.
This schedule is used to present the charts. When an event transpires, the Live Event reports will begin to show data from the start of the event. At some point in time after an event is over (the next night), the charts in categories for Event Report and Season Report will be updated with the latest summary data from the most recent event.
To create an event schedule, use the included template (accessed via the Upload Event Schedule menu option when logged in as admin. Alternatively, navigate to the following path to download the event schedule spreadsheet template:
http://<stadiumvision mobile reporter ip address>:80/EventSchedule.xlsx
Note the following conditions regarding the event schedule spreadsheet:
•![]() A spreadsheet application such as Microsoft Excel should be used to populate the spreadsheet
A spreadsheet application such as Microsoft Excel should be used to populate the spreadsheet
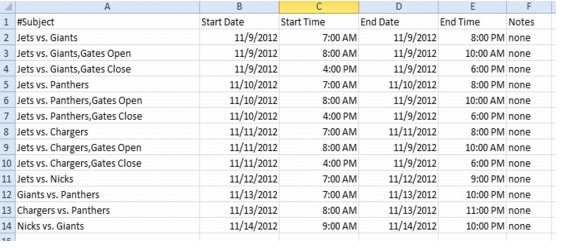
•![]() Spreadsheet should be saved as Unicode Text and a tab separated text file (a sample is shown in Figure 1)
Spreadsheet should be saved as Unicode Text and a tab separated text file (a sample is shown in Figure 1)
The Upload Event Schedule dialog box contains a Download Template button and an Upload button to upload the populated spreadsheet.
Figure 1 Event Schedule Spreadsheet Sample
To create and upload an event schedule, use the following procedure:
Step 1 ![]() Log into the Cisco StadiumVision Mobile Reporter as admin.
Log into the Cisco StadiumVision Mobile Reporter as admin.
Step 2 ![]() Click System Tools.
Click System Tools.
Step 3 ![]() Click Download Template.
Click Download Template.
Step 4 ![]() Populate the spreadsheet with the appropriate event data.
Populate the spreadsheet with the appropriate event data.
Step 5 ![]() Save the spreadsheet.
Save the spreadsheet.
Step 6 ![]() Click Choose File, and navigate to the schedule spreadsheet.
Click Choose File, and navigate to the schedule spreadsheet.
Step 7 ![]() Click Upload to load the event schedule.
Click Upload to load the event schedule.
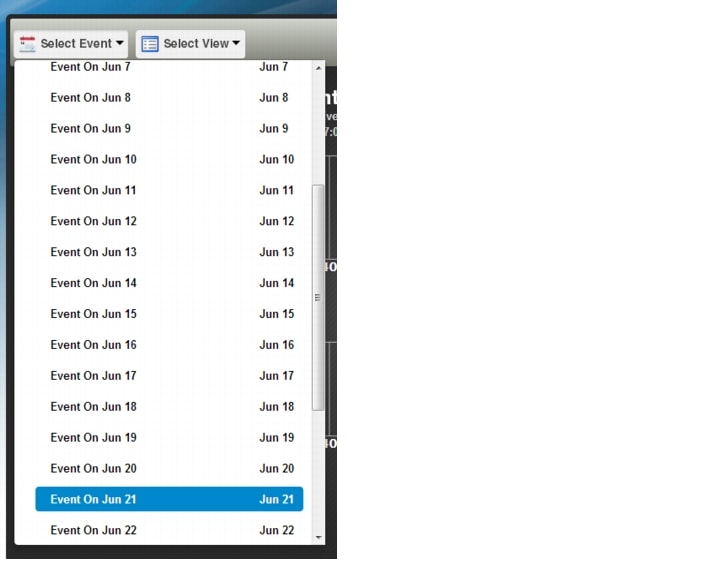
Step 8 ![]() Verify that the event schedule has been uploaded by logging into the Cisco StadiumVision Mobile Reporter as the marketing user, and click Select an Event. View the event schedule and verify that the uploaded schedule appears in the list as shown in Figure 9.
Verify that the event schedule has been uploaded by logging into the Cisco StadiumVision Mobile Reporter as the marketing user, and click Select an Event. View the event schedule and verify that the uploaded schedule appears in the list as shown in Figure 9.
Admin User Reports
There are two report categories avaialable to the admin user via the Select View drop-down menu:
•![]() The Event Scorecard—Contains a Quality and Uptake Score.
The Event Scorecard—Contains a Quality and Uptake Score.
•![]() Data Export—Starting in Cisco StadiumVision Mobile Reporter Release 1.3, additional reports are available for the administrator via CSV file export. The reports in Table 1 are available via the web browser user interface.
Data Export—Starting in Cisco StadiumVision Mobile Reporter Release 1.3, additional reports are available for the administrator via CSV file export. The reports in Table 1 are available via the web browser user interface.
Event Scorecard—Quality and Uptake Scores
The uptake score is a measure of the number of WiFi devices that are on a venue's WiFi network compared to how many of those devices are using the Cisco StadiumVision Mobile app. It is the percentage of devices using the SDK out of all the devices on the appropriate SSID in the wireless network.
Both the Quality Score and the Uptake Score will be a value between 0 and 100.
Data Export
Table 1 lists the admin user reports available via the Data Export menu option, as well as a description of the report and its corresponding download filename. Reports are exported from the Cisco StadiumVision Mobile Reporter as CSV (comma-separated values) files contained within a .zip file. The CSV file can be viewed in a spreadsheet application.
Data Export—Report Field Descriptions
This section provides detailed descriptions of the fields contained within each report.
Key Service Quality Fields
Table 2 lists the key fields for measuring Cisco StadiumVision Mobile service quality.
Performance Timeline
AP Performance
Modifying the AP Name Field Prefix
To modify the prefix that appears after the AP name, use the following procedure:
Step 1 ![]() Log on with an snetac account to access the command line prompt.
Log on with an snetac account to access the command line prompt.
Step 2 ![]() Go to /var/svm/config.
Go to /var/svm/config.
Step 3 ![]() Edit the variables.xml file.
Edit the variables.xml file.
At the bottom, you will find two lines.
The first contains "AP_AREA_REGEX". This line contains a regular expression to match the AP name. It contains regex 'grouping' operators which are parentheses. These parentheses mean 'take any characters inside the parentheses and assign it to a variable. The variable resulting starts with a $ and has a number, sequential based on reading the regex left to right.
The next line contains AP-AREA_REPLACEMENT. This uses those groupings found above.
Client Sessions
Unique Clients
Client Device Demographics
Client OS Demographics
Client App Versions
SDK Versions
Streamer Input Quality
Concurrent Clients
|
|
|
|---|---|
SVM Clients |
Number of Cisco StadiumVision Mobile clients. |
Concurrent Video Viewers
|
|
|
|---|---|
Time |
Time in 24 hour format. |
Channel Name |
Assigned channel name. |
Users |
Number of users. |
Reporter Server Statistics
Marketing User Reports
The marketing user has access to five report types (listed in Table 15). Each of these five reports has two distinct presentation views. One view is the event view, which presents data collected during the span of one specific event. The other view is the season view, which presents summarized data for all of this seasons events that have been completed so far.
The Reporter UI distinguishes between the event view for past events and the event view for a live event happening right now. This separation is mostly a navigational one, as the live and historical event views are almost identical.
Terminology
In order to maximize report comprehension, the following terminology should be noted.
1. ![]() A group of 20 clients (A) watch the in-house channel for the entire game.
A group of 20 clients (A) watch the in-house channel for the entire game.
2. ![]() A second group of 10 clients (B) watch the in-house channel for the first half. At half time they switch to ESPN. Finally, right before the start of the 2nd half all 10 clients are turned off.
A second group of 10 clients (B) watch the in-house channel for the first half. At half time they switch to ESPN. Finally, right before the start of the 2nd half all 10 clients are turned off.
3. ![]() A third group of 5 clients (C) show up during the second half, and watch ESPN for the remainder of the game.
A third group of 5 clients (C) show up during the second half, and watch ESPN for the remainder of the game.
As a result the event report shows 30 peak viewers for the in-house channel, and 10 peak viewers for ESPN. The season report shows 30 peak viewers for the event.
.
Unique Video Viewers
The event report shows the number of unique SVM clients that watched each of the available video channels during a specific event. A client is uniquely identified by its MAC address, and is only counted once per channel it viewed, even if it left a channel and resumed viewing it later. A client that watches multiple channels during the event is counted as one unique viewer for each of the channels it viewed.
The season report shows the total number of unique SVM clients that viewed video for each of the past events, regardless of channel watched. Hence each unique client is counted once per event only.
1. ![]() A group of 20 clients (A) watch the in-house channel for the entire game.
A group of 20 clients (A) watch the in-house channel for the entire game.
2. ![]() A second group of 10 clients (B) watch the in-house channel for the first half. At half time they switch to ESPN. And right before the start of the 2nd half all 10 clients are turned off.
A second group of 10 clients (B) watch the in-house channel for the first half. At half time they switch to ESPN. And right before the start of the 2nd half all 10 clients are turned off.
3. ![]() A third group of 5 clients (C) show up during the second half, and watch ESPN for the remainder of the game.
A third group of 5 clients (C) show up during the second half, and watch ESPN for the remainder of the game.
As a result the event report shows 30 unique viewers for the in-house channel, and 15 unique viewers for ESPN. The season report shows 35 unique viewers for the event.
Video Viewing Time
The event report shows the total duration that each channel was viewed during a specific event. This is calculated by summing up the number of minutes watched by each of the clients that tuned to this channel. It makes no difference if a client watched a channel once for 30 minutes or twice for 15 minutes.
The season report shows the total number of minutes of video viewed across all channels, broken down by event. This aggregate number is a simple summation of the minutes recorded for each individual channel for that event.
1. ![]() A group of 20 clients (A) watch the in-house channel for 10 minutes each.
A group of 20 clients (A) watch the in-house channel for 10 minutes each.
2. ![]() A second group of 10 clients (B) watch the in-house channel for 20 minutes each. The same clients also watch ESPN for 10 minutes each.
A second group of 10 clients (B) watch the in-house channel for 20 minutes each. The same clients also watch ESPN for 10 minutes each.
As a result the event report shows the in-house channel being watched for 400 minutes, and the ESPN channel being watched for 100 minutes. The season report shows that a total of 500 minutes was watched during this event.
SVM Client Demographic
The event report shows the total number of unique Google Android and Apple iOS clients that used the SVM client app at some point during the event. This includes devices that never tuned to a channel to watch video. The fact that the SVM client was launched, and briefly ran in the foreground, is sufficient for that client to be recorded. Hence the client demographic count is likely to be higher than that shown for the same event on the 'Unique Video Viewers' season.
1. ![]() A group of 20 Apple iOS clients (A) watch the in-house channel during the first half.
A group of 20 Apple iOS clients (A) watch the in-house channel during the first half.
2. ![]() A group of 15 Google Android clients (B) watch the in-house channel during the second half.
A group of 15 Google Android clients (B) watch the in-house channel during the second half.
3. ![]() A group of 10 Apple iOS clients (C) use the SVM enabled app for in seat ordering only. They never tune to any of the video channels.
A group of 10 Apple iOS clients (C) use the SVM enabled app for in seat ordering only. They never tune to any of the video channels.
4. ![]() A group of 5 Google Android clients (D) use the SVM enabled app for way finding only. They never tune to any of the video channels.
A group of 5 Google Android clients (D) use the SVM enabled app for way finding only. They never tune to any of the video channels.
As a result the event report shows 30 unique Apple iOS clients and 20 unique Google Android clients. The season report also shows 30 Apple iOS and 20 Google Android clients for this event.
Concurrent SVM Clients
The event report shows the number of SVM clients that were active at the same time (concurrent) over the course of the event. This includes clients that are not tuned to a video channel. The fact that the SVM client is launched, and running in the foreground, is sufficient for that client to be recorded. Hence the concurrent SVM client count reported here is likely to be higher than that shown for the same event on the 'Peak Video Viewers' season report.
1. ![]() A group of 20 clients (A) were watching the in-house channel at 5:13 PM.
A group of 20 clients (A) were watching the in-house channel at 5:13 PM.
2. ![]() A group of 10 clients (B) were using the SVM enabled app for in seat ordering at 5:13 PM. Hence it is a given that they were not also watching video at that time.
A group of 10 clients (B) were using the SVM enabled app for in seat ordering at 5:13 PM. Hence it is a given that they were not also watching video at that time.
3. ![]() The time of peak SVM activity is at 6:03 PM, when there are a total of 100 concurrently active SVM clients, including groups A and B.
The time of peak SVM activity is at 6:03 PM, when there are a total of 100 concurrently active SVM clients, including groups A and B.
As a result the event report shows 30 active clients at 5:13 PM. The season report captures the peak value of the event chart, which in this case is 100 concurrent clients.
Maintenance Window
Reports for an event begin generation at 3:00 a.m. by default. If an event occurs at 10:00 p.m., the reports will be available after the 3:00 a.m. generation cycle.

Note ![]() The Cisco StadiumVision Mobile Reporter performs maintenance from 3:00 a.m. to 6:00 a.m. Do not schedule events to run during the maintenance window.
The Cisco StadiumVision Mobile Reporter performs maintenance from 3:00 a.m. to 6:00 a.m. Do not schedule events to run during the maintenance window.
Marketing Reports Navigation and Showing Detail
Figure 2 depicts the navigation path for the various reports on the Cisco StadiumVision Mobile Reporter. Reports are organized into three categories: Live Reports, Historical Reports, and the Season Reports.
•![]() Live Reports—Real-Time reports
Live Reports—Real-Time reports
•![]() Event Reports—Reports for a specific event
Event Reports—Reports for a specific event
•![]() Season Reports—Cumulative reports over a span of time
Season Reports—Cumulative reports over a span of time
Figure 2 Marketing Reports Navigation
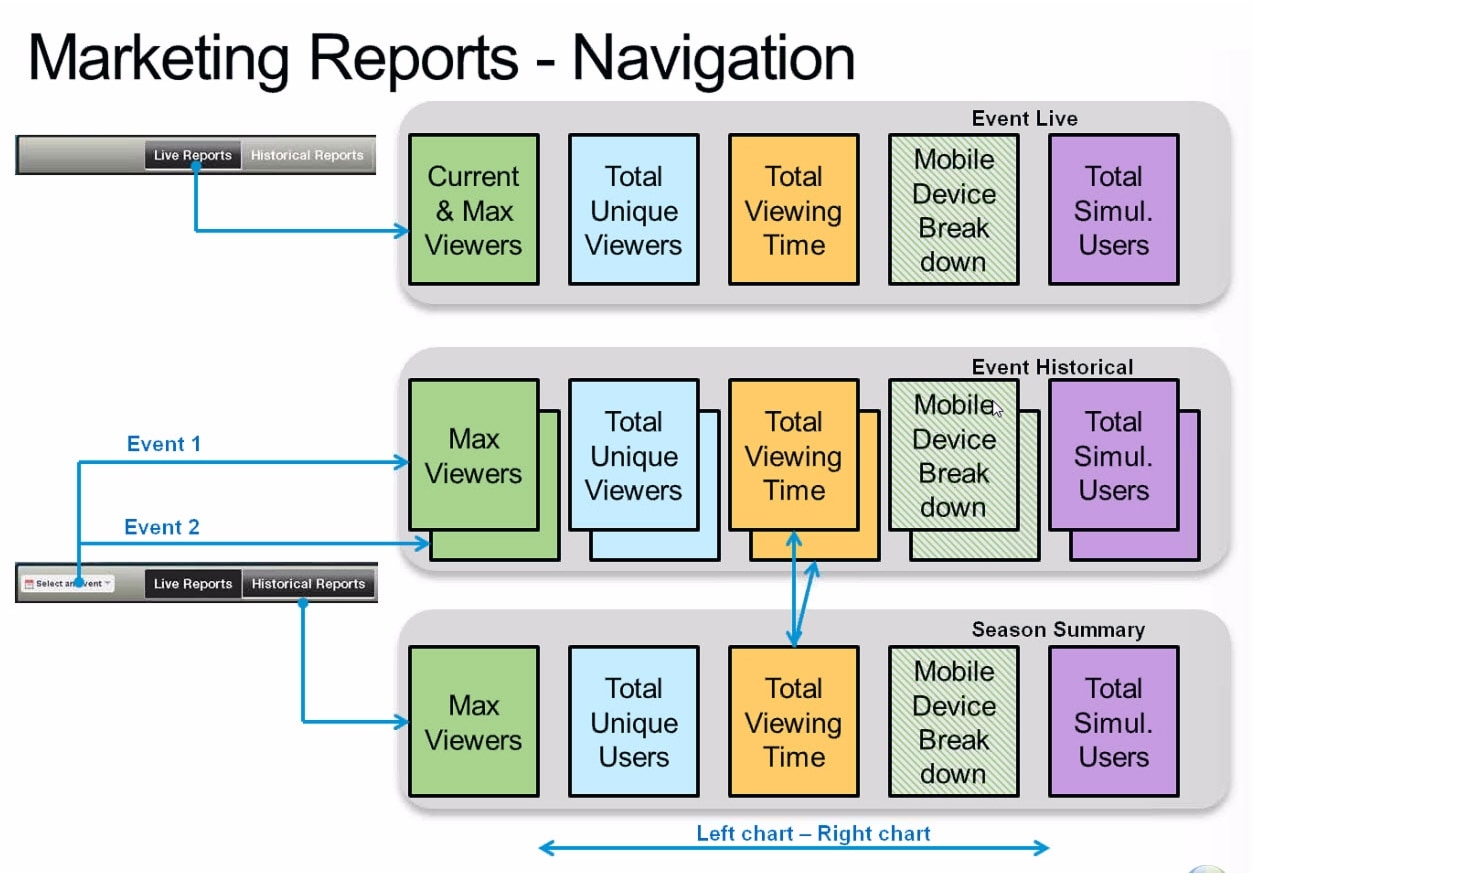
Figure 3 displays a sample Event Scorecard report, showing the right and left navigation arrows to scroll through the reports. as well as the Live Report and Historical Report buttons to select a report type. The Select an Event drop-down menu shown in Figure 3.
Samples of all marketing reports follow:
•![]() Peak Concurrent Video Viewers Report
Peak Concurrent Video Viewers Report
Figure 3 Event Scorecard Report
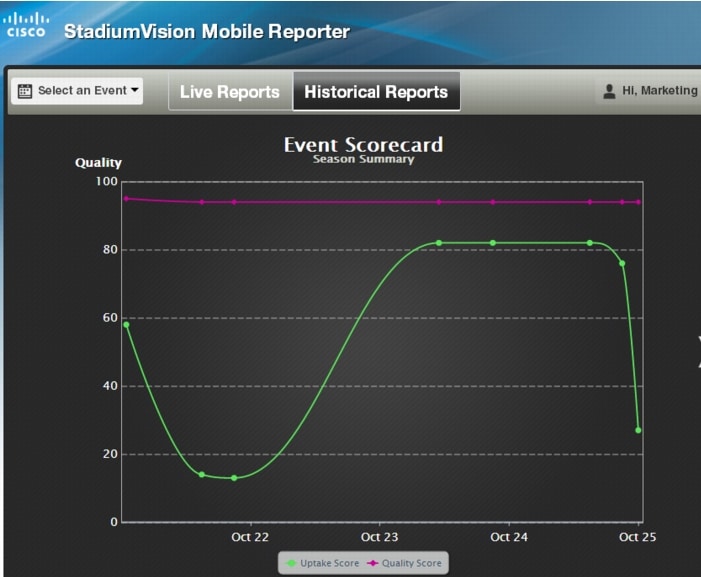
Figure 4 Peak Concurrent Video Viewers Report
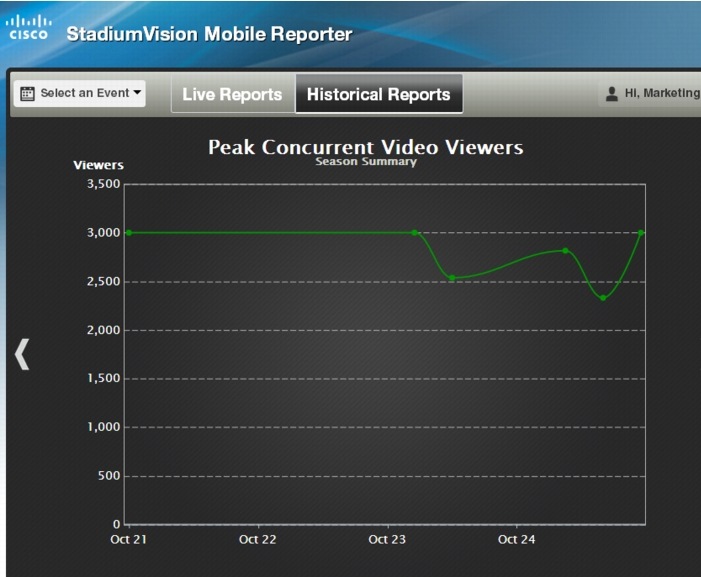
Figure 5 Unique Video Viewers Report
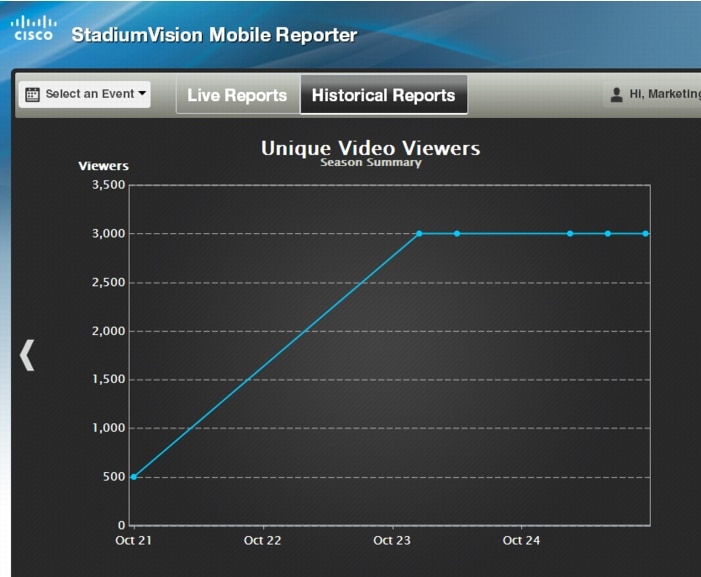
Figure 6 Client Demographic Report
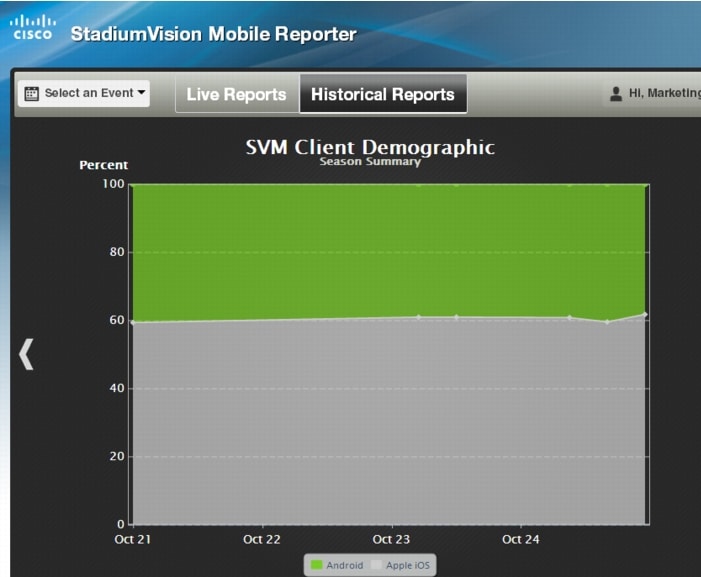
Figure 7 Concurrent Clients Report
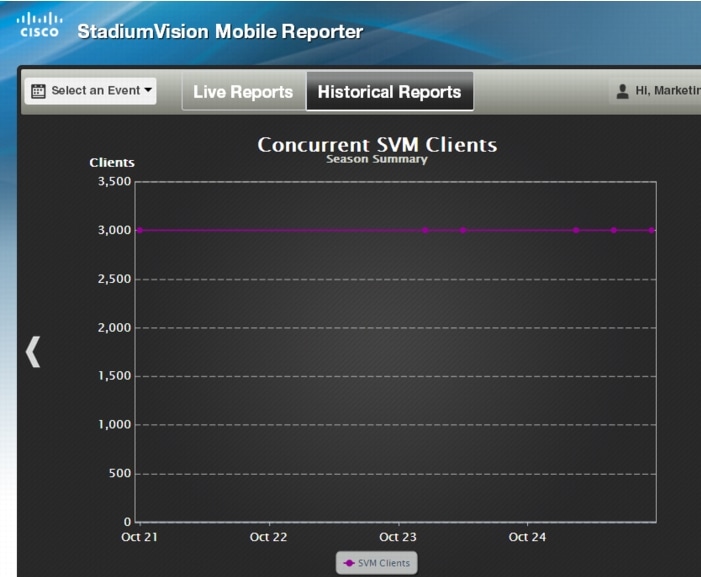
Figure 8 Total Video Viewing Time
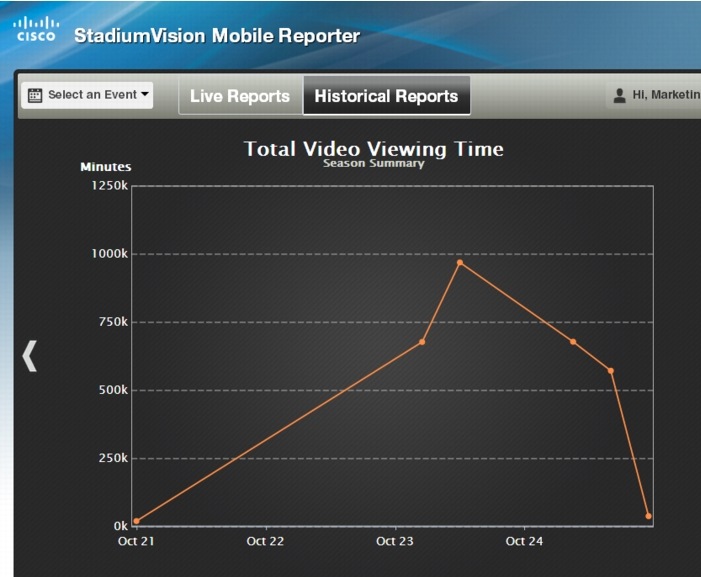
Figure 9 Choosing an Event
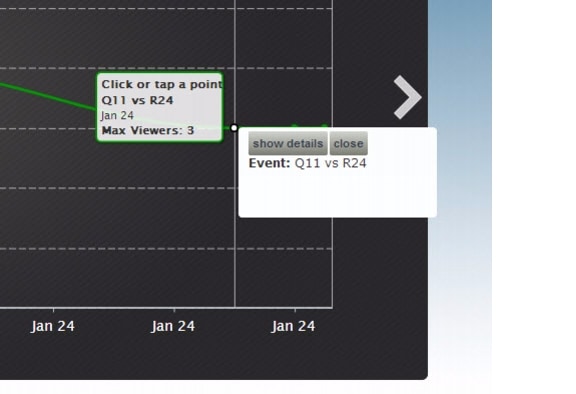
Several reports offer additional details for an event by clicking on the data point in the chart, and clicking show details, as shown in Figure 10.
Figure 10 Sample Report Time Point Detail
 Feedback