Release 1.2: Cisco StadiumVision Mobile Reporter Administration Guide
Bias-Free Language
The documentation set for this product strives to use bias-free language. For the purposes of this documentation set, bias-free is defined as language that does not imply discrimination based on age, disability, gender, racial identity, ethnic identity, sexual orientation, socioeconomic status, and intersectionality. Exceptions may be present in the documentation due to language that is hardcoded in the user interfaces of the product software, language used based on RFP documentation, or language that is used by a referenced third-party product. Learn more about how Cisco is using Inclusive Language.
- Updated:
- March 28, 2013
Chapter: Using the Cisco StadiumVision Mobile Reporter Reporting Functionality
Using the Cisco StadiumVision Mobile Reporter Reporting Functionality
This section contains the following sections:
•![]() Accessing the StadiumVision Mobile Reporter GUI
Accessing the StadiumVision Mobile Reporter GUI
•![]() Uploading Event Schedule Information
Uploading Event Schedule Information
–![]() Marketing Reports Navigation and Showing Detail
Marketing Reports Navigation and Showing Detail
Accessing the StadiumVision Mobile Reporter GUI
The StadiumVision Mobile Reporter GUI provides access to the various marketing reports. To access the StadiumVision Mobile Reporter GUI, use a web browser to navigate to the IP address specified during the StadiumVision Mobile Reporter installation.
•![]() Log into the StadiumVision Mobile Reporter as administrator with the following admin role credentials:
Log into the StadiumVision Mobile Reporter as administrator with the following admin role credentials:
username = admin
password = cisco!123
•![]() Log into the StadiumVision Mobile Reporter
Log into the StadiumVision Mobile Reporter

Note ![]() It is recommended to change the default password.
It is recommended to change the default password.
Figure 1 StadiumVision Mobile Reporter Login

Uploading Event Schedule Information
The event schedule is used by the StadiumVision Mobile Reporter to know when event data is to be collected and processed into predefined reports and charts. The Event and Season reports depend on the the event schedule to define a time period for each event and for the sports season.
This schedule is used to present the charts. When an event transpires, the Live Event reports will begin to show data from the start of the event. At some point in time after an event is over (the next night), the charts in categories for Event Report and Season Report will be updated with the latest summary data from the most recent event.
To create an event schedule, use the included template (accessed via the Event Upload button shown in Figure 2) when logged in as admin. Alternatively, navigate to the following path to download the event schedule spreadsheet template:
http://<stadiumvision mobile reporter ip address>:80/EventSchedule.xlsx
Note the following conditions regarding the event schedule spreadsheet:
•![]() A spreadsheet application such as Microsoft Excel should be used to populate the spreadsheet
A spreadsheet application such as Microsoft Excel should be used to populate the spreadsheet
•![]() Event times must be at the start of the hour (for example, 4:00)
Event times must be at the start of the hour (for example, 4:00)
•![]() Spreadsheet should be saved as Unicode Text or as a tab separated text file (a sample is shown in Figure 3)
Spreadsheet should be saved as Unicode Text or as a tab separated text file (a sample is shown in Figure 3)
Figure 4 shows the Event Upload dialog box used to download a template and to upload the populated spreadsheet.
Figure 2 StadiumVision Reporter Event Upload Button

Figure 3 Event Schedule Spreadsheet Sample

Figure 4 StadiumVision Mobile Reporter Event Upload Dialog Box

To create and upload an event schedule, use the following procedure:
Step 1 ![]() Log into the StadiumVision Mobile Reporter as admin.
Log into the StadiumVision Mobile Reporter as admin.
Step 2 ![]() Click on the Event Upload button.
Click on the Event Upload button.
Step 3 ![]() Click on the Download Template button.
Click on the Download Template button.
Step 4 ![]() Populate the spreadsheet with the appropriate event data, remembering that events must begin and end at the start of the hour (for example, 4:00 PM).
Populate the spreadsheet with the appropriate event data, remembering that events must begin and end at the start of the hour (for example, 4:00 PM).
Step 5 ![]() Save the spreadsheet.
Save the spreadsheet.
Step 6 ![]() Click on the Upload button to load the event schedule.
Click on the Upload button to load the event schedule.
Step 7 ![]() Verify that the event schedule has been uploaded by logging into the StadiumVision Mobile Reporter as the marketing user, and click on the Select an Event button. View the event schedule and verify that the uploaded schedule appears in the list as shown in Figure 7.
Verify that the event schedule has been uploaded by logging into the StadiumVision Mobile Reporter as the marketing user, and click on the Select an Event button. View the event schedule and verify that the uploaded schedule appears in the list as shown in Figure 7.
Marketing Reports
When logged in as the marketing user, the reports in Table 1 are available via the web browser user interface.
.
Introduction to Marketing Reports on the Cisco StadiumVision Mobile Reporter
The marketing user has access to 5 report types. Each of these 5 reports has two distinct presentation views. One view is the event view, which presents data collected during the span of one specific event. The other view is the season view, which presents summarized data for all of this seasons events that have been completed so far.
The Reporter UI distinguishes between the event view for past events and the event view for a live event happening right now. This separation is mostly a navigational one, as the live and historical event views are almost identical.
Important Terminology
In order to maximize report comprehension, the following terminology should be noted.
1. ![]() A group of 20 clients (A) watch the in-house channel for the entire game.
A group of 20 clients (A) watch the in-house channel for the entire game.
2. ![]() A second group of 10 clients (B) watch the in-house channel for the first half. At half time they switch to ESPN. Finally, right before the start of the 2nd half all 10 clients are turned off.
A second group of 10 clients (B) watch the in-house channel for the first half. At half time they switch to ESPN. Finally, right before the start of the 2nd half all 10 clients are turned off.
3. ![]() A third group of 5 clients (C) show up during the second half, and watch ESPN for the remainder of the game.
A third group of 5 clients (C) show up during the second half, and watch ESPN for the remainder of the game.
As a result the event report shows 30 peak viewers for the in-house channel, and 10 peak viewers for ESPN. The season report shows 30 peak viewers for the event.
Unique Video Viewers
The event report shows the number of unique SVM clients that watched each of the available video channels during a specific event. A client is uniquely identified by its MAC address, and is only counted once per channel it viewed, even if it left a channel and resumed viewing it later. A client that watches multiple channels during the event is counted as one unique viewer for each of the channels it viewed.
The season report shows the total number of unique SVM clients that viewed video for each of the past events, regardless of channel watched. Hence each unique client is counted once per event only.
1. ![]() A group of 20 clients (A) watch the in-house channel for the entire game.
A group of 20 clients (A) watch the in-house channel for the entire game.
2. ![]() A second group of 10 clients (B) watch the in-house channel for the first half. At half time they switch to ESPN. And right before the start of the 2nd half all 10 clients are turned off.
A second group of 10 clients (B) watch the in-house channel for the first half. At half time they switch to ESPN. And right before the start of the 2nd half all 10 clients are turned off.
3. ![]() A third group of 5 clients (C) show up during the second half, and watch ESPN for the remainder of the game.
A third group of 5 clients (C) show up during the second half, and watch ESPN for the remainder of the game.
As a result the event report shows 30 unique viewers for the in-house channel, and 15 unique viewers for ESPN. The season report shows 35 unique viewers for the event.
Video Viewing Time
The event report shows the total duration that each channel was viewed during a specific event. This is calculated by summing up the number of minutes watched by each of the clients that tuned to this channel. It makes no difference if a client watched a channel once for 30 minutes or twice for 15 minutes.
The season report shows the total number of minutes of video viewed across all channels, broken down by event. This aggregate number is a simple summation of the minutes recorded for each individual channel for that event.
1. ![]() A group of 20 clients (A) watch the in-house channel for 10 minutes each.
A group of 20 clients (A) watch the in-house channel for 10 minutes each.
2. ![]() A second group of 10 clients (B) watch the in-house channel for 20 minutes each. The same clients also watch ESPN for 10 minutes each.
A second group of 10 clients (B) watch the in-house channel for 20 minutes each. The same clients also watch ESPN for 10 minutes each.
As a result the event report shows the in-house channel being watched for 400 minutes, and the ESPN channel being watched for 100 minutes. The season report shows that a total of 500 minutes was watched during this event.
SVM Client Demographic
The event report shows the total number of unique Android and iOS clients that used the SVM client app at some point during the event. This includes devices that never tuned to a channel to watch video. The fact that the SVM client was launched, and briefly ran in the foreground, is sufficient for that client to be recorded. Hence the client demographic count is likely to be higher than that shown for the same event on the 'Unique Video Viewers' season.
1. ![]() A group of 20 Apple iOS clients (A) watch the in-house channel during the first half.
A group of 20 Apple iOS clients (A) watch the in-house channel during the first half.
2. ![]() A group of 15 Android clients (B) watch the in-house channel during the second half.
A group of 15 Android clients (B) watch the in-house channel during the second half.
3. ![]() A group of 10 Apple iOS clients (C) use the SVM enabled app for in seat ordering only. They never tune to any of the video channels.
A group of 10 Apple iOS clients (C) use the SVM enabled app for in seat ordering only. They never tune to any of the video channels.
4. ![]() A group of 5 Android clients (D) use the SVM enabled app for way finding only. They never tune to any of the video channels.
A group of 5 Android clients (D) use the SVM enabled app for way finding only. They never tune to any of the video channels.
As a result the event report shows 30 unique Apple iOS clients and 20 unique Android clients. The season report also shows 30 iOS and 20 Android clients for this event.
Concurrent SVM Clients
The event report shows the number of SVM clients that were active at the same (concurrent) over the course of the event. This includes clients that are not tuned to a video channel. The fact that the SVM client is launched, and running in the foreground, is sufficient for that client to be recorded. Hence the concurrent SVM client count reported here is likely to be higher than that shown for the same event on the 'Peak Video Viewers' season report.
1. ![]() A group of 20 clients (A) were watching the in-house channel at 5:13 PM.
A group of 20 clients (A) were watching the in-house channel at 5:13 PM.
2. ![]() A group of 10 clients (B) were using the SVM enabled app for in seat ordering at 5:13 PM. Hence it is a given that they were not also watching video at that time.
A group of 10 clients (B) were using the SVM enabled app for in seat ordering at 5:13 PM. Hence it is a given that they were not also watching video at that time.
3. ![]() The time of peak SVM activity is at 6:03 PM, when there are a total of 100 concurrently active SVM clients, including groups A and B.
The time of peak SVM activity is at 6:03 PM, when there are a total of 100 concurrently active SVM clients, including groups A and B.
As a result the event report shows 30 active clients at 5:13 PM. The season report captures the peak value of the event chart, which in this case is 100 concurrent clients.
Maintenance Window
Reports for an event begin generation at 3:00 a.m. by default. If an event occurs at 10:00 p.m., the reports will be available after the 3:00 a.m. generation cycle.
Note ![]() The StadiumVision Mobile Reporter performs maintenance from 3:00 a.m. to 6:00 a.m. Do not schedule events to run during the maintenance window.
The StadiumVision Mobile Reporter performs maintenance from 3:00 a.m. to 6:00 a.m. Do not schedule events to run during the maintenance window.
Marketing Reports Navigation and Showing Detail
Figure 5 depicts the navigation path for the various reports on the StadiumVision Mobile Reporter. Reports are organized into three categories: Live Reports, Historical Reports, and the Season Reports.
•![]() Live Reports—provide real-time reports
Live Reports—provide real-time reports
•![]() Event Reports—provide reports for a specific event
Event Reports—provide reports for a specific event
•![]() Season Reports—provide cumulative reports over a span of time
Season Reports—provide cumulative reports over a span of time
Figure 6 displays a sample report, showing the right and left navigation arrows to scroll through the reports. as well as the Live Report and Historical Report buttons to select a report type. The Select an Event drop-down menu shown in Figure 7.
Several reports offer additional details for an event by clicking on the data point in the chart, and clicking on the show details button, as shown in Figure 8.
Figure 5 Marketing Reports Navigation
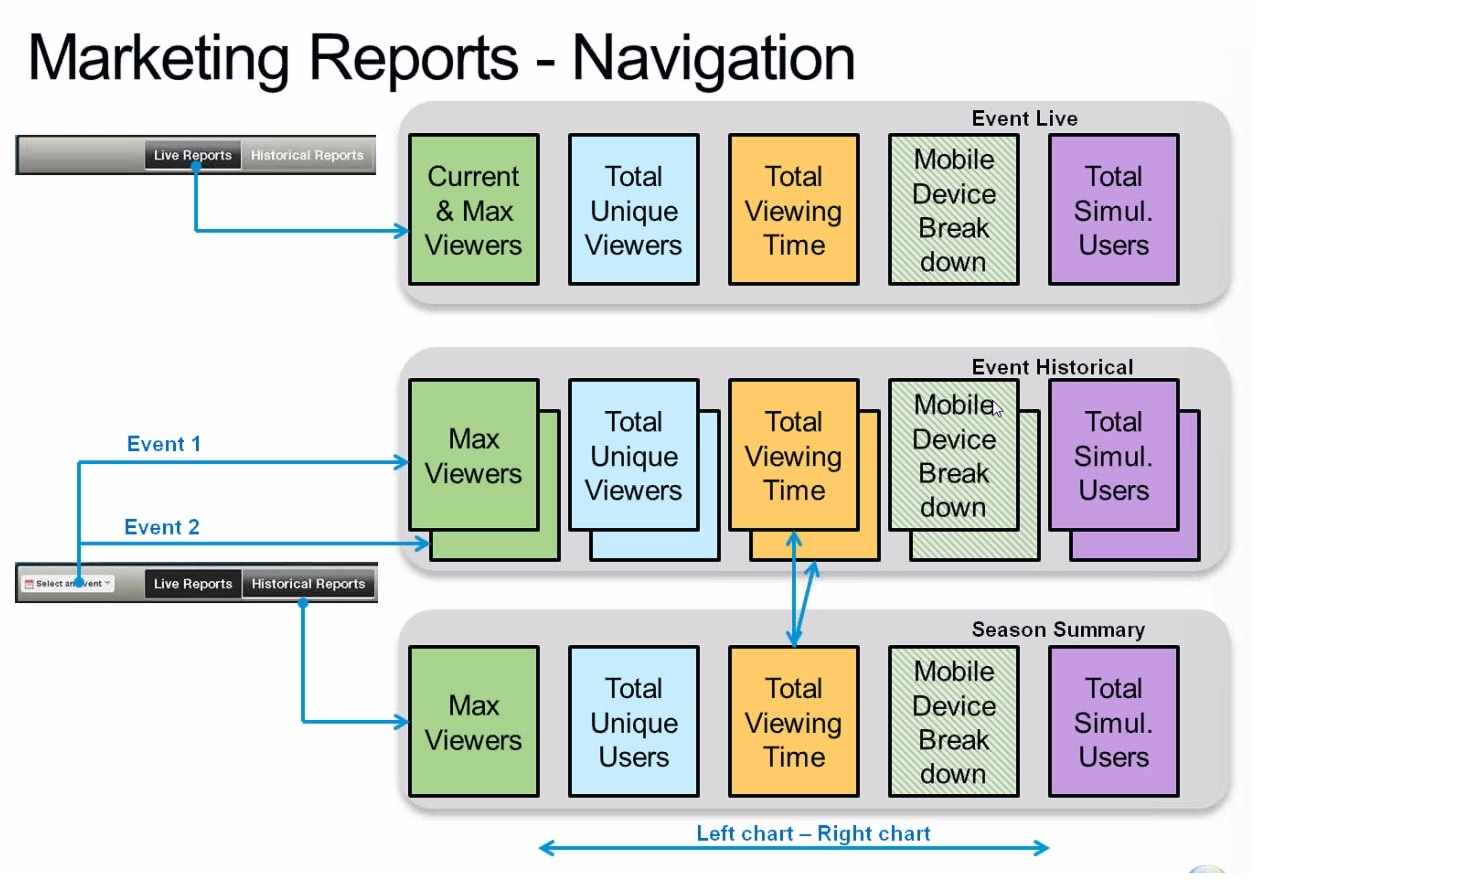
Figure 6 Choosing a Report Type

Figure 7 Choosing an Event

Figure 8 Sample Report Time Point Detail

 Feedback