
New and Changed Information
The following table provides an overview of the significant changes up to this current release. The table does not provide an exhaustive list of all changes or of the new features up to this release.
| Release Version | Feature | Description |
|---|---|---|
|
NDFC release 12.2.1 |
Allow expansion of network elements in topology |
With this feature, when you click on a switch or a zone with host and storage devices, you can view the interface nodes connected to that host, storage, or switch. You can toggle a Show Interfaces option from the View drop-down list that allows you to view the connected interfaces. For more information, see the Show Interfaces Option. |
|
NDFC release 12.2.1 |
Navigate to specific pages from the top dashlets on the Overview dashboard |
With this feature, you can navigate to specific pages after clicking a row in the TOP dashlets from the Overview dashboard page. For more information, see Dashboard Overview. |
|
NDFC release 12.2.1 |
Add grouping to topology |
With this feature, you can single-click on a VSAN on the SAN Controller > Topology page to display the VSANs slide-in pane. You can filter based on VSAN attributes or based on search criteria. If you click on a VSAN in the slide-in pane, you can see the grouping of hosts, switches, and storage devices connected to the VSAN in the fabric topology. Click on the Status column to view a tooltip displaying the connected switch. Click on a VSAN name to view the number of zones connected to the VSAN. Click a zone name to view the connected host and storage devices for the zone. For more information, see Viewing Elements in SAN Topology. |
|
NDFC release 12.2.1 |
Custom time range and real-time options available for performance data |
Beginning with NDFC release 12.2.1, you can filter performance data that is shown using new Real time and Custom options. For more information, see Dashboard Overview. |
Overview
The following topics give overview information on the Nexus Dashboard Fabric Controller.
Know your Web UI
When you launch the Cisco Nexus Dashboard Fabric Controller Web UI for the first time, the Feature Management page opens. After you choose a deployment type, the left pane displays menus relevant to the personality.
The top pane displays the following UI elements:
-
Home icon - Click to view One view on the Nexus Dashboard setup.
-
Nexus Dashboard - Click to view One view on the Nexus Dashboard setup.
-
Help - Click on Help to see a drop-down list with the following options:
-
About Nexus Dashboard - Displays the version of the Cisco Nexus Dashboard on which Cisco Nexus Dashboard Fabric Controller is deployed.
-
Welcome Screen - Displays What’s New information. You can choose to see this page every time you launch the Web UI.
-
Help Center - Click to view the Help Center page. You can access various product documents from this page.
Scroll to the end of the page to view the services installed on Nexus Dashboard. Click on the service to view the Help Center.
-
-
User Role - Displays the role of the user who is currently logged in, for example, admin. Click on the username to see a drop-down list with the following options:
-
User Preferences - Allows you to view the Welcome page on every login.
-
Change Password - Allows you to change the password for the current logged-in user.
If you are a network administrator user, you can modify the passwords of other users.
-
Logout - Allows you to terminate the Web UI and return to the login screen.
-
-
Cisco Nexus Dashboard Fabric Controller Persona - Specifies the deployment persona - Fabric Controller or SAN Controller or Fabric discovery.
-
View Alarms - Click the bell icon to view the Alarms. You can also view this page from Analyze > Event Analytics > Alarms from the left pane.
-
Help icon - Click to view help pages or information about Cisco NDFC.
-
Select Help to view the context-sensitive help for the UI page.
-
Select About NDFC to view the version number and copyright information.
-
General icons on UI:
-
Hamburger icon - Click on the Hamburger icon adjacent to the product name on the home screen to minimize the menu items on the home screen or to view menu items in detail.
-
Refresh icon - Click the refresh icon to refresh and reload the page.
Dashboard
The intent of the Dashboard is to enable network and storage administrators to focus on particular areas of concern around the health and performance of data center switching. This information is provided as 24-hour snapshots.
The functional view of SAN Controller Dashboard consists of several dynamic dashlets that display information in the context of the selected scope by default.
The various scopes that are available on the Cisco Nexus Dashboard Fabric Controller Web UI are described in the following topics.
Dashboard Overview
Navigate to the Fabric Controller > Overview page.
The Overview dashboard displays the SAN Insights tab if you have enabled the SAN Insights feature using Admin > System Settings > Feature Management. The SAN Insights tab provides a set of health-related dashlets that let you monitor your fabrics and switches.
The Overview tab displays several dashlets that help you monitor the health of your network.
The following dashlets appear on the Overview tab:
|
Dashlet |
Description |
|
Fabrics Health |
Displays details of fabrics such as the name, the state, and the health status of the fabric.
|
|
Event Analytics |
Displays alarms and events with a Critical, Major, Minor, or Warning severity. Click the severity level to view more information about the severity of events and alarms on the Event Analytics page. |
|
Links |
Displays a diagram of Inter-Switch Link (ISL) and N Port virtualization (NPV) links for transmitting and receiving information in the data center. Click the sectors on the pie chart to view more information on the SAN Links page. |
|
Switches |
Switch Health Displays the switch’s health status in the form of a chart with colors and health-condition names with the total number of switches in the pie charts. The colors and what they indicate are described in the following list:
Switch Status Displays the status of the switch. Switch Release Versions Displays the switch release versions. Switch Models Displays the models of switches. Click the sectors on the pie chart, the severity, status, versions, or the models to view more information in the Switches page. |
|
Modules |
Displays the switches on which the modules are discovered, the model names, and the count. |
|
Performance Collector |
Displays the performance collection information.
|
|
Port Usage |
Displays the port-inventory summary information. |
|
Top Congested Devices |
Displays data for the top congested end devices. Each entry shows the switch interface to which the end device is connected to, the name of the switch the device is connected to, and the average Tx-wait duration in a percentage for which a switch port could not transmit a frame due to slow drain. You can navigate directly to the Fabric Overview > Congestion Analysis tab by clicking a row in the Top Congested Devices dashlet. The Congested Analysis table displays data based on filters for Switch Name and Interface Name. |
|
TOP Congested ISLs |
Displays data for the top congested Inter-Switch Links (ISLs). Each entry shows the name of the ISL interface, the name of the switch the ISL port is connected to, the average Tx and Rx link utilization, and the average Tx-wait duration as a percentage. You can navigate directly to the Fabric Overview > Congestion Analysis tab by clicking a row in the Top Congested ISLs dashlet. The Congested Analysis table displays data based on filters for Switch Name and Interface Name. |
|
TOP ISL |
Displays data for the top ten performing ISLs. Each entry shows the device name, specifies the average of Rx traffic and Tx traffic as a percentage. Click the chart icon next to the device name, in the Name column, to view more details. You can navigate directly to the Manage > Inventory > Links tab by clicking a row in the Top ISL dashlet. The Links table displays data based on a filter for device name. |
|
TOP SAN End Ports |
Displays the performance data for the top ten performing SAN host and storage ports. Each entry shows the current receive and transmit percentage, with a graph depicting the percentage of time each trunk spent exceeding the currently configured threshold. Click the chart icon next to the device alias to view more details. You can navigate directly to the Manage > Inventory > Devices tab by clicking a row in the Top SAN End Ports dashlet. The Devices table displays data based on a filter for Device Alias. Beginning with NDFC release 12.2.1, you can also filter the performance data that is shown using the following options:
|
|
TOP FICON End Ports |
Displays data for the top 10 performing fiber connectivity (FICON) host and control unit ports. Each entry shows port traffic for the switch interface, specifies the device to which the FICON port is connected, specifies the average of Rx traffic and Tx traffic, and the exceeded percentage value. Click the chart icon next to the switch interface to view more details. You can navigate directly to the Manage > Inventory > Interfaces > FC Ports tab and the FICON subtab by clicking a row in the TOP FICON End Ports dashlet. The FICON table displays data based on a filter for Switch Interface. |
|
TOP FCIP ISL |
Displays data for the top ten performing Fibre Channel over IP (FCIP) ISLs. Each entry shows the device name, specifies the average of Rx traffic and Tx traffic, and the exceeded percentage value. Click the chart icon to view more details. You can navigate directly to the Manage > Inventory > Links > ISLs tab by clicking a row in the TOP FCIP ISL dashlet. The ISL table rows display data based on a filter for device name. |
|
TOP Optics |
Displays data for the top ten optics. You can sort optics by hottest Shortest Path First (SPFs), coldest SPFs, lower Rx power, and lowest Tx Power. Click the chart icon next to the switch interfaces to view more details. You can navigate directly to the Manage > Inventory > Interfaces > Optics tab by clicking a row in the TOP Optics dashlet. The Optics table rows display data based on filters for Switch Name and Interface Name. |
|
TOP CPU |
Displays data for the top CPU usage per switch. Click the chart icon next to the switch name to view more details. |
|
Top Temperature |
Displays data for the top temperature per switch module. Click the chart icon next to the switch name to view more details. |
|
TOP Power |
Displays data for the top power usage per switch module. Click the chart icon next to the switch module to view the power usage. |
|
TOP Error And Discard |
Displays the top error packets that are discarded for the selected interface. |
Viewing CPU & Memory and Disk I/O Charts
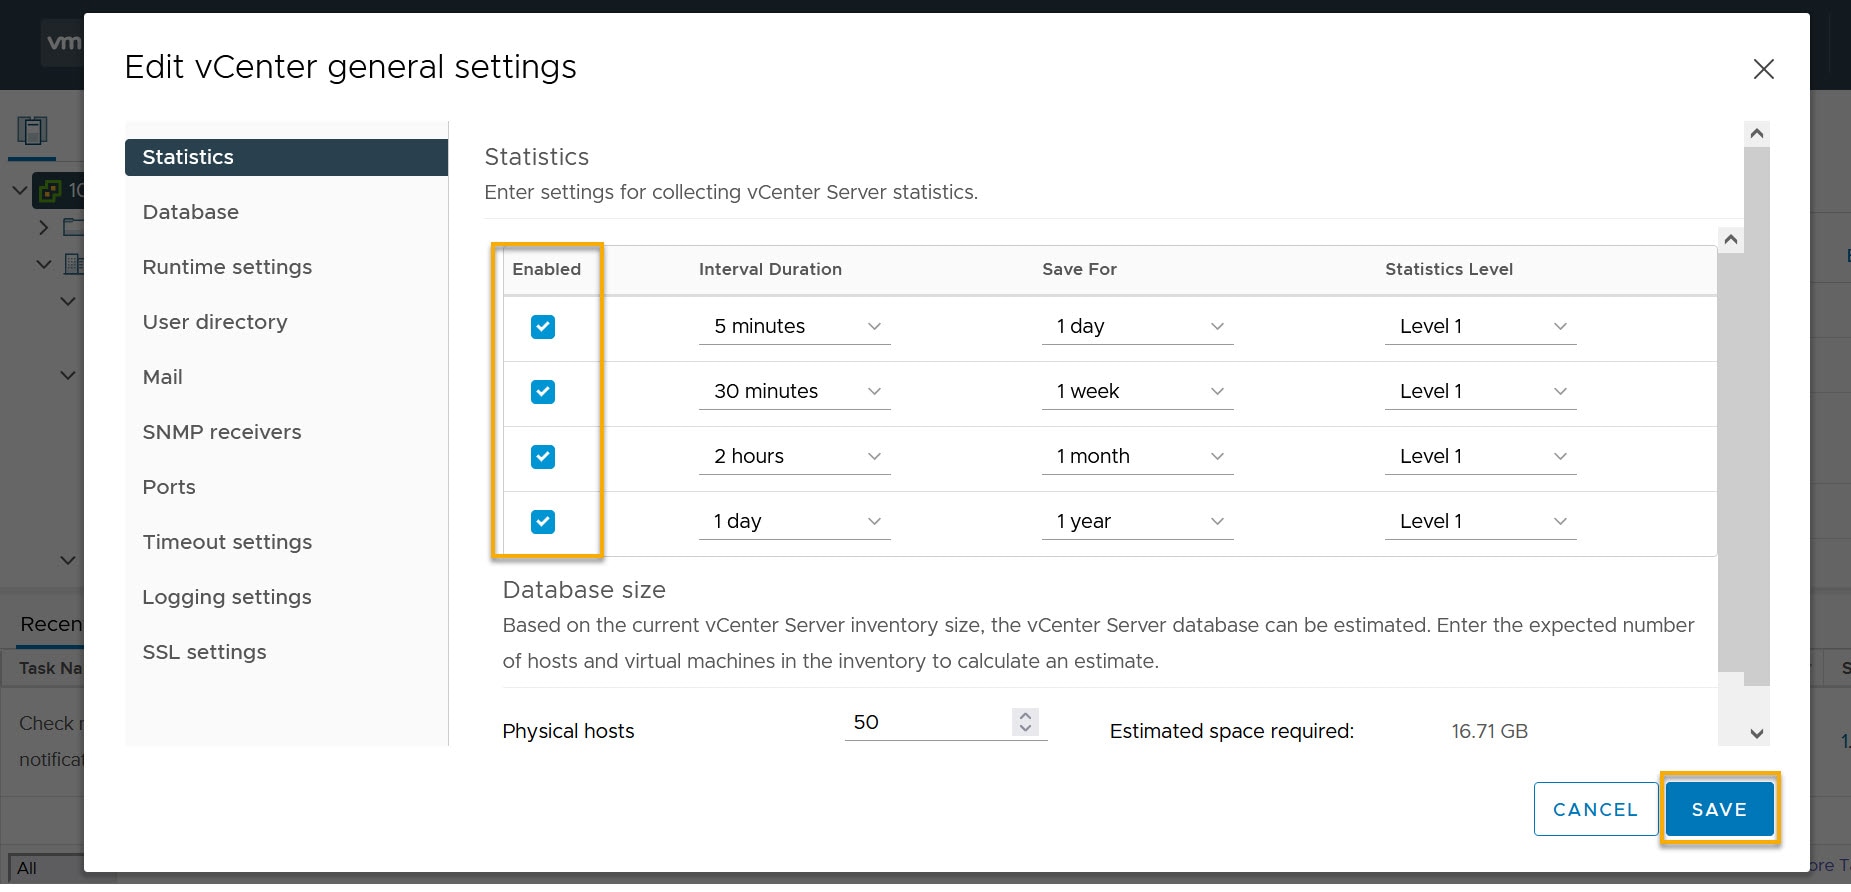
To view VM charts for CPU & Memory, Disk I/O, and VM Flow, you must edit the vCenter settings on the vSphere vCenter and enable statistics manually.
To enable statistics manually on the vSphere vCenter, perform the following steps:
-
Login to vSphere vCenter. (Click on the appropriate Host.)
-
Click Configure > EDIT. The Edit vCenter general settings page appears.
-
On the Statistics tab, check all the check boxes and click SAVE.
To view the SAN host enclosures from the NDFC SAN Controller GUI, perform the following steps:
-
Choose Manage > Inventory > Hosts.
The list of hosts in the Enclosures table is displayed.
-
Click the host name.
The Host slide-in pane displays general information.
-
Click on #VMs to view the required virtual machine (VM) details.
The SAN Host VM Screen is displayed.
The SAN Host VM Screen consists of two panels.
Enclosures - It consists of host name and its network attributes such as operating system, IP address, MAC address, number of CPUs, memory size, read/write value, status of host, data storage, and port value.
Select an enclosure to view:
-
CPU & Memory - Plotted graph displays percentage corresponding to time.
-
Disk I/O - Plotted graph displays kilobyte/sec corresponding to time.
-
VM Flow - This screen displays Initiator, Target, and the Namespace/LUN of the selected host.
Click the information (i) icon to view the related initiator-target flows on the SAN Insights Metrics Custom Graphing page.
Topology
Click the Topology tab on the Overview dashboard.
The Topology page displays color-encoded nodes and links that correspond to various network elements, including switches, links, fabric extenders, port-channel configurations, virtual port-channels, and more. Use this page to perform the following tasks:
-
To view more information about each of these elements, hover your cursor over the corresponding element.
-
To view your navigation in the topology, view the breadcrumb at the top.
-
When you click the device or the element, a slide-in pane appears from the right that displays more information about the device or the element. To view more information in the topology, double-click a node to open the node topology. For example, to view the fabric topology and its components on the Topology page, double-click the fabric node and then double-click an element that you want to view such as a host, a multicast group or a multicast flow, as applicable to the fabric type, and view the respective topology.
-
If you want to view the fabric summary for the fabrics, click the fabric node. From the Fabric Summary slide-in pane, open the Fabric Overview page. Alternatively, you can right-click a fabric and choose Detailed View to open the Fabric Overview page. For more information about the fabric overview page, see Fabric Overview.
-
Similarly, you can click on a switch to display the configured switch name, IP address, switch model, and other summary information such as status, serial number, health, last-polled CPU utilization, and last-polled memory utilization in the Switch slide-in pane. To view more information, click the Launch icon to open the Switch Overview page. For more information about switch overview page, see Switch Overview.
SAN switches have only two roles, Core Router and Edge Router.
-
Choose an action from the Actions drop-down list to perform various actions based on the element you select in the topology.
-
To perform actions on the elements in the topology, other than the ones listed in the actions drop-down list, right-click the element. This opens the appropriate pages and allows you to perform tasks based on the elements. For example, if you right-click a fabric, you can perform tasks such as various configurations, delete the fabric, rediscover the fabric, and many more.
Searching Topology
Use a combination of search attributes and search criteria in the search bar for an effective search. As you enter a combination of search attribute and search criteria in the search bar, the corresponding devices are highlighted in the topology.
You can apply the search criteria such as equals (=), does not equal (!=), contains (contains), and does not contain (!contains).
The search attribute that you can use for SAN fabric is fabric name.
When a device is displayed on the topology, double-click it to navigate further into the topology. For example, when the fabric that you searched is displayed on the topology, double-click on the fabric (cloud icon) to navigate inside its topology. Furthermore, after the fabric is displayed on the topology, you can continue to search based on a combination of a criteria and various search attributes such as switch name, IP address, model, serial, software version, and up time.

Certain levels of the topology allow filters only, that is, filters take the place of Search. The topology listing for these levels display a limited number of entities.
Viewing Topology
To pan, click and hold anywhere in the whitespace and drag the cursor up, down, left, or right. To drag switches, click, hold, and move the cursor around the whitespace region of the topology.
In case of multiple switch selection, you must release the modifier keys (cmd/ctrl) before releasing the mouse to drag to end the switch selection.
You can view the following information for the devices and links in the View pane:
| Option | Description |
|---|---|
|
Layout Options |
You can zoom in, zoom out, or adjust the layout to fit the screen. You can also refresh the topology or save any changes to the topology. For more information, see Zooming\Panning\Dragging. |
|
Select Layout |
Choose the layout for your topology from this drop-down list, and click Save Topology Layout in the layout options. For more information, see Layouts. |
|
Status |
View the configuration status and operational status for SAN or LAN topologies. The status of every device or link is represented by different colors. For more information, see Status. |
|
Show Interfaces |
View all the interface nodes connected to a switch or a zone using the Show Interfaces option. For more information, see the Show Interfaces Option. |
View the topology for a node depending on the selected scope. Each scope is shown in hierarchical order. An example hierarchy might be Data Center > fabric-name > switch-name.
You can view the following scopes:
-
Data Center
-
Cluster (vCenter)
-
Resource List (DVS, Compute, and VM)
-
Resource
-
On the Topology page, FEX appears in gray (Unknown or NA) because operation and configuration status is not calculated for FEX.
-
After moving a cable from one port to another port, the old fabric link is retained on the Topology page, and it displays in red, indicating that the link is down. Right-click on the link, and delete it if the removal was intentional. A manual rediscovery of the switch also deletes and recreates all the links to that switch.
When you deploy a Multi-Site Domain (MSD) fabric with child fabrics, to view the multi-site topology, double-click on a fabric node. Choose the MSD scope or double-click on the gray MSD node to view the MSD topology.
Viewing Elements in SAN Topology
-
Navigate to Fabric Controller > Topology.
-
Double-click on a fabric.
You can view a VSAN node and the connected switches in the topology diagram.
This section provides information about various elements or entities displayed on the Topology page for SAN fabrics.
VSAN
-
Double-click on a fabric to view the fabric topology.
A SAN fabric contains VSAN nodes and switches. The VSAN node has a number displayed in parens, which indicates the number of VSANs in the fabric.
The VSAN topology displays zones and switches connected to the VSAN.
You must have configured the VSAN and the links with VSAN membership to view the VSANs.
-
Single-click on the VSAN node to view a slide-in summary pane of the individual VSANs in the VSAN-node topology.
After the VSAN slide-in summary pane appears, you can search for VSAN attributes or by search criteria in the Search by Attributes field. For more information, see Searching Topology.
-
Click any VSAN in the VSAN summary slide-in pane to display the VSAN.
You can view the grouping of the VSAN and any connected switches or zones in the topology diagram.
Table 1. VSAN Summary Fields and Descriptions Field Description Name
Specifies the name of the VLAN.
Id
Specifies the ID of the VLAN.
Status
Specifies the ID of the VLAN.
If you click the tooltip in the Status column, you can see the status of the switch and if the switch is a principal switch.
The pagination bar at the bottom of the VSAN summary slide-in pane displays the number of VSANs for the fabric.
Zone
-
Single-click on the VSAN node in the fabric topology diagram to display the VSAN summary slide-in pane.
-
Click on a VSAN node to display the Zone Devices summary slide-in pane where you can view the connected host and storage devices.
You can also view the grouping of the VSAN with the connected host and storage devices in the fabric topology diagram.
You can advance to the next page in the Zone Devices summary slide-in pane by clicking a zone name.
Hosts and Storage
-
Single-click on a zone in the fabric topology diagram to view the Zones Devices summary slide-in pane where you can view the connected hosts and storage devices.
You can also view the grouping of hosts and storage devices in the fabric topology.
-
Click on a switch directly in the fabric topology to view a summary of the switch.
The switch topology displays the hosts and storage devices connected to the switch.
Hosts
-
Click on the host device to view more information about the host in the slide-in pane.
-
From the Zone Devices slide-in pane, you can click on a host to open the Host Overview dashboard.
-
You can also right-click on the host device and click the Detailed View to open the Host Overview dashboard.
Storage
-
Click on the storage device to view more information about the storage in the Zone Devices slide-in pane.
-
From the Zone Devices slide-in pane, you can open the Storage Overview dashboard.
-
You can right-click on the storage device and click the Detailed View to open the Storage Overview dashboard.
Links
In the switch topology, click on the link that connects two devices, for example, the switch and the storage to open the Link slide-in pane.
This slide-in pane displays the details related to the last polling of the performance data.
You must have configured performance monitoring for the fabric in Performance Data Collection Settings.
Performance monitoring allows the Nexus Dashboard Fabric Controller to collect the traffic information and the aggregated information is displayed along with a graph showing traffic utilization. The Nexus Dashboard Fabric Controller updates the last poll metric every five minutes for all the ports, links, and so on for all the switches in the fabric. If the date and time displayed in this slide-in pane is current, then the last poll metric details are up to date.
| Field | Description |
|---|---|
|
General Information |
Specifies general information such as link capacity, VSAN, and status. |
|
Information |
Specifies information about the traffic for the last 24 hours with details such as average, maximum, and minimum Rx and Tx in bytes. The slide-in panel includes the following poll metrics details:
Note that the table is paginated. |
Zooming\Panning\Dragging
You can zoom in and zoom out using the controls that are provided at the bottom left of the pages or by using your mouse’s wheel.
To pan, click and hold anywhere in the whitespace and drag the cursor up, down, left, or right.
To drag switches, click, hold, and move the cursor around the whitespace region of the topology.
Layouts
The topology supports different layouts along with a Save Layout option that remembers how you positioned your topology.
-
Hierarchical and Hierarchical Left-Right - Provide an architectural view of your topology. Various switch roles can be defined that will draw the nodes on how you configure your CLOS topology.
When running a large-scale setup, being able to easily view all your switches on a leaf-tier can become difficult. To mitigate this, Nexus Dashboard Fabric Controller splits your leaf-tier every 16 switches.
-
Circular and Tiered-Circular - Draw nodes in a circular or concentric circular pattern.
-
Random - Nodes are placed randomly on the page. Nexus Dashboard Fabric Controller tries to make a guess and intelligently place nodes that belong together in close proximity.
-
Custom saved layout - Nodes can be dragged around according to your preference. After you position as required, click Save to retain the positions. The next time you come to the topology, Nexus Dashboard Fabric Controller will draw the nodes based on your last saved layout positions.
Before a layout is chosen, Nexus Dashboard Fabric Controller checks if a custom layout is applied. If a custom layout is applied, Nexus Dashboard Fabric Controller uses it. If a custom layout is not applied, Nexus Dashboard Fabric Controller checks if switches exist at different tiers, and chooses the Hierarchical layout or the Hierarchical Left-Right layout. Force-directed layout is chosen if all the other layouts fail.
Status
The color coding of each node and link corresponds to its state. The operational colors and what they indicate are described in the following list:
-
Green - Indicates that the element is in good health and functioning as intended.
-
Blue - Indicates that the element is in a warning state and requires attention to prevent any further problems.
-
Yellow - Indicates that the element has minor issues.
-
Orange - Indicates that the element has major issues and requires attention to prevent any further problems.
-
Red - Indicates that the element is in critical state and requires immediate attention.
-
Gray: Indicates lack of information to identify the element or the element has been discovered.
The configurational colors and what they indicate are described in the following list:
-
Green - Indicates that the element is element is In-Sync with the intended configuration.
-
Blue - Indicates that the element has pending deployments.
-
Yellow - Indicates that active deployments are in-progress.
-
Red - Indicates that the element is Out-of-Sync with the intended configuration.
-
Gray: Indicates lack of information or no support for Configuration Sync calculation.
NOTE:
-
On the Topology page, FEX appears in gray (Unknown or n/a) because the operation and configuration status is not calculated for FEX.
-
After moving a cable from one port to another port, the old fabric link is retained on the Topology page, and it is shown in red, indicating that the link is down. Right-click on the link and delete it if the removal was intentional. A manual rediscover of the switch will also delete and re-learn all the links to that switch.
-
Show Interfaces Option
-
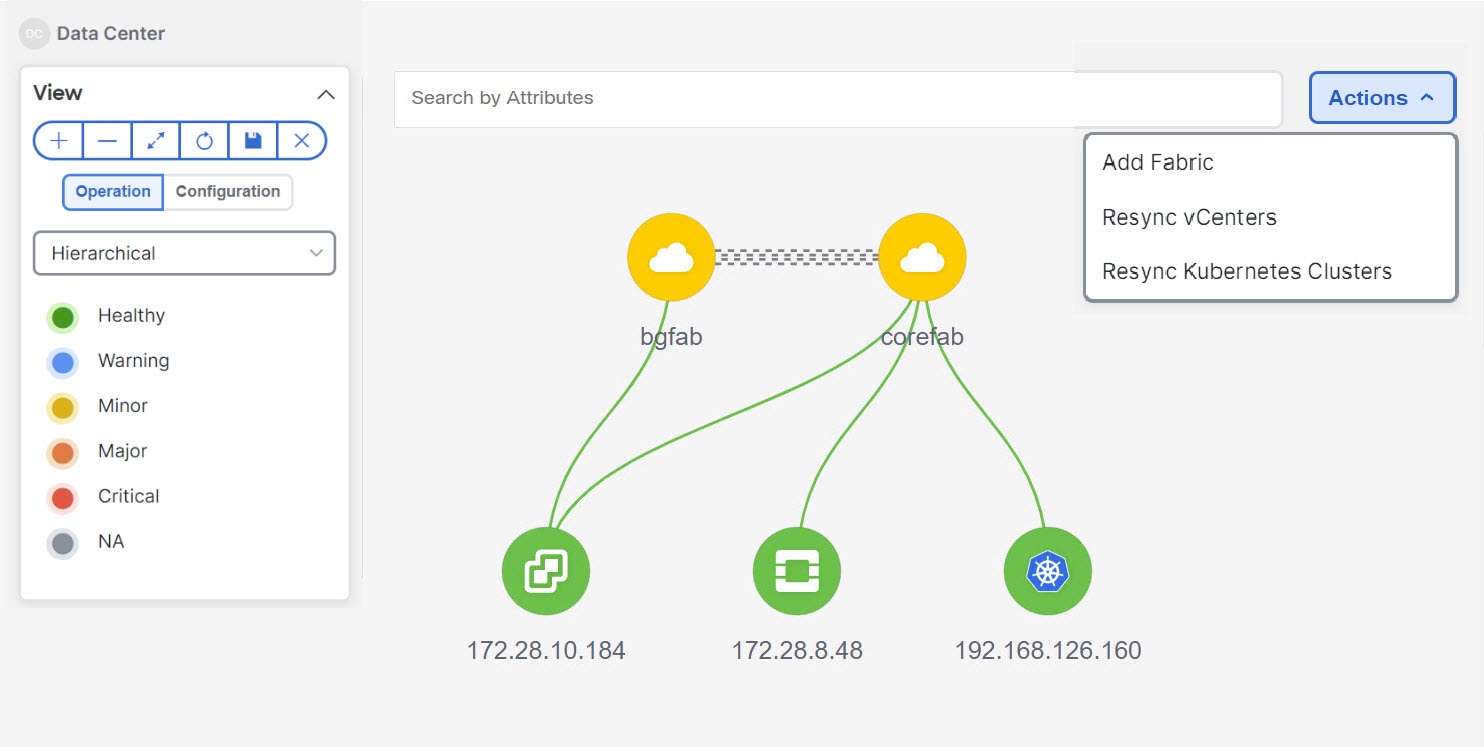
Navigate to the Fabric Controller > Topology page.
-
Click on Data Center.
The network topology diagram appears.
-
Double-click on a fabric within the network topology diagram.
A VSAN node with connected switches or zones appears in the network topology diagram.
-
Double-click on a switch or a zone.
The Show Interfaces toggle displays if the switch or the zone has a connected host or storage device.
-
Enable the Show Interfaces option to display all the interface nodes connected to the switch or the zone.
You can view all the interface nodes when viewing active zones or zones.
Initial Setup
The following topics provide initial setup information for the SAN operational mode in the Cisco Nexus Dashboard Fabric Controller.
Server Settings
You can set the parameters that are populated as default values.
To set the parameters of the Nexus Dashboard Fabric Controller server from the Cisco Nexus Dashboard Fabric Controller Web UI, perform the following steps:
-
Choose Admin > System Settings > Server Settings.
Server settings are classified under different tabs,
-
Modify the settings based on the requirement.
-
Click Save to apply the new modified settings.
Each microservice of enabled features has other tabs and properties other than listed below. Each field has short description. If there is error during configuring any features, corresponding tab is highlighted in red, and Save button is disabled till the errors are resolved. Comprehensive checks are performed in NDFC server by the microservices, if there are any errors is displayed on NDFC UI. Server settings supported for 'all-or-none' to save properties and it doesn’t support partial updates.
You can modify required properties in server settings without the support of Cisco Technical Assistance (TAC).
If Nexus Dashboard is rebooted, NDFC services are down for some time.
Feature Management
In Cisco DCNM Release 11.x, you must choose the install mode while installing the DCNM. From Release 12.0.1a, Cisco Nexus Dashboard Fabric Controller allows you to install the service on the Nexus Dashboard. After you launch the Nexus Dashboard Fabric Controller GUI, you will see three different install modes on the Feature Management page.
Nexus Dashboard Fabric Controller 12 allows you to dynamically enable the feature set and scale applications. Choose Admin > System Settings > Feature Management to choose the installer type and enable or disable a few features based on the selected deployment.
When you launch Nexus Dashboard Fabric Controller for the first time from Cisco Nexus Dashboard, the Feature Management page appears. You can perform only backup and restore operations before you choose the feature set.
On the Feature Management page, you can choose one of the following install modes:
-
Fabric Discovery
-
Fabric Controller
-
SAN Controller
After you select a feature set, from the next login, the dashboard page opens when you launch Cisco Nexus Dashboard Fabric Controller from Nexus Dashboard.
Choosing Feature Set
When you launch Cisco Nexus Dashboard Fabric Controller 12 for the first time, none of the feature set is enabled. During this state, you can perform Backup and Restore to restore the DCNM 11.5(x) data on Nexus Dashboard Fabric Controller 12. Nexus Dashboard Fabric Controller will read the data from the backup file and select the installer type accordingly.
To deploy feature-set from Cisco Nexus Dashboard Fabric Controller Web UI perform the following steps:
-
Choose Admin > System Settings > Feature Management.
-
Select a persona to view the default set of features.
For information about the features available in Cisco NDFC personas, see Features with each Operational Mode.
-
In the table below, select the check box against the feature name available with the feature set.
-
Click Apply.
The feature-set will be deployed. The selected applications will be enabled. A message appears that the feature set is installed, and you must refresh to take effect.
-
Refresh the browser to deploy Nexus Dashboard Fabric Controller with the selected feature set and applications.
The left pane shows the features supported specifically with the deployed feature set.
Features with each Operational Mode
SAN Controller
FICON
Enables the switch to communicate with IBM z Systems Mainframes that utilize the ANSI FC-SB Single-Byte Command Code Sets Mapping Protocol for Fibre Channel fabrics. When enabled, NDFC provides details about the FICON interfaces on the switches such as the interface details, the device to which the FICON port is connected and information about data transmitted or received through the interface at different intervals. See the section "Viewing FC FICON Ports" in Add Interfaces for SAN Operational Mode for more information about FICON interfaces.
Performance Monitoring
Enable this feature to monitor performance of fabrics in NDFC. See the section "Configuring Performance" in Understanding SAN Fabrics for more information.
SAN Insights
The SAN Insights feature enables you to configure, monitor, and view the flow analytics in fabrics. SAN Insights features of SAN Controller enable you to visualize the health-related indicators in the interface so that you can quickly identify issues in fabrics. See SAN Insights for more information.
Before you install or upgrade to SAN Controller Release 12.1.1e, ensure that you configure persistent IP address on Cisco Nexus Dashboard.
VMM Visualizer
Enable this feature to configure network visualization of Virtual Machines on fabrics. See Virtual Infrastructure Manager for more information.
SAN Insights and VMM Visualizer features are not enabled after restore. You must choose check boxes on Admin > System Settings > Feature Management and click Save to enable these features after restore.
Changing across Feature-Set
Nexus Dashboard Fabric Controller 12 allows you to switch from one feature set to another. Choose Admin > System Settings > Feature Management. Select the desired feature set and applications in the table below. Click Save & Continue. Refresh the browser to begin using Cisco Nexus Dashboard Fabric Controller with the new feature set and applications.
There are a few features/applications supported with specific deployments. When you change the feature set, some of these features are not supported in the new deployment. The following table provides details about the pre-requisites and criteria based on which you can change the feature set.
| From/To | Fabric Discovery | Fabric Controller | SAN Controller |
|---|---|---|---|
|
Fabric Discovery |
- |
Only monitor mode fabric is supported in Fabric Discovery deployment. When you change the feature set, the fabric can be used in the Fabric Controller deployment. |
Not supported |
|
Fabric Controller |
You must delete the existing fabrics before changing the fabric set. |
If you’re changing from Easy Fabric to IPFM fabric application, you must delete the exiting fabrics. |
Not supported |
|
SAN Controller |
Not supported |
Not supported |
- |
SAN Credentials Management
Choose Admin > SAN Credentials to display the SNMP access details to the fabric seed switch. If the user has validated the access to all the fabrics, the SNMP credentials for all the seed switches of the fabrics is displayed.
The switch credentials page for the Cisco Nexus Dashboard Fabric Controller has the following fields:
| Field | Description |
|---|---|
|
Seed Switch |
IP address of the switch. |
|
Username |
Specifies the username of the Cisco Nexus Dashboard Fabric Controller user. |
|
Password |
Displays the encrypted form of the switch SNMP user. |
|
SNMPv3/SSH |
Specifies if the SNMP protocol is validated or not. |
|
The default value is false. |
Auth/Privacy |
|
Specifies the Authentication protocol. |
The default value is NOT_SET. |
|
Status |
Displays the status of the switch. |
Before the Cisco Nexus Dashboard Fabric Controller user configures the fabric using SNMP, the user must furnish and validate SNMP credentials on the seed switch of the fabric. If the user does not provide valid credentials for the fabric seed switch, the Switch Credentials table shows the default values for SNMPv3/SSH and AuthPrivacy fields.
The following table describes the action items, in the Actions menu drop-down list, that appear on Settings > SAN Credentials Management.
| Action Item | Description |
|---|---|
|
Edit |
Select a row from the table and choose Edit to update the switch credentials information. |
|
Clear |
Clears the switch credentials. |
|
Validate |
Revalidates the switch credentials. |
Copyright
THE SPECIFICATIONS AND INFORMATION REGARDING THE PRODUCTS IN THIS MANUAL ARE SUBJECT TO CHANGE WITHOUT NOTICE. ALL STATEMENTS, INFORMATION, AND RECOMMENDATIONS IN THIS MANUAL ARE BELIEVED TO BE ACCURATE BUT ARE PRESENTED WITHOUT WARRANTY OF ANY KIND, EXPRESS OR IMPLIED. USERS MUST TAKE FULL RESPONSIBILITY FOR THEIR APPLICATION OF ANY PRODUCTS.
THE SOFTWARE LICENSE AND LIMITED WARRANTY FOR THE ACCOMPANYING PRODUCT ARE SET FORTH IN THE INFORMATION PACKET THAT SHIPPED WITH THE PRODUCT AND ARE INCORPORATED HEREIN BY THIS REFERENCE. IF YOU ARE UNABLE TO LOCATE THE SOFTWARE LICENSE OR LIMITED WARRANTY, CONTACT YOUR CISCO REPRESENTATIVE FOR A COPY.
The Cisco implementation of TCP header compression is an adaptation of a program developed by the University of California, Berkeley (UCB) as part of UCB’s public domain version of the UNIX operating system. All rights reserved. Copyright © 1981, Regents of the University of California.
NOTWITHSTANDING ANY OTHER WARRANTY HEREIN, ALL DOCUMENT FILES AND SOFTWARE OF THESE SUPPLIERS ARE PROVIDED “AS IS" WITH ALL FAULTS. CISCO AND THE ABOVE-NAMED SUPPLIERS DISCLAIM ALL WARRANTIES, EXPRESSED OR IMPLIED, INCLUDING, WITHOUT LIMITATION, THOSE OF MERCHANTABILITY, FITNESS FOR A PARTICULAR PURPOSE AND NONINFRINGEMENT OR ARISING FROM A COURSE OF DEALING, USAGE, OR TRADE PRACTICE.
IN NO EVENT SHALL CISCO OR ITS SUPPLIERS BE LIABLE FOR ANY INDIRECT, SPECIAL, CONSEQUENTIAL, OR INCIDENTAL DAMAGES, INCLUDING, WITHOUT LIMITATION, LOST PROFITS OR LOSS OR DAMAGE TO DATA ARISING OUT OF THE USE OR INABILITY TO USE THIS MANUAL, EVEN IF CISCO OR ITS SUPPLIERS HAVE BEEN ADVISED OF THE POSSIBILITY OF SUCH DAMAGES.
Any Internet Protocol (IP) addresses and phone numbers used in this document are not intended to be actual addresses and phone numbers. Any examples, command display output, network topology diagrams, and other figures included in the document are shown for illustrative purposes only. Any use of actual IP addresses or phone numbers in illustrative content is unintentional and coincidental.
The documentation set for this product strives to use bias-free language. For the purposes of this documentation set, bias-free is defined as language that does not imply discrimination based on age, disability, gender, racial identity, ethnic identity, sexual orientation, socioeconomic status, and intersectionality. Exceptions may be present in the documentation due to language that is hardcoded in the user interfaces of the product software, language used based on RFP documentation, or language that is used by a referenced third-party product.
Cisco and the Cisco logo are trademarks or registered trademarks of Cisco and/or its affiliates in the U.S. and other countries. To view a list of Cisco trademarks, go to this URL: http://www.cisco.com/go/trademarks. Third-party trademarks mentioned are the property of their respective owners. The use of the word partner does not imply a partnership relationship between Cisco and any other company. (1110R)
© 2017-2024 Cisco Systems, Inc. All rights reserved.