Cisco Unity Maintenance Guide (With Microsoft Exchange), Release 4.0(4)
Performance Monitoring

Table Of Contents

Performance Monitoring

Introduction to Monitoring Cisco Unity Performance

Defining Performance

Determining Performance Expectations

Performance Monitoring in an On-Box vs. Off-Box Message Store Environment

Permissions Required for Performance Monitoring

Configuring the Network Provider Monitor on the Cisco Unity Server and Cisco Unity Message Store Servers

Configuring Cisco Unity Performance Information Tools

Configuring Cisco Unity Performance Information and Diagnostics (CUPID)

Configuring Microsoft Performance Monitor

Performance Monitor Configuration for a Cisco Unity Server

Performance Monitor Configuration for an Off-Box Cisco Unity Message Store Server

Administrative Monitoring Guidelines for Cisco Unity Performance

Performance Testing

Performance Testing Process

Preparing to Conduct the Test

Task List: Preparing for Performance Testing

Conducting the Test

Measuring Performance and Collecting the Recorded Data

Analyzing Performance Test Results

Developing a Corrective Action Plan

Modifying the System to Implement the Corrective Action Plan

Resolving Identified Issues

Completing the Test Cycle

Performance Counters

Required System Performance Counters

General System Performance Counters

Cisco Unity Server Performance Counters

Cisco Unity Message Store Performance Counters

Troubleshooting Performance Counters


Performance Monitoring


Introduction to Monitoring Cisco Unity Performance

Performance data is valuable for troubleshooting, predicting future system requirements, and administrative monitoring of the Cisco Unity messaging infrastructure. Performance information also plays a large part in determining the health and scalability of a Cisco Unity deployment.

Cisco Unity is dependent on the messaging subsystem, which is Microsoft Exchange. If the messaging subsystem fails, goes off line, performs poorly, or otherwise becomes unavailable, unified messaging functionality and the performance of Cisco Unity suffers. Because of this dependency on the messaging infrastructure, the message store architecture and the design of a Cisco Unity deployment are two of the most important factors to consider for performance impact on the user experience.

Defining Performance

In client/server computing, performance is the speed, efficiency, and ultimately the responsiveness of computer operations. Traffic flow is a good analogy for computing because the computing system logically compares to a traffic grid. Moving a vehicle from one end of a city to the other presents particular challenges to transportation efficiency, as does moving data from one end of a computer system to another. Issues such as timing, speed, load patterns, queuing, and the efficiency of the system all affect the movement of data.

A baseline is the observed and recorded measurement of performance against which comparisons are made. Baselines are only useful if they are recorded and then actively compared against past or future measurements, for example:

Capturing the performance characteristics of a system in order to troubleshoot a particular performance problem.

Comparing the performance behavior of disparate systems to understand the benefits of one over another.

As a planning aid for capacity and future growth of production systems.

At the application level, computer performance is usually divided into four performance elements:

Memory—the quantity and speed of physical memory available to the system or application being measured.

Processor—the capability of a system CPU to execute commands in a timely and efficient manner.

Disk—the quantity and speed of the physical persistent storage subsystem.

Network—the bandwidth and latency involved in transmitting or receiving data from the network.

There are other factors that can introduce performance degradation, such as heat, electromagnetic radiation, and inferior components, but they are for consideration at a lower level of computer design and implementation than we are concerned with here.

Determining Performance Expectations

In a unified messaging deployment, user expectations for e-mail and voice messages may not be the same. E-mail messaging involves the transmission of text or images within electronic mail that is not entirely time-dependent. An acceptable rate of delivery may range from a few seconds to a few minutes. In contrast, voice messaging involves the real-time transmission of audio information to a user and demands a lower occurrence of delay or latency. What qualifies as acceptable performance can vary from site to site, and from user to user. Determining what is required for performance monitoring equates to determining and communicating what is acceptable performance.

Sites need to level user assumptions and expectations of messaging performance against the realities of business demands. A rock-solid design and implementation plan for the messaging infrastructure is usually the best defense against unmet expectations, but problems do still occur. Some common reasons for performance issues and unmet expectations include:

The expected load on the system was initially incorrect or changed significantly from the original design. For example, a successful business expands beyond the projected growth in the original deployment plan, and consequently more users are pushing the system beyond the original design parameters.

The existing e-mail messaging infrastructure cannot meet the performance needs for unified communications. This does not necessarily imply that there is an additional overhead created by voice communications, just that the tolerances for performance expectations are much lower.

A good measure of how well expectations are being met is to simply ask if the solution provides the service requested. From there, the next steps are adding accessibility, speed of response, and other site-specific factors. Bear in mind that these questions are some of the most difficult to answer because they are subjective:

Is the server and/or network performing adequately? How do you define adequate performance?

Do users experience unnecessary delays? What constitutes an unnecessary delay?

What was the application, server, or network doing during an period of inadequate performance or unnecessary delay? Was this planned for? How can the problem be isolated?

Performance Monitoring in an On-Box vs. Off-Box Message Store Environment

In the Cisco Unity architecture, it is not required, nor in some configurations is it optimal or even supported, to have the Cisco Unity message store on the same physical server hardware (on-box) as the Cisco Unity server that conducts voice call processing. (What is commonly referred to as an off-box message store configuration is a Cisco Unity system that stores subscriber messages on a separate physical server or servers.) An off-box configuration can present a significant performance benefit by distributing the performance resources required across multiple systems.

As with any implementation design, there are caveats to the off-box configuration. For example, the network on which the communications between Cisco Unity and the message store occur can become a bottleneck or point of failure. It is therefore necessary to monitor all of the servers and message stores in use by Cisco Unity for performance issues. To assist in this task, the Cisco Unified Performance Information and Diagnostics (CUPID) tool, Microsoft Performance Monitor, and Microsoft Management Console (MMC) each allow single-point remote administration of multiple servers.

For additional information on storage and related issues, refer to White Paper: Physical Storage Best Practices for Cisco Unity with Microsoft Exchange, available at http://www.cisco.com/univercd/cc/td/doc/product/voice/c_unity/whitpapr/storage.htm.

Permissions Required for Performance Monitoring

Administrative privileges are required for each of the servers to be monitored. Use an administrative account, or assign the following minimum permissions to a specific account or group responsible for performance monitoring:

Log on as a service (for CUPID monitoring)

Profile system performance

Log on locally (for CUPID configuration and Performance Monitor configuration/monitoring)

Profile single process

Install Network Provider Monitor (administrative privileges)

It is possible and sometimes necessary to remotely monitor a target system with the Performance Monitor. However, issues of service rights for the Performance Logs and Alerts service, and problems with network connectivity, can interfere with testing. Therefore, we recommend that performance tests be run locally on the target machine when possible.

Configuring the Network Provider Monitor on the Cisco Unity Server and Cisco Unity Message Store Servers

To capture network traffic information, it may be necessary to install the Network Monitor Provider. Because of the performance impact of the Network Monitor Provider, we recommend collecting data for short intervals during periods of off-peak system usage.

To Install the Network Monitor Provider


Step 1 On the Windows Start menu, click Settings > Control Panel > Network and Dial-up Connections > <Your Network Adapter Connection>.

Step 2 In the Connection Status dialog box, click Properties.

Step 3 On the General tab in the Connections Properties dialog box, click Install.

Step 4 Select Protocol, then click Add.

Step 5 In the Select Network Protocol Driver window, select Microsoft from the list of manufacturers.

Step 6 Select Network Monitor Driver from the list, then click OK.


Configuring Cisco Unity Performance Information Tools

Running the CUPID utility or the Performance Monitor on the local server is an active, semi-intrusive form of monitoring. However, the effect is mitigated by the large sample interval and relatively small application footprint of CUPID or the Performance Monitor. The overhead or load impact of the monitoring tools should be minimal and not observable in the analysis of the results.

We recommend that the performance log data be captured to a physical disk or logical volume that does not hold either the Cisco Unity executables or the data from Exchange or SQL Server, and that has sufficient space available for collection of diagnostic trace and log data. Doing so will reduce throughput issues on systems with high traffic.

Configuring Cisco Unity Performance Information and Diagnostics (CUPID)

CUPID is a performance and diagnostic information collection utility for Windows 2000. At its core, CUPID is an NT service that communicates to the performance subsystem of the Windows Operating System, and collects data based on the counters specified in a XML configuration file. CUPID is available in Tools Depot for Cisco Unity version 4.0(3) and later. Updates are periodically made available for download at http://www.CiscoUnityTools.com.

The configuration file used for CUPID consists of an XML document with several Counter elements that define the counters to collect. The configuration files included with the CUPID installation represent the latest recommended performance counters to collect when running a performance test. Review the configuration file for the specific needs of the system under test as additional counters may be needed to monitor a third-party backup or antivirus solution in addition to normal messaging activity.

Note that remote monitoring of Cisco Unity or Cisco Unity message store performance with CUPID is not supported. Refer to the CUPID Help for more information.

To Change CUPID Configuration Settings


Step 1 On the Cisco Unity server desktop, double-click the Cisco Unity Tools Depot icon.

Step 2 In the left pane, under Diagnostic Tools, double-click CUPID. If CUPID has not previously been run on this server, install the CUPID service when prompted.

Step 3 Select CUPID configuration options according to the needs of your configuration.

Step 4 Select the XML file that reflects your Cisco Unity configuration or manually create an XML document that suits the needs of the configuration to be measured.


To Automatically Start Collection of CUPID Performance Information on System Startup


Step 1 Open the Services Control Panel applet.

Step 2 Select the Cisco Unity Performance Information and Diagnostics service.

Step 3 Right-click the service, then select Properties.

Step 4 Set the Service Startup Type to Automatic.


Configuring Microsoft Performance Monitor

The Microsoft Management Console (MMC), of which the Performance Monitor is a pair of components, is a collection of modular administration tools that allows a centralized interface for many different maintenance and managerial functions on a local or remote system. The MMC is flexible enough to allow a single point of administration, and to allow custom interfaces or consoles to accomplish common tasks.

When working with Cisco Unity, an administrator may need to access elements of the MMC that deal with Active Directory Users and Computers, Exchange servers, or SQL servers. However, when assessing Cisco Unity performance, the Performance Monitor, which is comprised of the System Monitor and the Performance Logs and Alerts controls, is the preferred tool for overall analysis.

The System Monitor is an ActiveX control component that can be added to a MMC console or embedded within a web page or similar document. The authored console version of the Performance Monitor contains both the System Monitor and the Performance Logs and Alerts control. A stand-alone executable version is also available from the Windows 2000 Resource Kit.

Note that some elements of Cisco Unity performance may be difficult or impossible to measure through the use of the Performance Monitor alone. For example, Message Waiting Indication (MWI) response time, message delivery speed, and directory/addressing lookup delays are difficult performance elements to measure. Because certain operations depend on the distributed elements of a larger system (such as network bandwidth, remote message store server performance, and voice board or integration performance), the Performance Monitor may only be able to show a portion of a particular performance issue. There may be additional hardware or software tools (such as a network packet analyzer) and methods required to obtain the performance information necessary to characterize the complete Cisco Unity implementation.

To Start the Performance Monitor as an Authored Console


Step 1 On the Windows Start menu, click Programs > Administrative Tools > Performance.


To Embed Performance Monitoring Capability in an MMC Console


Step 1 On the Windows Start menu, click Run.

Step 2 Enter mmc and then press Enter.

Step 3 On the Application menu, click Console > Add/Remove Snap-In.

Step 4 In the Add/Remove Snap-In dialog box, click Add.

Step 5 In the Add Standalone Snap-In dialog box, select the Performance Logs and Alerts control, and then click Add.

Step 6 In the Add Standalone Snap-In dialog box, select ActiveX Control, and then click Add.

Step 7 In the Insert ActiveX Control wizard, click Next.

Step 8 In the Control Categories list, select All Categories.

Step 9 In the Control Type list, select System Monitor Control.

Step 10 Select a name for the control, or accept the default name, then click Finish.

Step 11 In the Add Standalone Snap-In dialog box, click Close.

Step 12 Click OK.

Step 13 Save the console you just created to an MSC file for later use.


To Embed Performance Monitoring Capability in a Document


Step 1 Open an OLE-capable document (for example, a Microsoft Word or Microsoft PowerPoint document.)

Step 2 On the Application menu, click Insert > Object.

Step 3 In the Insert Object dialog box, select System Monitor Control, and then click OK.

Step 4 Resize and configure the embedded control as necessary.


Performance Monitor Configuration for a Cisco Unity Server

Configuring the Microsoft Performance Monitor for use with Cisco Unity involves adding the applicable performance counters to a counter log. For a list of counters that need to be collected to begin the performance monitoring process, see Table 7-1. Additional counters may be necessary to refine the specific goals of a particular performance investigation, but the counters listed in Table 7-1 are a good start.

To Manually Configure the Performance Monitor for Real-time Performance Monitoring of a Cisco Unity Server


Step 1 On the Windows Start menu, click Programs > Administrative Tools > Performance.

Step 2 In the tree view, click System Monitor.

Step 3 In the control view in the right panel, right-click the applicable control.

Step 4 On the popup menu, click Properties.

Step 5 On the General tab of the System Monitor Properties dialog box, verify that the Update Automatically field is set to 5 Seconds or longer.

Step 6 On the Data tab of the System Monitor Properties dialog box, add the counters specified in Table 7-1, or any counters that are required for your test.


To Manually Configure the Performance Monitor for Data Collection (Performance Monitoring Log)


Step 1 On the Windows Start menu, click Programs > Administrative Tools > Performance.

Step 2 Expand the Performance Logs and Alerts control, and click Counter Logs.

Step 3 Right-click Counter Logs.

Step 4 On the popup menu, click New Log Settings.

Step 5 Enter a name for the new log settings, and then click OK.

Step 6 On the General tab of the dialog box, add the counters specified in Table 7-1, or any counters that are required for your test.

Step 7 Set the Data Sample Interval to 5 Minutes.

Step 8 On the Log Files tab of the dialog box, change the Log file type to Text File - CSV.


Note We recommend that you use CSV file format, because CSV files are portable to external data manipulation and spreadsheet applications such as Perl scripting and Microsoft Excel.


Step 9 Set the maximum CSV file size to 10000K.

Step 10 Select the option to start a new log file when the maximum file size is reached.

Step 11 Set additional parameters as needed.


Performance Monitor Configuration for an Off-Box Cisco Unity Message Store Server

Usually, when you are monitoring an off-box Cisco Unity message store server, no local Cisco Unity processes need to be monitored. Instead, only the operating system and the message store resources need to be monitored. However, in a Voice Messaging (VM) configuration in which the Microsoft Exchange processes are run locally, both Cisco Unity and Exchange need to be monitored.

The main process that needs to be monitored is the Information Store (Store.exe) that homes all of the databases on the Cisco Unity server. Usage of Store.exe is directly proportional to the number of users on the Cisco Unity system, the size of each database, and the number of databases and storage groups. (Note that additional Exchange 2000 processes may consume some memory resources: MAD.exe (the Exchange 2000 system attendant), and EMSMTA.exe (the Exchange 2000 MTA service).

To Manually Configure the Performance Monitor for Real-Time Performance Monitoring of an Off-Box Message Store Server


Step 1 On the Windows Start menu, click Programs > Administrative Tools > Performance.

Step 2 In the tree view, click System Monitor.

Step 3 In the control view in the right panel, right-click the applicable control.

Step 4 On the popup menu, click Properties.

Step 5 On the General tab of the System Monitor Properties dialog box, verify that the Update Automatically field is set to a value between 5 Seconds and 10 Seconds.

Step 6 On the Data tab of the System Monitor Properties dialog box, add the counters specified in Table 7-1.


To Manually Configure the Performance Monitor for Data Collection Performance Monitoring


Step 1 On the Windows Start menu, click Programs > Administrative Tools > Performance.

Step 2 Expand the Performance Logs and Alerts control, and click Counter Logs.

Step 3 Right-click Counter Logs.

Step 4 On the popup menu, click New Log Settings.

Step 5 Enter a name for the new log settings, then click OK.

Step 6 On the General tab of the dialog box, add the counters specified in Table 7-1.

Step 7 Set the Data Sample Interval to 5 Minutes.

Step 8 On the Log Files tab of the dialog box, change the Log file type to Text File - CSV.

Step 9 Set additional parameters as needed.


Administrative Monitoring Guidelines for Cisco Unity Performance

One of the key elements of a healthy and scalable messaging system is the active monitoring of the system by the administration ultimately responsible for its success. A good method to achieve this is to implement a performance maintenance policy that is supported throughout the deployment of each server in use by Cisco Unity. It is also important to document all necessary performance activities for purposes of scalability planning, capacity audits, and survivability of procedures through personnel changes.

We recommend creating a thorough plan that includes the following tasks:

1. Develop core measurements for indications of system health.

2. Define tools and methods to be used to monitor performance, and document usage of the tools.

You may decide to use a single application, such as CUPID or the Performance Monitor, to monitor messaging system performance, or you may choose to incorporate the monitoring of Cisco Unity and the messaging system into an existing administrative monitoring infrastructure. Third party monitoring solutions (for example, that use SNMP or WMI) are also available to monitor Cisco Unity and other Cisco products in a large enterprise environment.

3. Define a monitoring window.

This includes specifying monitoring timeframes, and deciding when collected logs will be cycled and reviewed. For example, a small company may not have personnel to monitor the messaging system on weekends and every day of the week. Therefore, this company could decide to create a snapshot of performance on Monday mornings, at the time of their busiest call volume.

4. Define a baseline.

A baseline for performance maintenance is crucial for the detection of deviations from normal business operations. Normal business operations should be defined as the average measurements from a typical business day. Depending on the business solution being monitored, the measurements could be gathered for an 8-hour core workday, for all daylight hours, for a 24-hour schedule, or for specific shift hours.

5. Periodically review and refine the collected information.

6. Set useful performance alerts and notifications.

7. Establish a problem resolution policy.

8. Establish a data warehousing policy.

Determine which data needs to be archived. Additionally, consider the storage location and archival time limit for the information.

Performance Testing

A performance test can be useful in evaluating whether situations are appropriately handled by the Cisco Unity server or the Cisco Unity message store. For example, you may want to evaluate the performance of the Cisco Unity server during failover operations, under a significant load from web-based clients, or when extremely large numbers of users initially enroll.


Caution Do not run performance tests during an upgrade or while making changes to phone system integration settings. The Cisco Unity integration performance counters may not be available after an upgrade or after a change to the phone system integration, if the upgrade or integration change was made while performance monitoring services (CUPID or PerfMon) were running. See the "Troubleshooting Performance Counters" section if you experience this problem.

Performance Testing Process

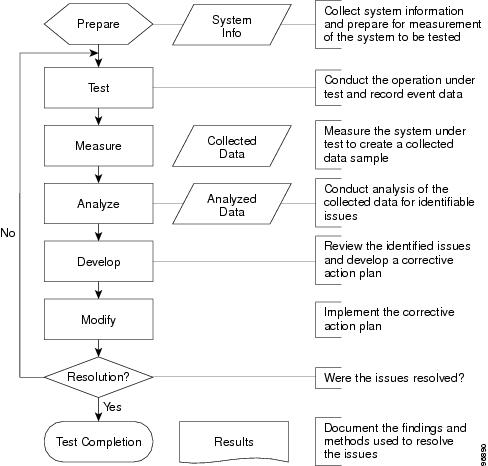
The performance testing process is similar to the scientific method of analysis in that the repeatability of findings is important to an understanding of a problem. In most cases, the performance testing process is cyclical. Every measurement session has the potential to spawn new questions or avenues of approach to the initial question. The cycle may have to be repeated numerous times before the operation under test is fully understood.

We recommend the performance testing process shown in Figure 7-1.

Figure 7-1 Recommended Performance Testing Process

Preparing to Conduct the Test

The following "Task List: Preparing for Performance Testing" details the high-level tasks you need to do in preparation for performance testing. Also see the following procedures:

To Configure Diagnostic Tracing in the Cisco Unity Diagnostics Tool

To Start the Performance Monitoring Tool

To Start a Performance Monitor Counter Log

Task List: Preparing for Performance Testing

1. Determine the test criteria.

Due to the complex architecture of Cisco Unity, it is always a good idea to narrow the focus of the test, if possible. Performance dependencies between system components can quickly make an investigation very complex.

2. Determine the role of user feedback in the test criteria.

For some deployments, this will be the primary concern for any performance consideration. For example, Maximum expected delays or system performance thresholds can be established with user input.

3. Determine the purpose of the performance test.

For example, you may want to monitor Cisco Unity performance to investigate a slow interactive response on an existing deployment, or to validate and gather baseline measurements of an existing message store infrastructure in preparation for a Cisco Unity installation.

4. Determine whether the entire system will be monitored or just a particular feature or area.

If a single feature is to be monitored, it may be possible to reduce the amount of monitoring necessary, while system level monitoring may require a broad range of performance data points. Is a particular area suspected as a bottleneck? If there has been a change to the Cisco Unity system, such as the addition of new hardware or software, and the change seems to have affected performance, the specific area should be monitored. Keep in mind that understanding the system performance as a whole has value, but if the purpose it to identify the cause of a particular bottleneck, narrowing the scope of the investigation is critical.

5. Specify the window of time to be measured and record that information independently of the performance logs.

Specifying a preset amount of time for measurement helps to frame the problem under investigation. For example, if users report slow access times when logging into Cisco Unity on Monday mornings, but not Tuesday mornings, plan for a sample taken from midnight on Sunday until the following Tuesday at midnight. With this information, data from Monday can be compared to the data from Tuesday, within the same set of results. Also, by recording start, stop, and duration sample times independently of the Performance Logs, issues of incorrect, unsynchronized, or remote system times can be avoided.

6. Select an appropriate level of diagnostic tracing.

Because performance tests should be conducted against the target system as that system is normally operated or configured, we recommend that Cisco Unity diagnostic traces be disabled for most performance testing, unless you are instructed otherwise by Cisco TAC.

To Configure Diagnostic Tracing in the Cisco Unity Diagnostics Tool

As a best practice, all diagnostic traces should be disabled except those that are directly related to the performance investigation, or as advised by Cisco TAC.


Step 1 On the Windows Start menu, click Programs > Cisco Unity > Cisco Unity Diagnostic Tool.

Step 2 Select the macro or micro traces appropriate for the system-specific performance investigation, or as specified by Cisco TAC.

If a performance problem is suspected as the cause of a port lockup, we recommend you select the System Locks macro trace.

Cisco TAC may request that additional tools, diagnostics, and procedures be executed on the target system, any of which may have an associated performance impact.


To Start the Performance Monitoring Tool


Step 1 On the Cisco Unity server desktop, double-click the Cisco Unity Tools Depot icon.

Step 2 In the left pane, under Diagnostic Tools, double-click CUPID.


To Start a Performance Monitor Counter Log


Step 1 Open the Microsoft Performance Monitor.

Step 2 Right-click the Counter Log that you prepared for the test in the "Configuring Microsoft Performance Monitor" section.

Step 3 On the popup menu, click Start.


Conducting the Test

Depending on the conditions that are being reproduced for the performance test, conducting the test can involve a variety of activities varying in duration. The goal can be as specific as understanding the memory utilization of a single application process, or as broad as gaining an understanding of overall system performance.

When the performance test is done, we recommend that you stop the collection of performance data, to reduce any operational overhead and prevent unneeded data from being entered into the performance log. Do the following "To Stop the Test" procedure.


Note If you are using the Performance Monitor, save the created or standard console settings so that the test can be repeated if necessary.


To Stop the Test


Step 1 On the Windows Start menu, open the CUPID control application, and click File > Stop Service.

Step 2 Right-click the applicable Performance Monitor Counter Log (or logs), and click Stop on the popup menu.


Measuring Performance and Collecting the Recorded Data

Locate the data file created during the monitored session. You will analyze the collected data by using the Performance Monitor or a suitable spreadsheet application, such as Microsoft Excel. CUPID logs can be opened in both Microsoft Performance Monitor and Microsoft Excel.

To Open a Captured Performance Log File in Performance Monitor


Step 1 On the Windows Start menu, click Programs > Administrative Tools > Performance.

Step 2 In the tree view, click System Monitor.

Step 3 In the control view in the right panel, right-click the applicable control.

Step 4 On the popup menu, click Properties.

Step 5 On the Source tab of the System Monitor Properties dialog box, click Log File.

Step 6 Browse to the log file to be analyzed.

The default location for Performance Monitor logs is C:\PerfLogs.

Step 7 On the Data tab of the System Monitor Properties dialog box, add the counters that are under investigation. Note that only the counters that were recorded in the log will be available for selection.


To Open a Captured Performance Log File in Microsoft Excel


Step 1 Open Microsoft Excel.

Step 2 On the Application menu, click File > Open.

Step 3 Browse to the CSV file generated from the performance test.

The first row in the file represents the available counters that were tracked by the Performance Monitor on the target system and the first column represents the time of the sample. Each row entry constitutes a sample taken on the system and this number will vary depending on the sampling interval.


Collecting information about the system under test is just as important as gathering the performance data from the system. In most cases, it is necessary to run the Gather Cisco Unity System Information (GUSI) tool, available in Tools Depot, and to run Microsoft WinMSD on both the Cisco Unity Server and the Cisco Unity message store.

Note that both of these tools can impact system performance. Schedule the collection of system test information during a maintenance window, if possible.

To Run the Gather Cisco Unity System Information (GUSI) Tool


Step 1 On the Cisco Unity server desktop, double-click the Cisco Unity Tools Depot icon.

Step 2 In the left pane, under Reporting Tools, double-click Gather Unity System Info.

Step 3 Run the Gather Cisco Unity System Information utility.

Step 4 Select a location for the .CAB file that contains the Cisco Unity system information.

Step 5 Click Write to File, and save the system information to the specified location.


To Run WinMSD


Step 1 On the Windows Start Menu, click Run.

Step 2 In the Run dialog box, enter winmsd.

Step 3 Right-click the System Information root, and select Save as Text File.

Step 4 Save the generated text file with the collected performance data for comparison and reference.


Note The information collection process may take a significant amount of time to complete, and the program may appear to stall or hang during this process.


To Collect Event Logs


Step 1 On the Windows Start Menu, click Run.

Step 2 In the Run dialog box, enter eventvwr.

Step 3 Right-click the Application Event Log, and select Save Log File As.

Step 4 Save the log file for future reference.

Step 5 Right-click the System Event Log, and select Save Log File As.

Step 6 Save the log file for future reference.


Analyzing Performance Test Results

Analysis of collected performance test results is an extremely important part of understanding the overall performance of Cisco Unity. The following guidelines allow you to validate, understand, and evaluate the information generated from a performance test.

To validate collected data, open the captured log file in the Performance Monitor or a spreadsheet application and verify that data has actually been recorded. The columns within the open document will contain data in the sequence in which the sample was taken (for most entries.) Columns that are blank represent objects or counters that were non-existent on the target system during the collected sample time.

External, user-discernible indicators of poor Cisco Unity system performance include:

Unexpected delays when dialing into Cisco Unity

Unexpected delays when accessing or deleting voice messages

Long delays between voice prompts

Choppy voice playback

Sluggish Cisco Unity Assistant, Cisco Unity Administrator, and/or Cisco Unity Inbox response

Sluggish window refresh or input device response when logged on locally

Note that some of these indicators are subjective, especially those focusing on the amounts of silence or delay experienced by a user during the Cisco Unity conversation.

There are also internal, or administratively measurable, indicators of poor Cisco Unity system performance:

Excessive processor usage

High memory paging

Heavy disk usage

Inconsistent memory usage or memory leaks

High network bandwidth consumption or traffic queueing

Key objects for the initial assessment of a target system are the Memory, Process, Processor, Telephony, and Cisco Unity performance objects. These objects contain many of the core data points that are helpful in determining system activity. For example, when using the Telephony object, the Current Incoming Calls and Current Outgoing Calls counters describe the call activity into and out of the Cisco Unity server, and thus are a good indication of average voice session traffic.

To obtain information such as call duration, call forwarding, and phone system transfers into Cisco Unity, use the Port Usage Analyzer tool (available in Tools Depot), as well as external sources of information such as phone system reports or call detail records. This data can be used in conjunction with the data collected from the Cisco Unity system to form a complete picture of phone system activity during the monitored period.

At a minimum, the following phone system information should be collected:

Average Call Duration or Average Hold Time

Average Length of a recorded message to a Cisco Unity subscriber

Statistics showing the distribution of call types coming into the Cisco Unity server (for example, Direct Call, Call Forward-Ring No Answer, Call Forward-Busy)

Session traffic into the system from web clients should also be collected. This information can be obtained through the use of the Web Services object, which allows you to track Cisco Unity Assistant, Cisco Unity Administrator, and Cisco Unity Inbox logons and connections.

Developing a Corrective Action Plan

Using your analysis of the collected data, determine which areas you can focus on for performance improvements. Cisco Unity best practices can also be a source for a corrective action plan.

Administrative Best Practices for Cisco Unity Performance

Following these best practices will have a positive affect on Cisco Unity performance.

Do not run extraneous servers or applications on the Cisco Unity server.

Set processes for background processing.

Do not implement real-time virus scanning on the message store. Conduct scanning at the connection points to the messaging environment.

Unified Messaging subscribers should not have Inboxes that exceed 100 MB or 1,000 messages. Because the processing of messages happens in real-time when the users log on to check their messages, mailbox size directly affects Cisco Unity conversation performance. Keep in mind that because certain types of message can be very large, subscribers who have relatively few messages stored in their mailboxes may still find that their mailboxes exceed the storage limits.

Do not set a mailbox size limit for the Unity<servername> mailbox. Note that this mailbox should never have any messages in it; however, in a situation where Exchange is mis-configured and this mailbox has a limited size, it can quickly fill up and severely affect Cisco Unity performance.

Best Practices Specific to Cisco Unity with Microsoft Exchange

In addition to the best practice recommendations above, note the following best practices related to MAPI serial interaction, when using Cisco Unity with Microsoft Exchange.

Cisco Unity uses one session for all MAPI communication with each Exchange server. The MAPI communication process operates in a serial/sequential manner. When a MAPI request is made to an Exchange server, Cisco Unity waits for the response. While waiting, no new MAPI requests can be made to that server. During the wait, new MAPI requests are queued until the original MAPI request is returned or until it times out (the time out period is more than 10 minutes.) The following conditions have been observed to cause delay, and should be avoided or resolved as soon as possible if they occur:

Log stalls. Log stalls occur when the load on an Exchange message store creates transaction logs more quickly than they can be written to the disk. Because transaction logs are critical, Exchange will halt until the logs have been written to the disk. (Refer to the Microsoft support article 188676 for details.)

User dump of Store.exe. A user dump of the Store.exe process will halt all MAPI I/O until it has completed. A user dump of the Store.exe process is a rare practice used to debug Exchange. During this time the Exchange server appears to be available to Cisco Unity.

Latency. Latency is defined as the time it takes for data to travel across the network between Cisco Unity and an Exchange server.

Insufficient throughput. This condition occurs when the amount of throughput required for communication between Cisco Unity and an Exchange server exceeds what is available. When insufficient throughput occurs, the TCP/IP back-off algorithm reduces the transmission speed until a reliable throughput is achieved.

Packet loss. Packet loss is when data is lost, destroyed, or corrupted in transit between Cisco Unity and an Exchange server. When this condition occurs, the data must be retransmitted.

Modifying the System to Implement the Corrective Action Plan

Make modifications as necessary to implement the performance improvement decisions that you have made, based on analysis of collected performance data.

Resolving Identified Issues

Run the performance tests again to determine whether the corrective action plan that you implemented improved performance, resolved identified performance issues, and did not introduce any new performance issues.

Completing the Test Cycle

Document your findings, the corrective action you have taken, and the results of the repeat performance tests.

Performance Counters

To monitor physical disk performance information, it is necessary to enable the disk performance counters on the server. With Windows 2000, the physical disk performance counters are enabled by default. In Cisco Unity version 4.0(3) and later, the performance counters for measuring Cisco Unity data points are also enabled by default.

Required System Performance Counters

The counters in Table 7-1 should be collected from any Cisco Unity server or Cisco Unity message store performance monitoring session

Table 7-1 Required System Performance Counters 

Required System Performance Counters

\Cache\Data Map Hits%

\Memory\Available Bytes

\Memory\Commit Limit

\Memory\Committed Bytes

\Memory\Free System Page Table Entries

\Memory\Page Faults/sec

\Memory\Pages Input/sec

\Memory\Pages Output/sec

\Memory\Pages/sec

\Network Interface(*)\Bytes Received/sec

\Network Interface(*)\Bytes Sent/sec

\Paging File(_Total)\% Usage Peak

\PhysicalDisk(_Total)\% Disk Time

\PhysicalDisk(_Total)\Avg. Disk Bytes/Transfer

\PhysicalDisk(_Total)\Avg. Disk Queue Length

\PhysicalDisk(_Total)\Avg. Disk sec/Read

\PhysicalDisk(_Total)\Avg. Disk sec/Write

\PhysicalDisk(_Total)\Current Disk Queue Length

\PhysicalDisk(_Total)\Disk Reads/sec

\PhysicalDisk(_Total)\Disk Writes/sec

\System\Processes

\System\Processor Queue Length

\System\System Calls/sec

\System\Threads

\Processor(_Total)\% Interrupt Time

\Processor(_Total)\% Processor Time

\Processor(_Total)\Interrupts/sec

\Processor(_Total)\% Privileged Time

\Processor(_Total)\% User Time

\PhysicalDisk(_Total)\% Idle Time


General System Performance Counters

Table 7-2 shows counters that are applicable to both the Cisco Unity server and the Cisco Unity message store, including their recommended safe values.

Table 7-2 General System Performance Counters 

Object
Counter
Description
Recommended Value

Memory

Available Bytes

Available Bytes is the amount of physical memory available to processes that are running on the computer. It is calculated by summing space on the Zeroed, Free, and Standby memory lists:

Zeroed memory is pages of memory filled with zeros to prevent later processes from seeing data used by a previous process.

Free memory is ready for use.

Standby memory is memory removed from a process working set (its physical memory) on route to disk, but is still available to be recalled. Standby memory is the last observed value only; it is not an average.

The recommended value for Available Bytes is a reflection of the amount of available memory and the type of activities required of the system. For Unified Messaging, a system that consistently has approximately one-eighth of its total physical memory available would be a candidate for further memory troubleshooting, and potentially a memory upgrade. If the available bytes are as low as 4 MB, there is a memory issue and performance may begin to suffer. If the available bytes are as low as 1 MB, server performance will be degraded.

Memory

Free System Page Table Entries

Free System Page Table Entries (PTE) is the number of page table entries that are used to map each virtual address into a corresponding physical address and are not being used by the system. This counter displays the last observed value only. It is not an average. The PTE pool size is automatically determined at system startup. As the PTE pool decreases, other parts of the system will degrade, resulting in threads not being created, system stalls, and other system failures.

To maintain a stable system, the amount of free PTEs on the Cisco Unity server should be greater than or equal to 15,000.

Memory

Page Faults/sec

Page Faults/sec is the overall rate at which faulted pages are handled by the processor. It is measured in numbers of pages faulted per second. A page fault occurs when a process requires code or data that is not in the working set (space in physical memory). This counter includes both hard faults (those that require disk access) and soft faults (where the faulted page is found elsewhere in physical memory). This counter displays the difference between the values observed in the last two samples, divided by the duration of the sample interval.

The identification of a memory bottleneck can be derived by considering this value in relation to the number of Pages Input/sec or Pages Output/sec. Soft faults do not necessarily indicate a memory shortage problem, just that the system is highly active. Hard faults, on the other hand, indicate that there is not enough physical memory to attend to the process tasks that need to be accomplished, and that memory pages are increasingly being moved to and from the physical disk for persistence. Invariably, a memory issue of this type will show a corresponding increase in activity of the physical disks that home the paging files. To calculate Hard Page Faults as a percentage of faults occurring on the system, divide the Page Inputs/sec by the Page Faults/sec.

Memory

Pages Input/sec

Pages Input/sec is the number of pages read from disk to resolve hard page faults. (Hard page faults occur when a process requires code or data that is not in its working set or elsewhere in physical memory, and must be retrieved from disk). This counter was designed as a primary indicator of the kinds of faults that cause system-wide delays. It includes pages retrieved to satisfy faults in the file system cache (usually requested by applications) and in non-cached mapped memory files. This counter counts numbers of pages, and can be compared to other counts of pages, such as Page Faults/sec, without conversion. This counter displays the difference between the values observed in the last two samples, divided by the duration of the sample interval.

Because the value of this counter indicates the count of pages that are needed from the physical disk to satisfy virtual memory requests for pages that are not in physical memory (hard page faults), the lower this value is, the better.

Memory

Pages Output/sec

Pages Output/sec is the number of pages written to disk to free up space in physical memory. Pages are written to disk only if they are changed in physical memory, so they are likely to hold data, not code. Windows NT writes more pages back to disk to free up space when physical memory is in short supply. This counter counts numbers of pages, and can be compared to other counts of pages, without conversion. This counter displays the difference between the values observed in the last two samples, divided by the duration of the sample interval.

This counter is useful for tracking memory paging activity that might indicate movement of pages out to physical disk. A high rate of pages output might indicate a memory shortage.

Memory

Pages/sec

The value of this counter indicates the physical disk paging activity to satisfy virtual memory requests for pages that are not in physical memory.

This counter is a primary indicator of the kinds of faults that cause system-wide delays. The lower this value is, the better. It should average less than 10 pages per second.

Network Interface

Bytes Received/ sec

Bytes Received/sec is the rate at which bytes are received on the interface, including framing characters.

This value should not exceed 20 percent of the available bandwidth on the network interface.

Network Interface

Bytes Sent/sec

Bytes Sent/sec is the rate at which bytes are sent on the interface, including framing characters.

This value should not exceed 50 percent of the available bandwidth on the network interface.

Processor

% Processor Time

% Processor Time is the percentage of time that the processor is executing a non-Idle thread. This counter was designed as a primary indicator of processor activity. It is calculated by measuring the time that the processor spends executing the thread of the Idle process in each sample interval, and subtracting that value from 100 percent. (Each processor has an Idle thread that consumes cycles when no other threads are ready to run). It can be viewed as the percentage of the sample interval spent doing useful work. This counter displays the average percentage of busy time observed during the sample interval. It is calculated by monitoring the time the service was inactive, and then subtracting that value from 100 percent.

High activity per processor does not immediately indicate a processor bottleneck. If the value consistently stays at or near 100 percent, then there is likely a processor bottleneck. For a Cisco Unity server with on-box Exchange, this value is ideally at or below 75 to 80 percent. When the message store is off-box, this value is considered within operating norms if it is below 85 percent.

System

Processor Queue Length

Processor Queue Length is the number of threads in the processor queue. There is a single queue for processor time even on computers with multiple processors. Unlike the disk counters, this counter counts ready threads only, not threads that are running. This counter displays the last observed value only; it is not an average.

Depending on the number of processors on a system, this value is generally considered a bottleneck if the value exceeds two times the number of processors. This value should be viewed in conjunction with % Processor Time to get a good view of the processor activity on the system.


Cisco Unity Server Performance Counters

Table 7-3 shows important Cisco Unity server counters and their recommended safe values.

Table 7-3 Cisco Unity Server Performance Counters 

Object
Counter
Description
Recommended Value

Cisco Unity Sessions (Voice)

Delay - Opening Greeting

Delay Opening Greeting is the delay (in tenths of a second) experienced by a caller before any audio is heard. It measures the time from receipt of the call by the system to the beginning of the audio stream to the caller.

This is a subjective value, but if this value is greater than 40 (4 seconds), further investigation should be conducted to determine the cause of the delay.

Cisco Unity Sessions (Voice)

Delay - Get Header

Delay Get Header is the delay (in tenths of a second) experienced by a caller while Cisco Unity gathers message header information.

This is a subjective value, but if this value is greater than 40 (4 seconds), further investigation should be conducted to determine the cause of the delay.

Cisco Unity Sessions (Voice)

Delay - Subscriber Delete Message

Delay Subscriber Delete Message is the delay (in tenths of a second) experienced by a Cisco Unity subscriber when attempting to delete a message. It measures the time from the final delete message prompt to confirmation of the deletion.

This is a subjective value, but if this value is greater than 40 (4 seconds), further investigation should be conducted to determine the cause of the delay.

Cisco Unity Sessions (Voice)

Delay - Subscriber Logon

Delay Subscriber Logon is the delay (in tenths of a second) experienced by a Cisco Unity subscriber during logon. It measures the time from the final keypress of the subscriber password to the first menu prompt.

This is a subjective value, but if this value is greater than 40 (4 seconds), further investigation should be conducted to determine the cause of the delay.

Cisco Unity Sessions (Voice)

Delay - Subscriber Message Access

Delay Subscriber Message Access is the delay (in tenths of a second) experienced by a Cisco Unity subscriber when attempting to access a message. It measures the time from the subscriber key press to listen to a message to the actual playback of the message.

This is a subjective value, but if this value is greater than 40 (4 seconds), further investigation should be conducted to determine the cause of the delay.

Cisco Unity Sessions (Voice)

Delay - Subscriber Record Message

Delay Subscriber Record Message is the delay (in tenths of a second) experienced by a Cisco Unity subscriber when attempting to record a message. It measures the time from the final record message prompt to the record beep.

This is a subjective value, but if this value is greater than 40 (4 seconds), further investigation should be conducted to determine the cause of the delay.

Process\ [Cisco Unity Process]

Private Bytes

Private Bytes is the current number of bytes that are allocated by each Cisco Unity process and cannot be shared with other processes.

The value for this counter can vary dramatically, but the important thing to note is whether private bytes are continually being used and not released (a situation that is commonly known as a memory leak).

For example, memory usage over the course of the first day that a Cisco Unity system is in use may initially suggest that there is a memory leak, because components are loaded when needed. However, memory usage should then level off to be consistent over time.

Process\ AvCsMgr

% Processor Time

The Manager (AvCsMgr) is the core voice processing system that manages all other Cisco Unity components, provides status on the state of the components, and exposes interfaces to other internal and external components.

The % Processor Time value should not exceed an average of 60 percent. If it does, activity may be greater than the system is capable of handling.

Process\ AvCsGateway

% Processor Time

The Gateway (AvCsGateway) process provides a secure interface to the Manager that allows external processes to query the state of the Manager, start or stop the Manager, or request internal interfaces to Manager components (if allowed).

The % Processor Time value should not exceed an average of 25 percent. If it does, activity may be greater than the system is capable of handling.

Process\ AvCsMgr

Handle Count

The AvCsMgr Handle Count is the total number of handles currently in use by the Manager process. This number is the sum of the handles currently open by each thread in this process.

After an initial build up, the handles in use should remain constant. The maximum value should not exceed 25,000 handles.

Process\ AvCsMgr

Virtual Bytes

Virtual Bytes is the current size in bytes of the virtual address space in use by the Manager process. Virtual space is finite, and therefore if too much is used, the process can limit its ability to load libraries.

After an initial build up, virtual bytes should remain fairly constant. On Microsoft Windows 2000 Server systems, the maximum value should not exceed 1.65 GB. On Microsoft Windows 2000 Advanced Server systems using the /3GB switch, the maximum value should not exceed 2.4 GB.

Process\ inetinfo

% Processor Time

The Inetinfo process provides the interface to the Cisco Unity Administrator and the Cisco Personal Communications Assistant applications.

The % Processor Time value should not exceed an average of 25 percent. If it does, activity may be greater than the system is capable of handling.

Telephony

Current Incoming Calls

The Current Incoming Calls counter measures the call activity coming into the Cisco Unity server. Along with Current Outgoing Calls, it is a good indication of average voice session traffic.

The recommended value for Incoming Calls is a reflection of the number of available ports. Systems that consistently have all incoming ports busy may require additional ports.

Telephony

Current Outgoing Calls

The Current Outgoing calls counter is the call activity going out from the Cisco Unity server. Along with Current Incoming Calls, it is a good indication of average voice session traffic.

The recommended value for Incoming Calls is a reflection of the number of available ports. Systems that consistently have all outgoing ports busy may require additional ports.


Cisco Unity Message Store Performance Counters

Table 7-4 shows important Cisco Unity message store counters and their recommended safe values.

Table 7-4 Cisco Unity Message Store Performance Counters 

Object
Counter
Description
Recommended Value

Database

Log Record Stalls/sec

Log Record Stalls/sec is the number of log records that cannot be added to the log buffers per second because they are full.

This value should remain as close to 0 (zero) as possible. Generally, an average recorded value greater than 2 during normal operations indicates a bottleneck.

Database

Table Opens/sec

Table Opens/sec is the number of database tables opened per second.

This counter is a good indicator of overall system usage.

Physical Disk

% Disk Time

% Disk Time is the percentage of elapsed time that the selected disk drive is busy servicing read or write requests.

If this value exceeds 60 percent (on average) for sustained periods of time, an investigation into the performance of the system may be needed.

Physical Disk

Avg. Disk sec/ Read

Avg. Disk sec/Read is the average time in seconds to read data from the disk.

Any average value exceeding .02 indicates a physical disk bottleneck. Because this is a direct indicator of the length of time needed to read information from the disk, the maximum value should be noted. Spikes in this value would indicate delays reading information from the disk.

Physical Disk

Avg. Disk sec/ Write

Avg. Disk sec/Write is the average time in seconds to write data to the disk.

Any average value exceeding .02 indicates a physical disk bottleneck. Because this is a direct indicator of the length of time needed to write information to the disk, the maximum value should be noted. Spikes in this value indicate delays writing information to the disk.

Physical Disk

Current Disk Queue Length

Current Disk Queue Length is the number of requests outstanding on the disk at the time the performance data is collected. Multi-spindle disk devices can have multiple requests active at one time, while other concurrent requests are awaiting service. This counter might reflect a transitory high or low queue length, but if there is a sustained load on the disk drive, it is likely that this value will be consistently high. Requests experience delays proportional to the length of this queue minus the number of spindles on the disks.

This value should not average more than 2 to 4. Because this is a value measured at the operating system level, delays in the queue at the driver level are likely to affect performance.


Troubleshooting Performance Counters

The Cisco Unity integration performance counters may not be available after an upgrade or after a change to the phone system integration, if the upgrade or integration change was made while performance monitoring services (CUPID or PerfMon) were running.

To Re-Enable Performance Counters After an Upgrade or After a Change to the Phone System Integration


Step 1 On the Cisco Unity server, click Start > Programs > Administrative Tools > Services.

Step 2 Stop the Cisco Unity Performance Information and Diagnostics service, if it is installed on the Cisco Unity server.

Step 3 Set the Cisco Unity Performance Information and Diagnostics service Startup type to Manual.

Step 4 Click Start > Programs > Administrative Tools > Performance.

Step 5 Stop any counters or trace logs that are currently running.

Step 6 Start Regedit.


Caution Changing the wrong registry key or entering an incorrect value can cause the server to malfunction. Before you edit the registry, confirm that you know how to restore it if a problem occurs. (Refer to the "Restoring" topics in Registry Editor Help.) Note that for Cisco Unity failover, registry changes on one Cisco Unity server must be made manually on the other Cisco Unity server, because registry changes are not replicated. If you have any questions about changing registry key settings, contact Cisco TAC.

Step 7 If you do not have a current backup of the registry, click Registry > Export Registry File, and save the registry settings to a file.

Step 8 Delete the Performance Counter Variables registry key, located at

HKLM\Software\Active Voice\AvLogMgr\1.0\PerformanceCounterVariables

Step 9 Restart the Cisco Unity server.

After Cisco Unity has restarted, the Cisco Unity integration performance counters will be available, and the registry key deleted in Step 8 will be automatically re-created.