-
Cisco CallManager Serviceability System Guide, Release 4.1(2)
-
Preface
-
Introduction
-
Performance Objects and Counters
-
Cisco CallManager Services
-
Tools Overview
-
Service Activation
-
Control Center
-
Alarms
-
Trace
-
Real-Time Monitoring Tool
-
Quality Report Tool
-
Serviceability Reports Archive
-
Microsoft Performance
-
Bulk Trace Analysis
-
CDR Analysis and Reporting
-
Remote Serviceability Overview
-
Cisco Secure Telnet
-
Show Command Line Interface
-
Simple Network Management Protocol
-
CiscoWorks2000
-
Path Analysis
-
System Log Management
-
Cisco Discovery Protocol Support
-
Cisco CallManager Performance Counters, RTMT, and CISCO-CCM-MIB
-
Trace Examples
-
Performance Objects and Counters
-
Index
-
 Feedback
Table Of Contents
Understanding the Real-Time Monitoring Tool
RTMT Window Configuration Checklist
Call Process Activity Monitoring
Perfmon Counters Table View/Chart View
Understanding Perfmon Monitoring
Configure Alert Notification for Counter
Perfmon Monitoring Configuration Checklist
Where to Find More Information
Real-Time Monitoring Tool
This chapter provides information on the Real-Time Monitoring Tool (RTMT) for Cisco CallManager Serviceability and comprises the following topics:
•
Understanding the Real-Time Monitoring Tool
•
•
•
•
Understanding the Real-Time Monitoring Tool
Cisco CallManager Serviceability provides a client side standalone plugin, RTMT, that monitors real-time behavior of the components in a Cisco CallManager cluster. RTMT runs as an application and uses HTTP and TCP to monitor device status, system performance, device discovery, and CTI applications. It also connects directly to devices by using HTTP for troubleshooting system problems.
RTMT continuously monitors a set of management objects that are preconfigured and generates various alerts, in the form of e-mails, for these objects when values go over/below user-configured thresholds. RTMT then generates daily reports for these objects. See the "Monitoring Objects" section for more information about the preconfigured monitoring objects.
Note
Monitoring Objects
The RTMT arranges the preconfigured monitoring objects into four major categories:
•
•
•
•
The following sections provide more information about each category, including what objects RTMT monitors, the alert, threshold and defaults, and what kind of reports RTMT generates for each. Refer to Chapter 11, "Serviceability Reports Archive" in the Cisco CallManager Serviceability System Guide for more information on viewing the RTMT reports.
Devices Category
The Devices category monitors phones, gateways, and media devices on each Cisco CallManager and Cisco CallManager cluster. Table 9-1 provides information about the objects that RTMT monitors, the alert, thresholds, and defaults, and what kind of reports that RTMT generates for those devices.
Table 9-1 Devices Category
Number of registered phones for each Cisco CallManager and cluster.
•
Daily reports on number of registered devices. See the "Device Statistics Report" section on page 11-4 for detailed information.
Number of registered gateways on each Cisco CallManager and cluster.
•
•
Number of registered media devices on each Cisco CallManager and cluster.
•
•
•
Servers Category
The Servers category monitors CPU usage, disk space usage, and critical services on each Cisco CallManager server. Table 9-2 provides information about the objects that RTMT monitors, the alert, thresholds, and defaults, and what kind of reports that RTMT generates for those servers.
Table 9-2 Servers Category
•
•
•
•
•
•
•
Daily CPU, memory, and disk usage reports. See the "Server Statistics Report" section on page 11-8 for detailed information.
Disk space usage for all logical drives on each server.
Available disk space on the largest logical drive equals less than X%. Default specifies 10%.
State of activated critical services on each server.
Service state changed from Up->Down.
Services Category
The Services category monitors CTI Manager information for each CTI Manager, Cisco TFTP server information, directory server information, and heartbeat rate information. Table 9-3 provides information about the objects that RTMT monitors, the alert, thresholds, and defaults, and what kind of reports that RTMT generates for those services.
Table 9-3 Services Category
Number of open devices, lines, CTI connections, and active Cisco CallManager links for each CTI Manager.
N/A
Daily report on CTI and Cisco TFTP usage statistics. See the "Service Statistics Report" section on page 11-11 for detailed information.
TotalTftpRequests and TotalTftpRequestsAborted, for each Cisco TFTP server.
N/A
Connection and replication status for each Directory server.
•
•
Heartbeat rate for each Cisco CallManager, Cisco TFTP, and TCD services.
•
•
•
Call Activities Category
The Call Activities category monitors all call activity information for each Cisco CallManager node and cluster. Table 9-3 provides information about the objects that RTMT monitors, the alert, thresholds, and defaults, and what kind of reports that RTMT generates for those call activities.
Table 9-4 Call Activities Category
CallsAttempted, CallsCompleted, and CallsInProgress for each Cisco CallManager node and cluster.
N/A
Daily report on Cisco CallManager call activites. See the "Call Activities Report" section on page 11-15 for more detailed information.
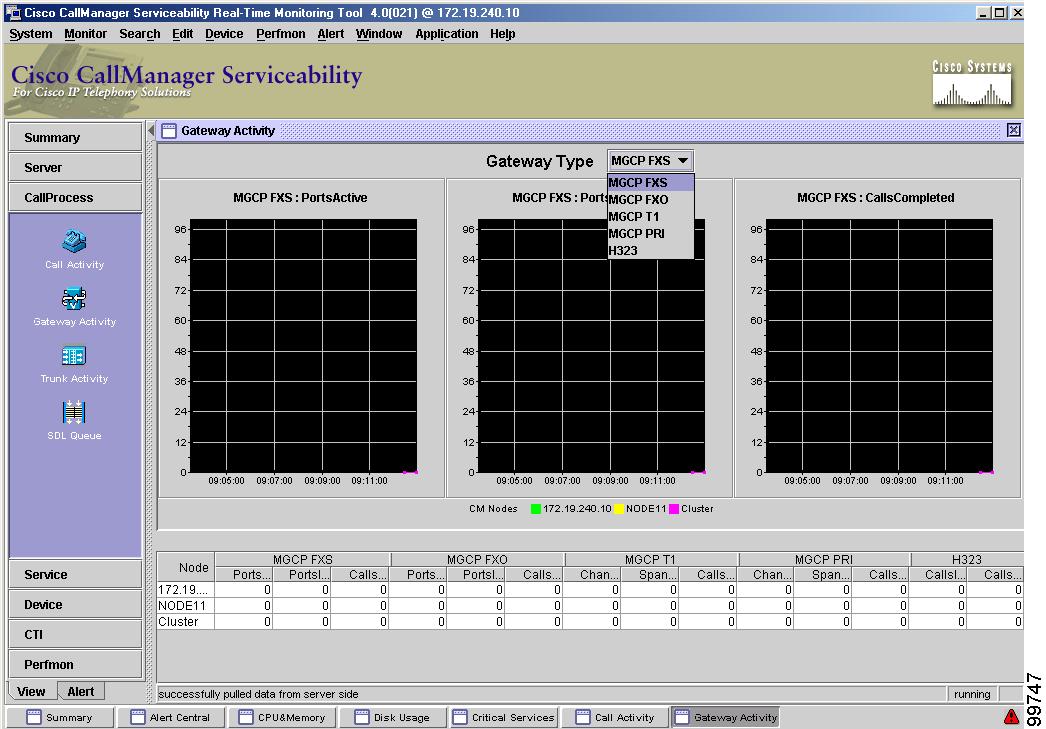
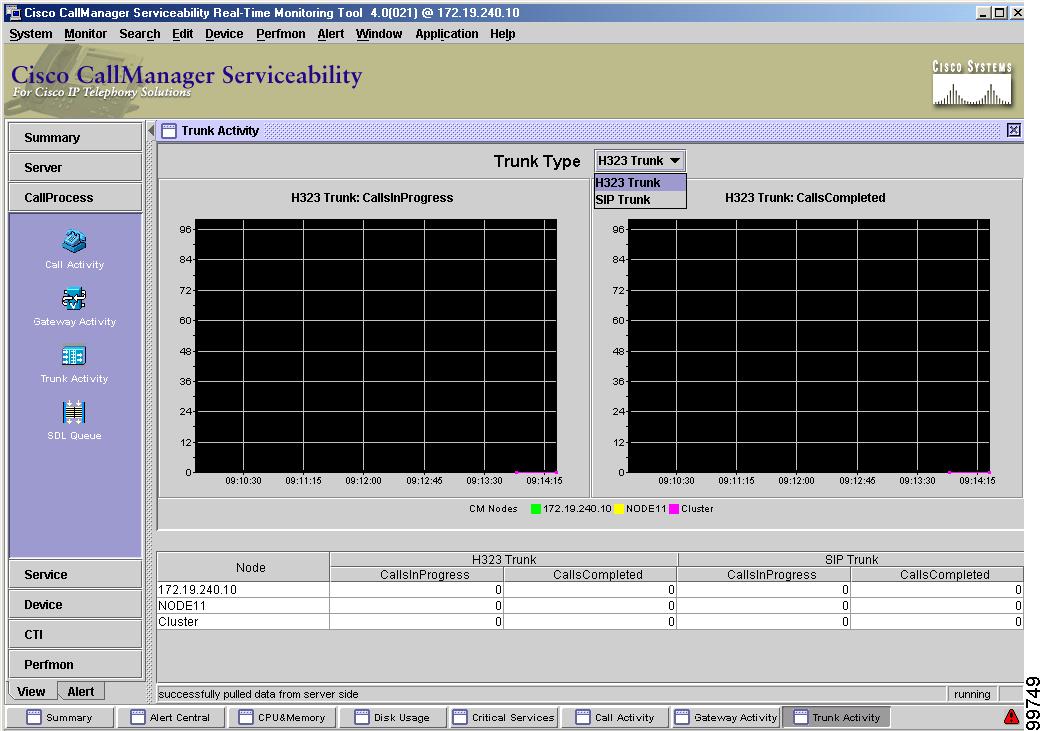
CallsAttempted, CallsCompleted, and CallsInProgress of each type of MGCP FXS/FXO/PRI/T1CAS/H.323 gateway, as well as SIP and H.323 Trunks for each Cisco CallManager node and cluster.
N/A
Channel/Port Status of each MGCP FXS/FXO/PRI/T1CAS gateway.
N/A
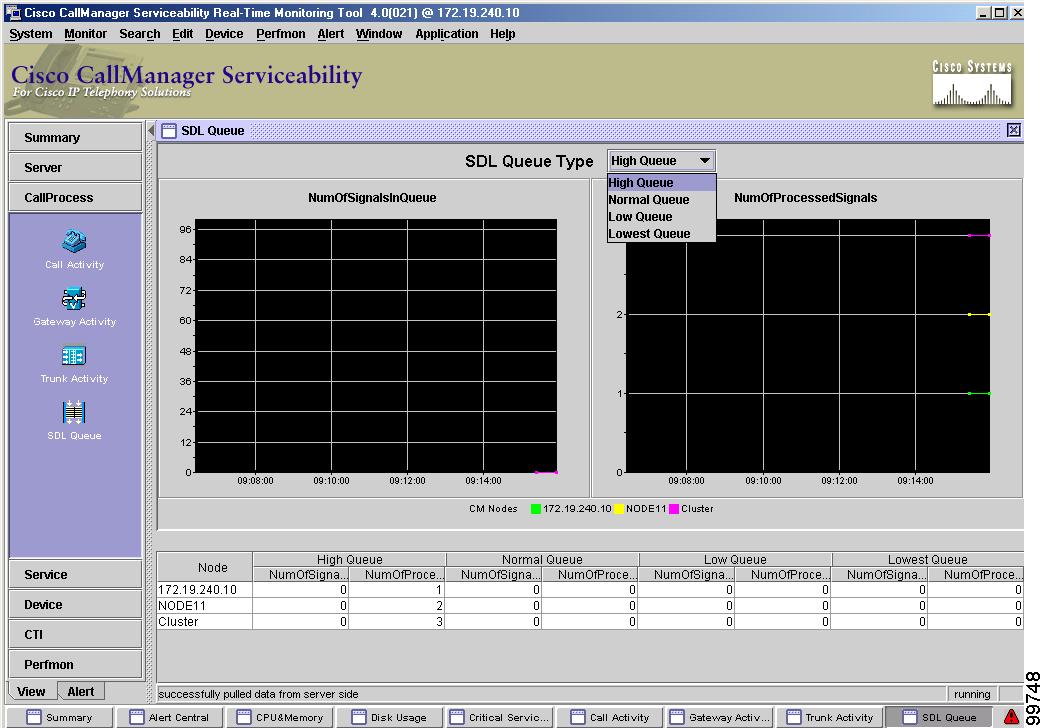
SDL Queue activity on each Cisco CallManager node.
N/A
MGCP FXS Gateway - Number of In-Service and Active ports for each Cisco CallManager node and cluster.
•
MGCP FXO Gateway - number of In-Service and Active ports for each Cisco CallManager node and cluster.
•
MGCP PRI Gateway - Number of In-Service and Active channels for each Cisco CallManager node and cluster.
•
•
MGCP T1CAS Gateway - number of In-Service and Active ports for each Cisco CallManager node and cluster.
•
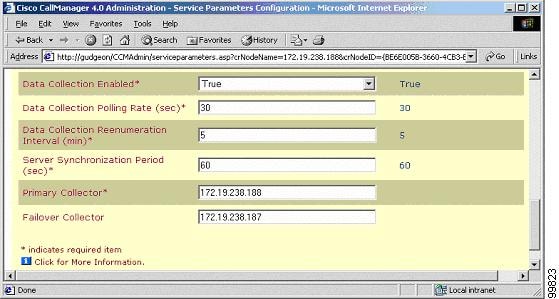
RTMT Service Parameters
The following list comprises the service parameters that are associated with RTMT:
•
•
•
•
•
•
For more information about service parameter configuration, refer to the Cisco CallManager Administration Guide.
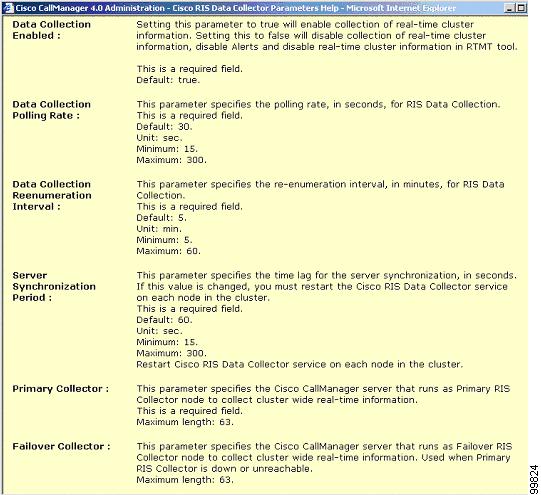
Figure 9-1 and Figure 9-2 show examples of the RTMT service parameters in the Cisco CallManager Administration web pages.
Figure 9-1 Service Parameter Configuration Window
Figure 9-2 Service Parameter Descriptions Window
RTMT Logon
You will find that RTMT is available as a download from the Cisco CallManager Install Plugins web page. When you are ready to download RTMT, you can click on Cisco CallManager Serviceability Real-Time Monitoring Tool from the Tools menu in Cisco CallManager Serviceability Administration.
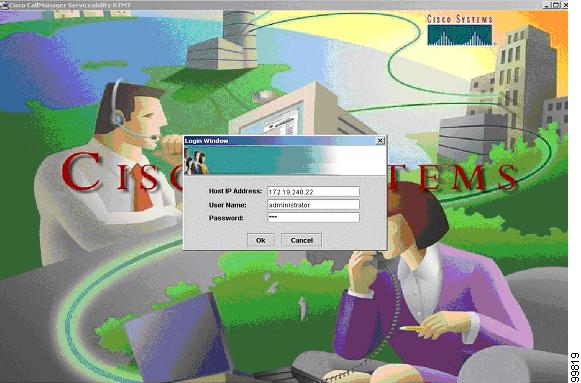
When you launch RTMT from the desktop icon, or from Start > Programs > Cisco CallManager Serviceability > RTMT, a window displays as shown in Figure 9-3.
Figure 9-3 RTMT Launch Window
To connect to a Cisco CallManager node (any node in the Cisco CallManager cluster) you must enter the user authentication information in the User Name and Password fields. The Host IP Address field can be either digital IP address or host name.
If the authentication fails or if the server is not reachable, you will be prompted to reenter the server and authentication details, or you can click the Cancel button to exit the application. If the authentication succeeds, RTMT launches the monitoring module either from local cache or from a remote node when the local cache does not contain a monitoring module that matches the backend version.
After you enter the authentication information, the RTMT window opens and displays with the default configuration. See the "RTMT Default Configuration" section.
RTMT Window Overview
See the following sections for some general information about the RTMT window:
Figure 9-4 shows the RTMT main window.
Figure 9-4 Real-Time Monitoring Tool Window
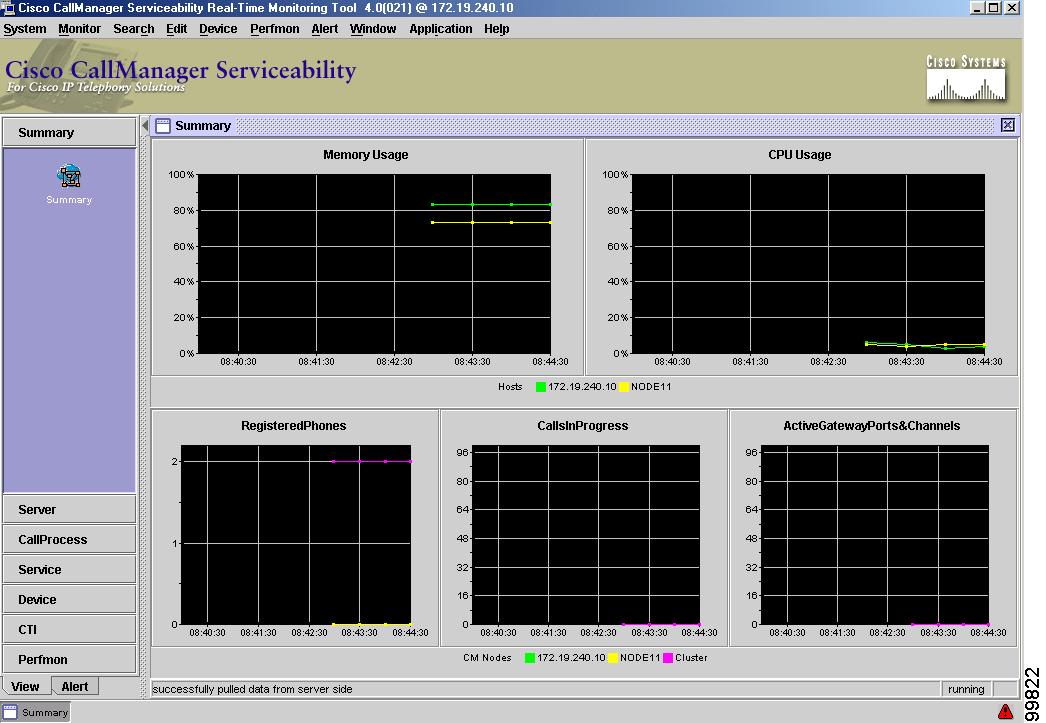
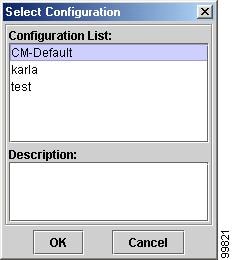
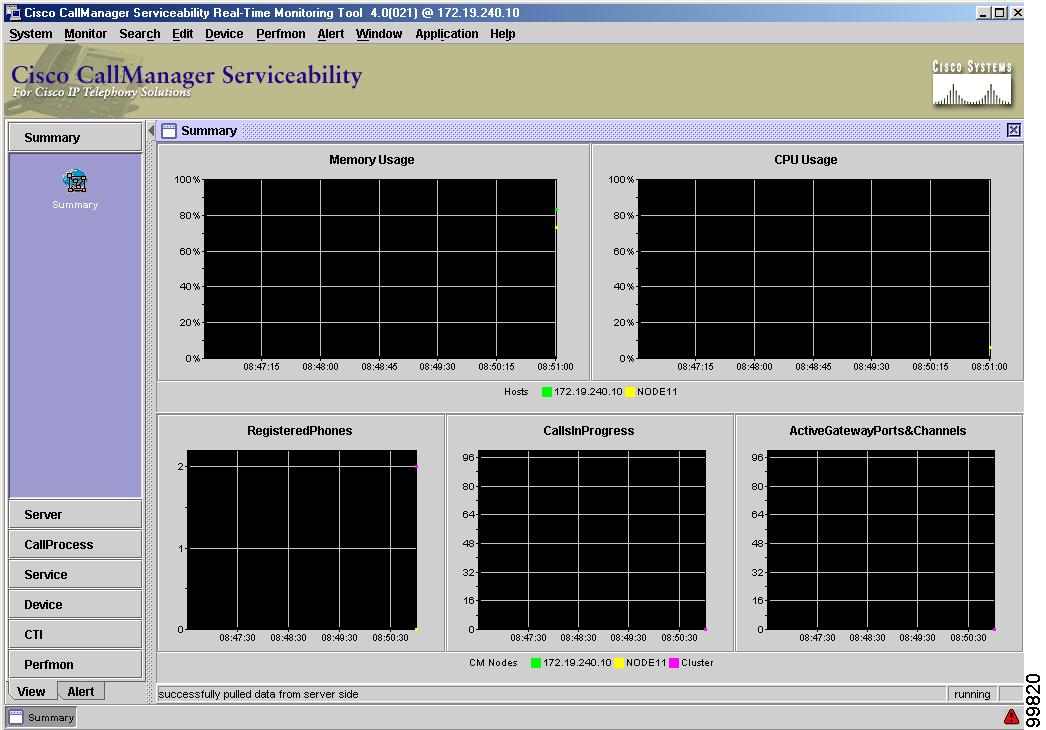
RTMT Default Configuration
When you initially load RTMT, the load includes a default configuration that is called CM-Default. Dynamically created, CM-Default monitors all registered phones in all the Cisco CallManager nodes. If your cluster has five configured Cisco CallManager nodes, CM-Default displays all the registered phones for each node in a Cisco CallManager cluster, as well as calls in progress and active gateway ports and channels. See Figure 9-5 and Figure 9-6 for CM-Default examples.
Figure 9-5 RTMT Window with CM-Default Dialog Box
Figure 9-6 RTMT Screen with CM-Default Configuration
You can save, restore, and delete Cisco CallManager configuration information by using Profile in the System menu. See the "RTMT Window Components" section.
RTMT Window Configuration Checklist
Table 9-5 provides an overview of the steps for configuring the RTMT window.
Table 9-5 RTMT Window Configuration Checklist
Step 1
Load RTMT.
Loading Real-Time Monitoring, Cisco CallManager Serviceability Administration Guide
Step 2
View existing configuration preferences.
RTMT Default Configuration, Cisco CallManager Serviceability Administration Guide
Step 3
Change to another configuration setting.
Creating Configuration Profiles, Cisco CallManager Serviceability Administration Guide
RTMT Window Components
The RTMT window comprises two main components: the Menu Bar and the Monitor Window. You can access several different monitoring functions by using both and/or either of these components.
See the "Menu Bar" section and the "Monitor Window" section for information about the menu bar and monitor window functions.
Menu Bar
The RTMT menu bar comprises several menu items that you can use to access different monitoring components. See the following sections for information about RTMT menu bar items:
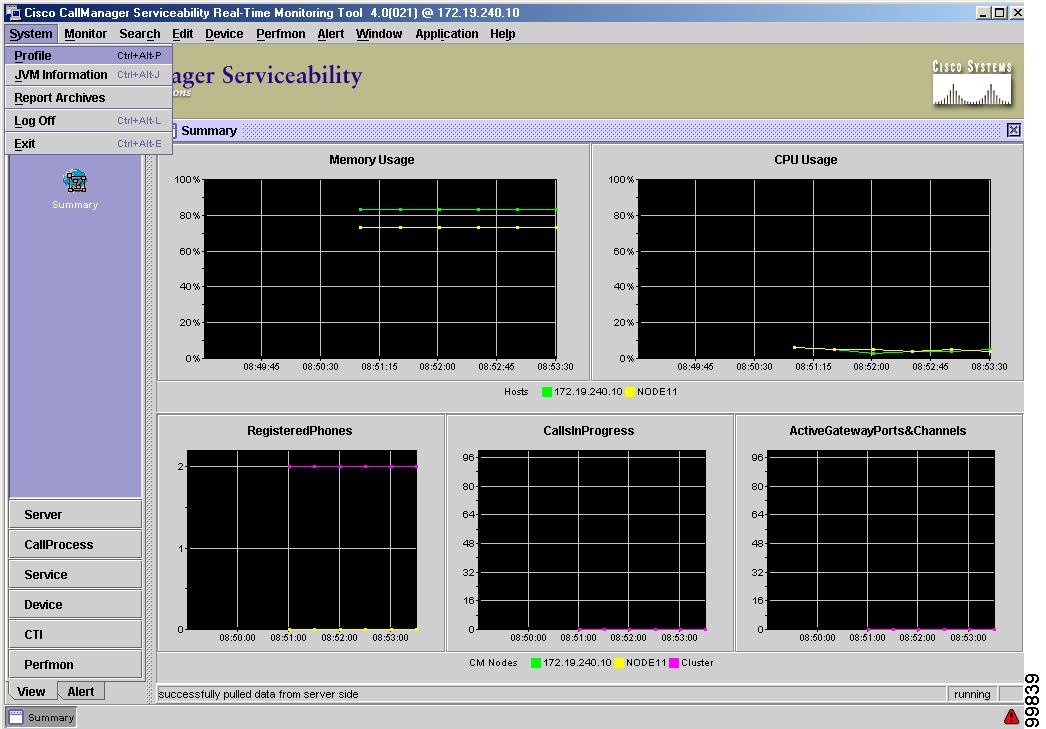
System Menu
The System menu provides access to applicationwide functionality, such as Profile and logout.
Figure 9-7 shows a System menu example.
Figure 9-7 System Menu
The System menu includes the following menu items:
•
•
•
•
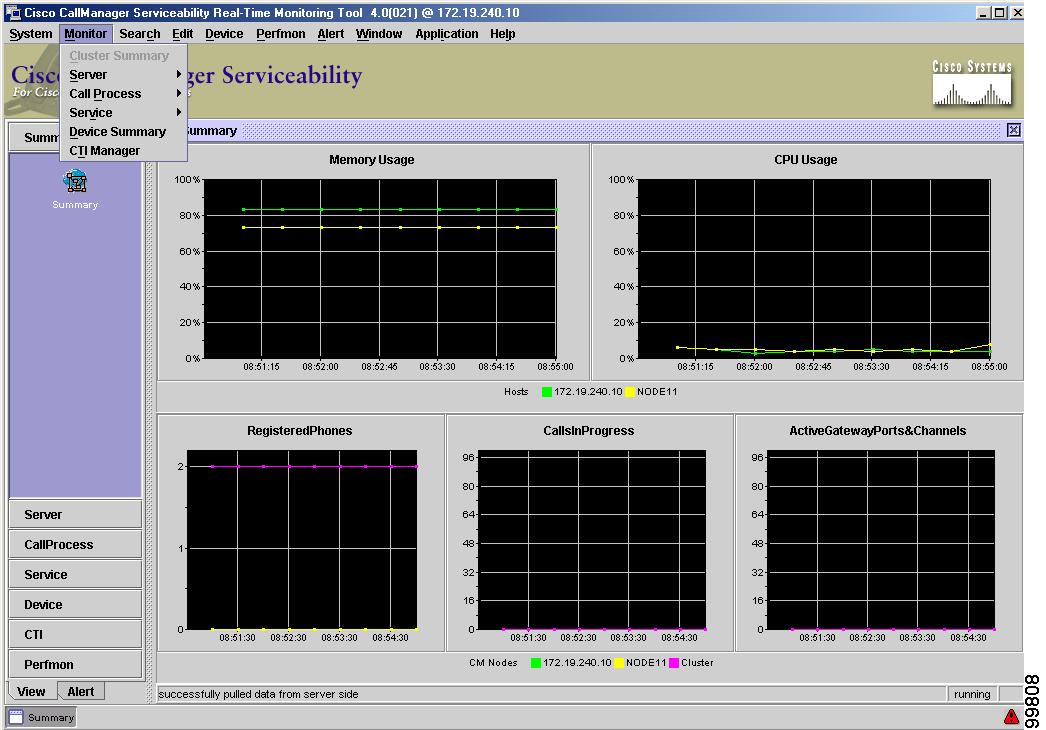
Monitor Menu
The Monitor menu provides access capability to precanned (preconfigured) items in the menu system. It includes the following categories:
•
•
•
•
•
•
Tip
Figure 9-8 shows a Monitor menu example.
Figure 9-8 Monitor Menu
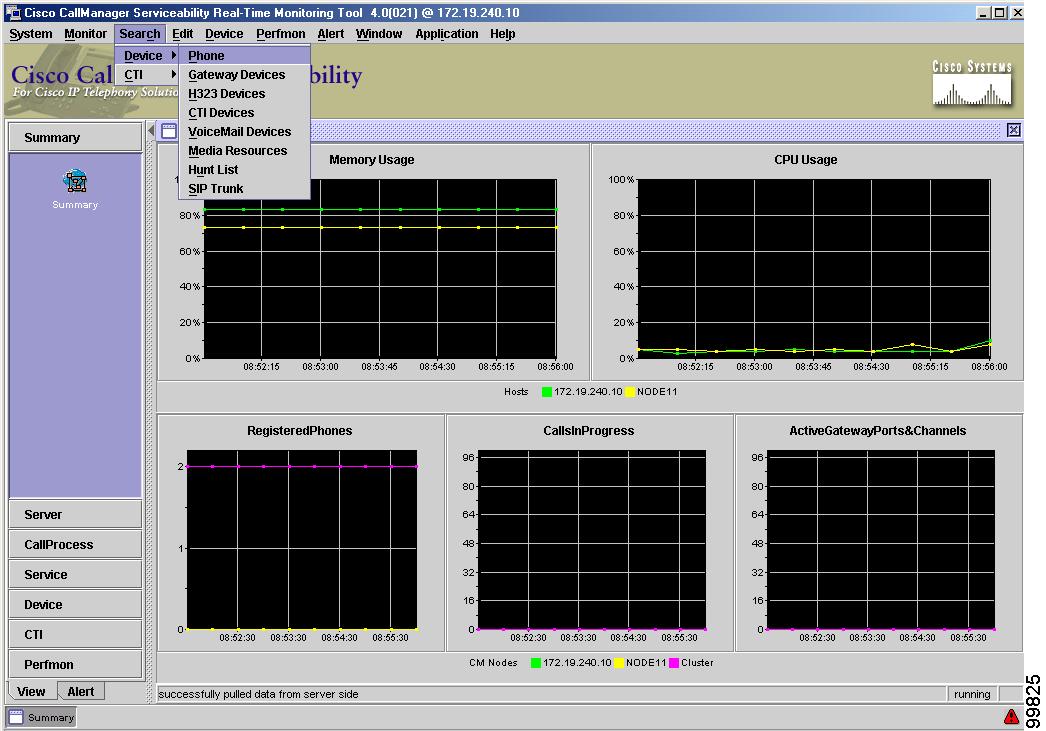
Search Menu
This menu provides device-based and CTI-based search functionality. Using the Search menu, you can search for any and all devices within a Cisco CallManager, as well as the CTI applications, lines, and devices per each CTI Manager. See the "Device Search" section, and the "CTI Search" section for more information.
Figure 9-9 shows a Search menu example.
Figure 9-9 Search Menu
Device Search
The Device search menu comprises the following menu items on which you can search:
•
•
•
•
•
•
•
•
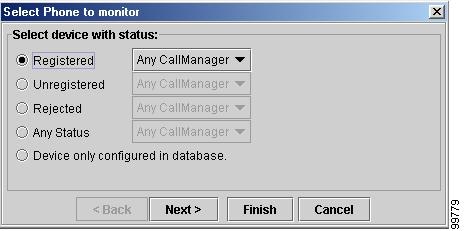
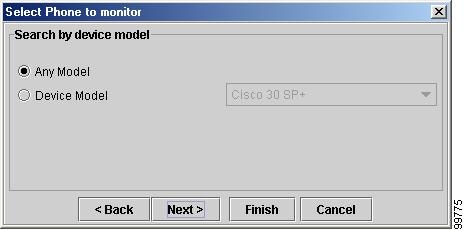
Within these menu items, you can search on the basis of any device in the Cisco CallManager cluster and choose the status of the devices, including registered, unregistered, rejected, any status, and devices that are only configured in the database. You can also search by any model, or a specific device model and set up criteria that include several different attributes.
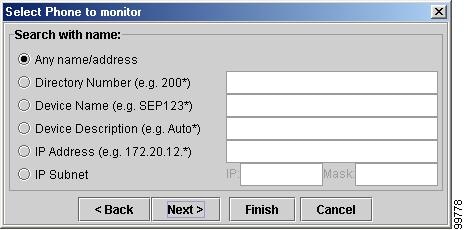
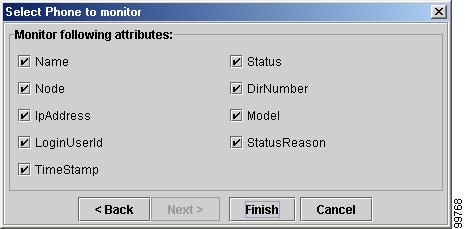
You can monitor chosen devices on the basis of the criteria that you specify for that device. You can search by the status of the device, device name, and application pattern. See Figure 9-10 through Figure 9-13 for examples of these monitoring criteria windows, where the device being searched is a phone.
Figure 9-10 Search with Device Status Window
Figure 9-11 Search with Device Model Window
Figure 9-12 Search with Device Name Window
Figure 9-13 Search with Device Attributes Window
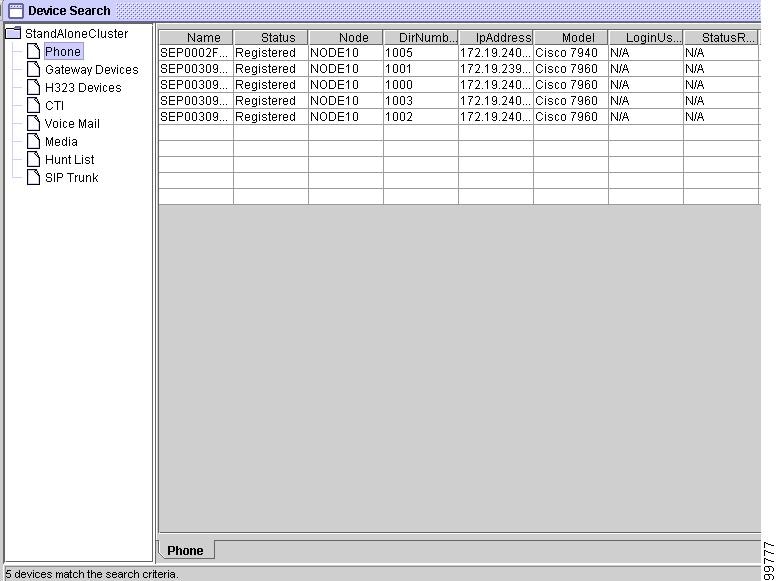
RTMT queries RIS to find the matching device. Results display in a table with a row for each matched device, a column for each of the specified attributes, and a time stamp of the device that has been opened/closed and the application that controls the device media. See Figure 9-14 for a search results example.
Figure 9-14 Device Search Results
CTI Search
The CTI search menu allows you to search on the following CTI components:
•
•
•
Using the CTI Search menu, you can search chosen CTI components on the basis of the criteria that you specify. You can also choose any or all the CTI Managers on which you want to search.
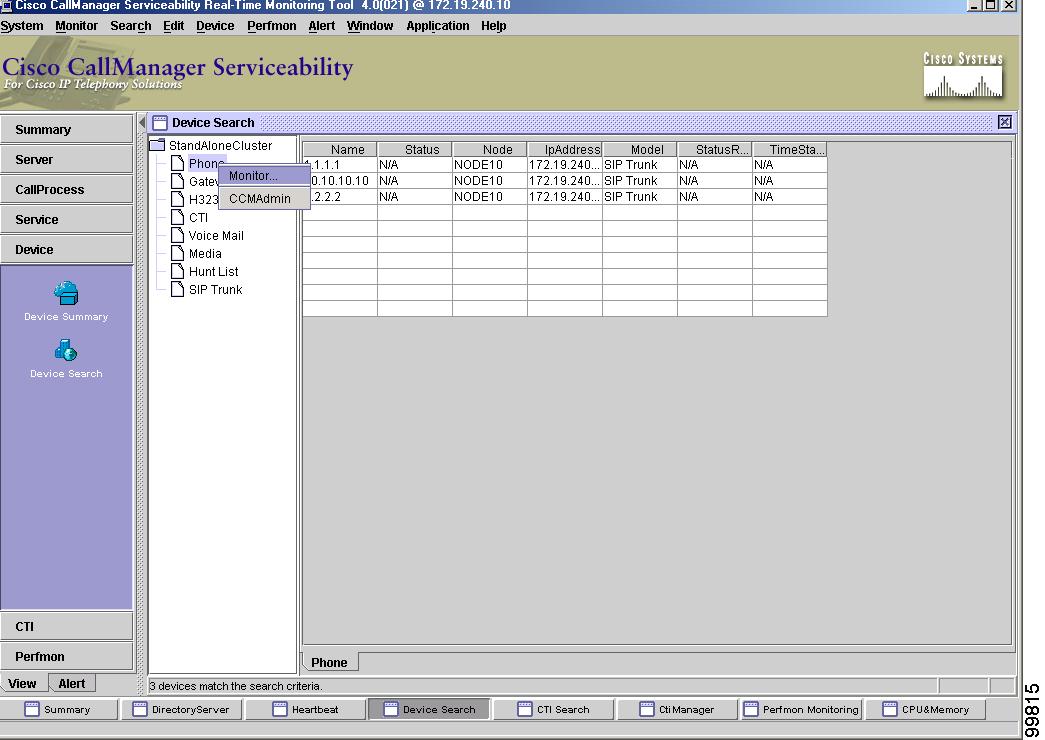
You can specify criteria for the CTI applications, devices, and lines that include CTI status, device name, application pattern, and attributes. After you set up your search criteria, RTMT queries the RIS for matched CTI applications, devices, or lines. The results display in a table with a row for each matched application and a column for each attribute; a Time Stamp of provider opened/closed status also displays.
Note
Figure 9-15 Right-click Popup Menu Example
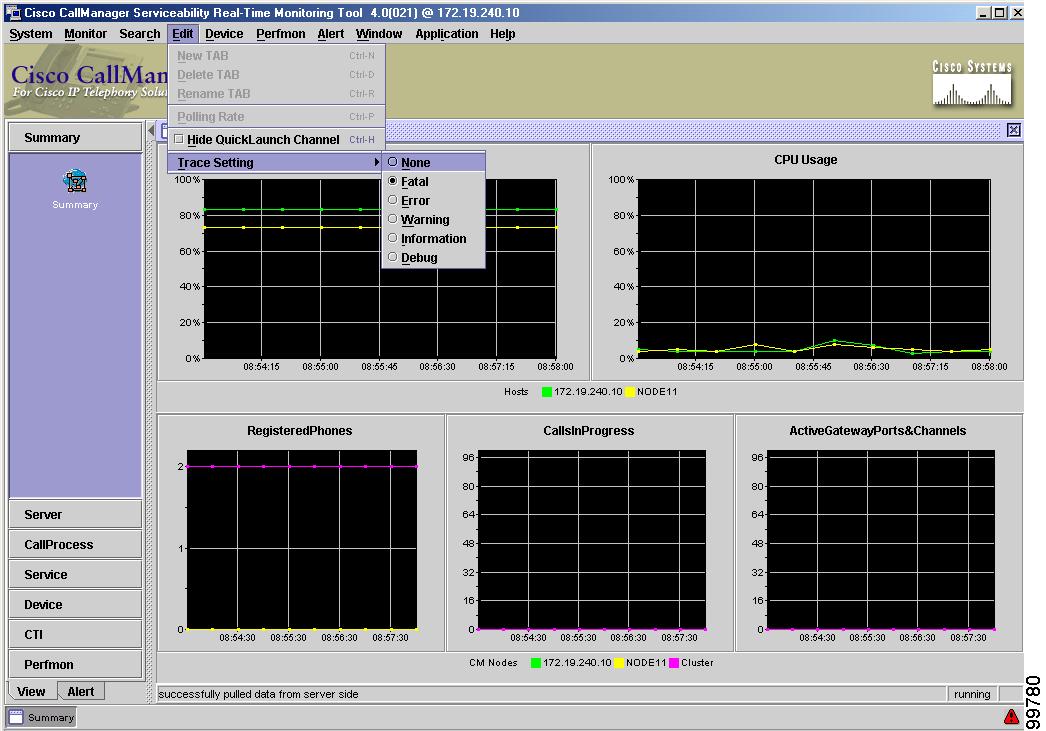
Edit Menu
Use this menu to specify context-sensitive edit actions that are also available in right-click popup menus. You can also use the "Trace Setting" item in the menu to trace and debug the RTMT application.
The Edit menu comprises the following menu items:
•
•
•
•
Note
•
•
–
–
–
–
–
–
Figure 9-16 shows an Edit menu example.
Figure 9-16 Edit Menu
Refer to "Real-Time Monitoring Tool," in the Cisco CallManager Serviceability Administration Guide for procedural information about the menu items in the Edit menu.
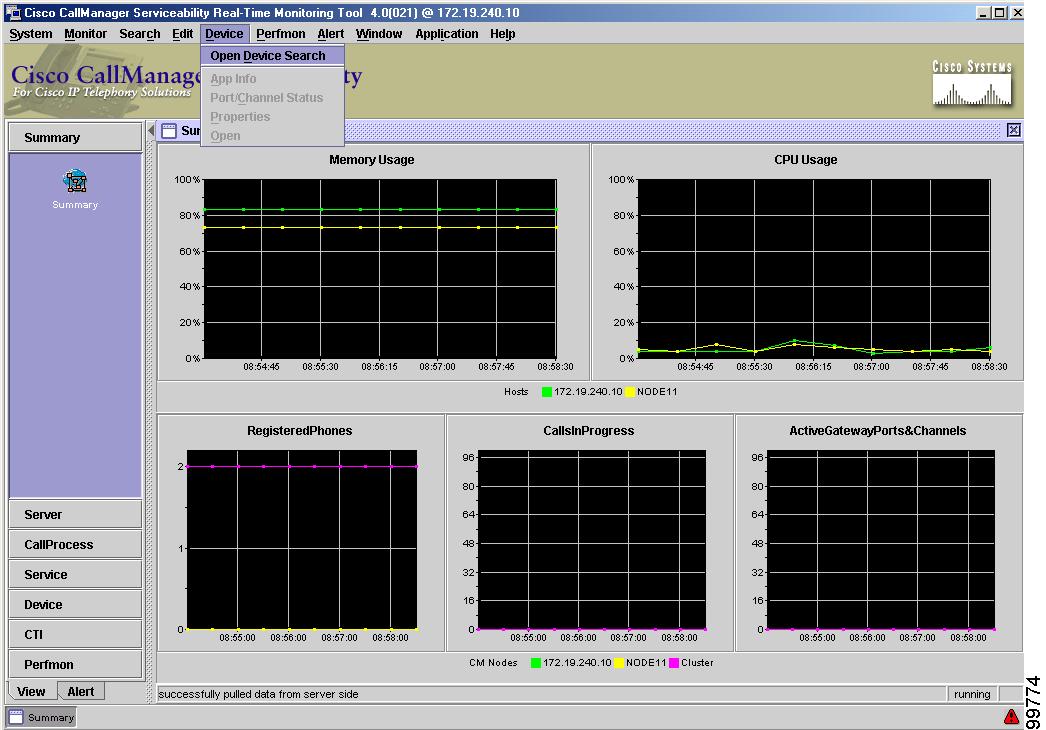
Device Menu
The Device menu provides the following device-related menu items:
•
•
•
•
•
Figure 9-17 shows a Device menu example.
Figure 9-17 Device Menu
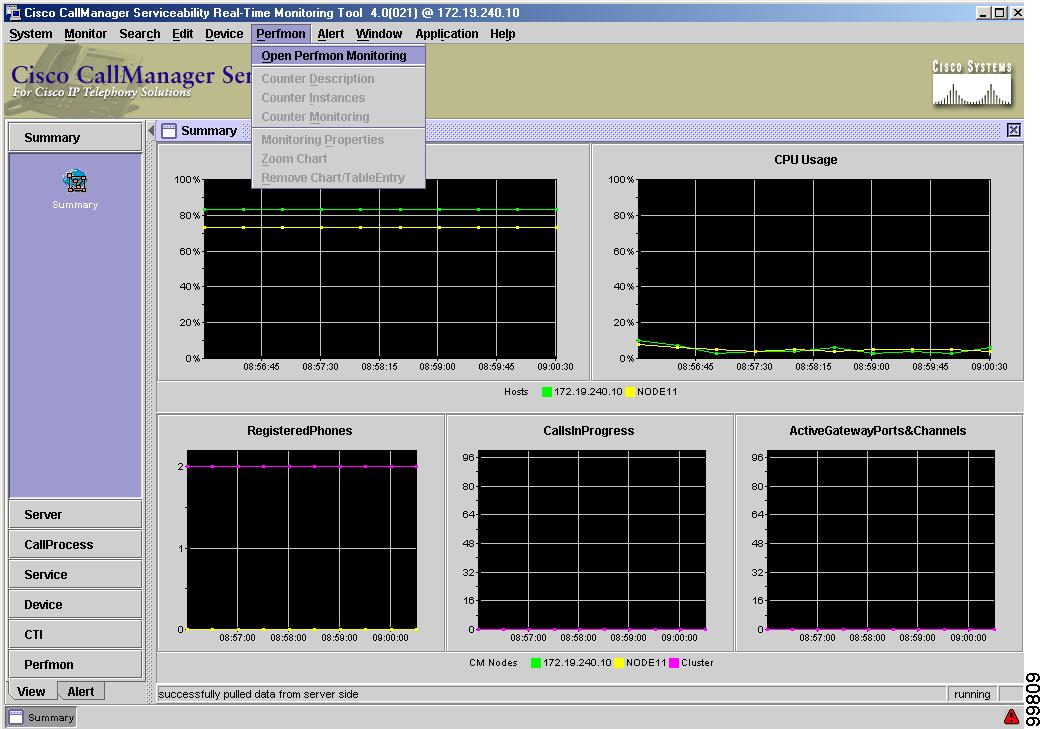
Perfmon Menu
The Perfmon menu provides access to Perfmon functionality and includes the following menu items:
•
•
•
•
•
•
•
Figure 9-18 shows a Perfmon menu example.
Figure 9-18 Perfmon Menu
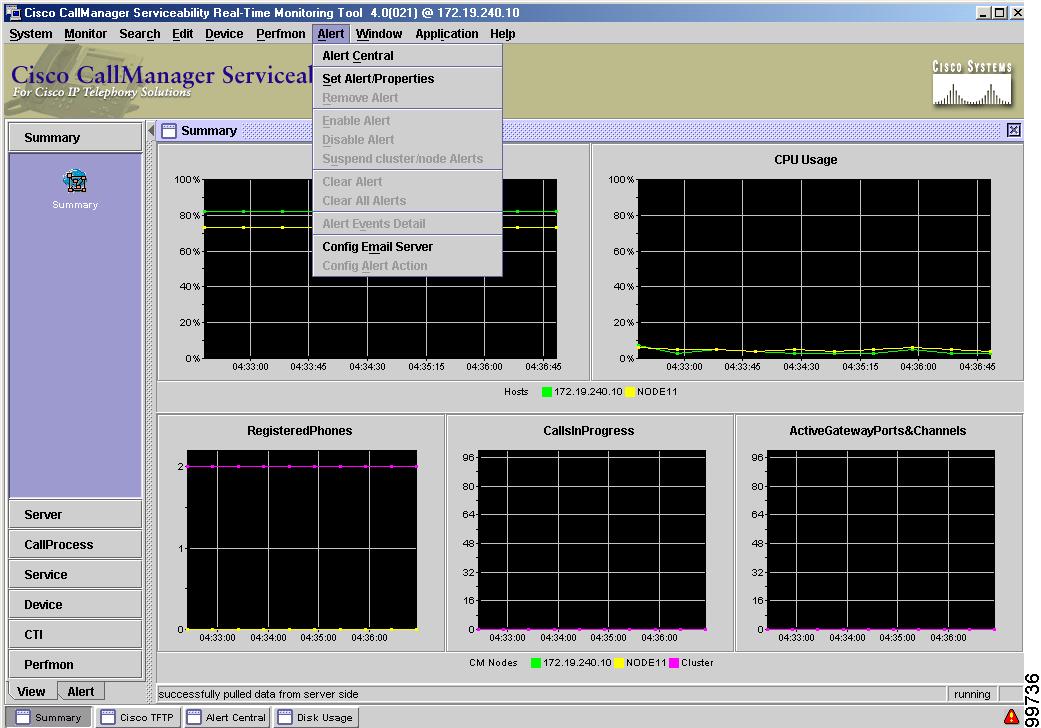
Alert Menu
The Alert menu provides all alert-related functionality including alert defining, setting, and viewing. This menu comprises the following menu options:
•
Note
•
•
•
•
•
•
•
•
•
•
Two kinds of alerts occur: preconfigured and user-defined. You can further configure both, but the difference is that you cannot delete preconfigured alerts whereas you can add and delete user-defined alerts.
For more information on customizing alerts, refer to Chapter 12, "Real-Time Monitoring Configuration," in the Cisco CallManager Serviceability Administration Guide.
Figure 9-19 through Figure 9-25 show examples of different alert menu categories and their associated windows.
Figure 9-19 Alert Menu
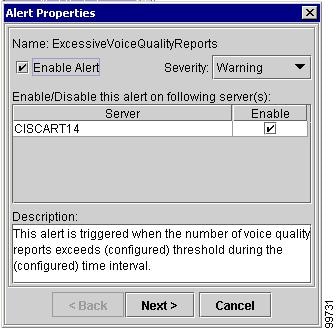
Figure 9-20 Alert Properties Window
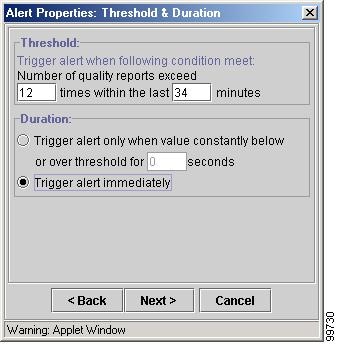
Figure 9-21 Alert Properties Threshold & Duration Window
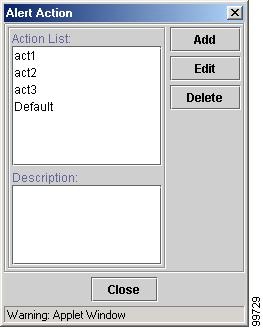
Figure 9-22 Alert Action Window
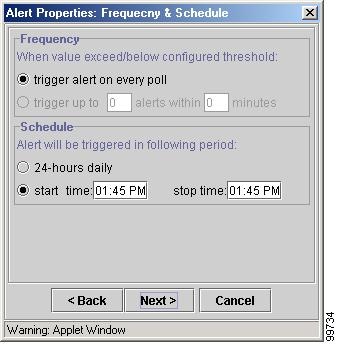
Figure 9-23 Alert Frequency & Schedule Window
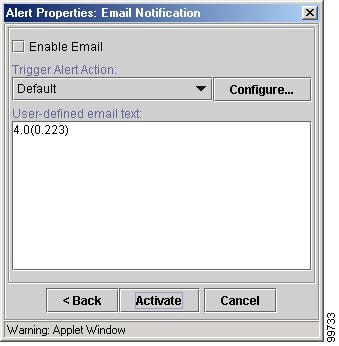
Figure 9-24 Alert Properties E-mail Notification Window
Figure 9-25 Disable Alert Example
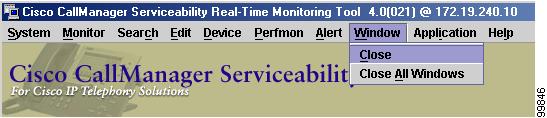
Window Menu
You can use the Window menu to close opened monitoring windows by using two menu items: Close and Close All Windows. You can use the Close menu item to close the current active window in the right content viewing panel. Use the Close All Windows menu item to close all opened monitoring windows. Figure 9-26 shows a Window menu example.
Figure 9-26 Window Menu
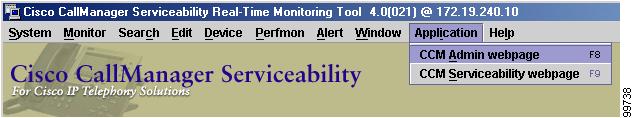
Application Menu
The Application menu provides a way to access Cisco CallManager Adminstration and Cisco CallManager Serviceability web pages. Figure 9-27 shows an Applications menu example.
Figure 9-27 Application Menu
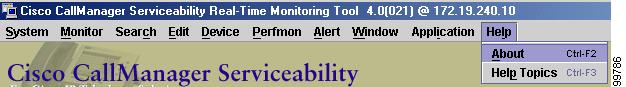
Help Menu
The Help menu provides information about product name, client and server software versions, and third-party libraries software version information, as well as RTMT help pages.
. Figure 9-28 shows a Help menu example.
Figure 9-28 Help Menu
Monitor Window
To support the precanned set of monitoring objects, the RTMT main user interface comprises two parts: left controlling center pane and right content viewing panel.
The controlling center comprises the View tab and the Alert tab. The View tab comprises several different monitoring categories, and the Alert tab comprises only the Alert category.
The View and Alert tabs differ in that anything related to the View tab gets saved as a profile that can be restored at any time that RTMT is invoked. The Alert tab relates only to the systemwide alert functionality. The states cannot be saved. See the "View Tab" section and the "Alert Tab" section for more information about each tab.
The polling rate in each precanned monitoring window remains fixed, and the default value specifies 30 seconds. If the collecting rate of RISDC (real-time information system directory) changes in Cisco CallManager Administration service parameters web pages, the polling rate in the precanned window also updates. In addition, the local time of the RTMT client application and not the backend server time, provides the basis for the time stamp in each chart.
View Tab
The View tab in the RTMT monitor window comprises several different monitoring categories. See the following sections for more information on each category:
•
Summary
The Summary page provides monitoring of some important common information on a central page. Monitored information includes
•
•
•
•
•
Figure 9-29 shows a summary monitoring page example.
Figure 9-29 Summary Page
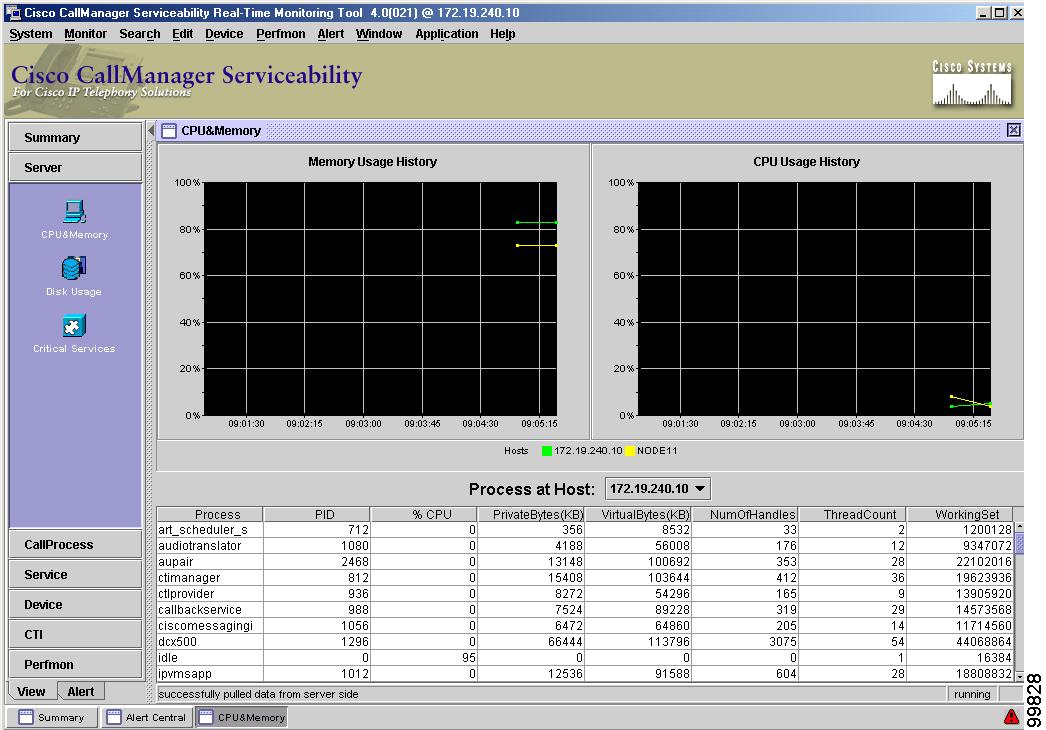
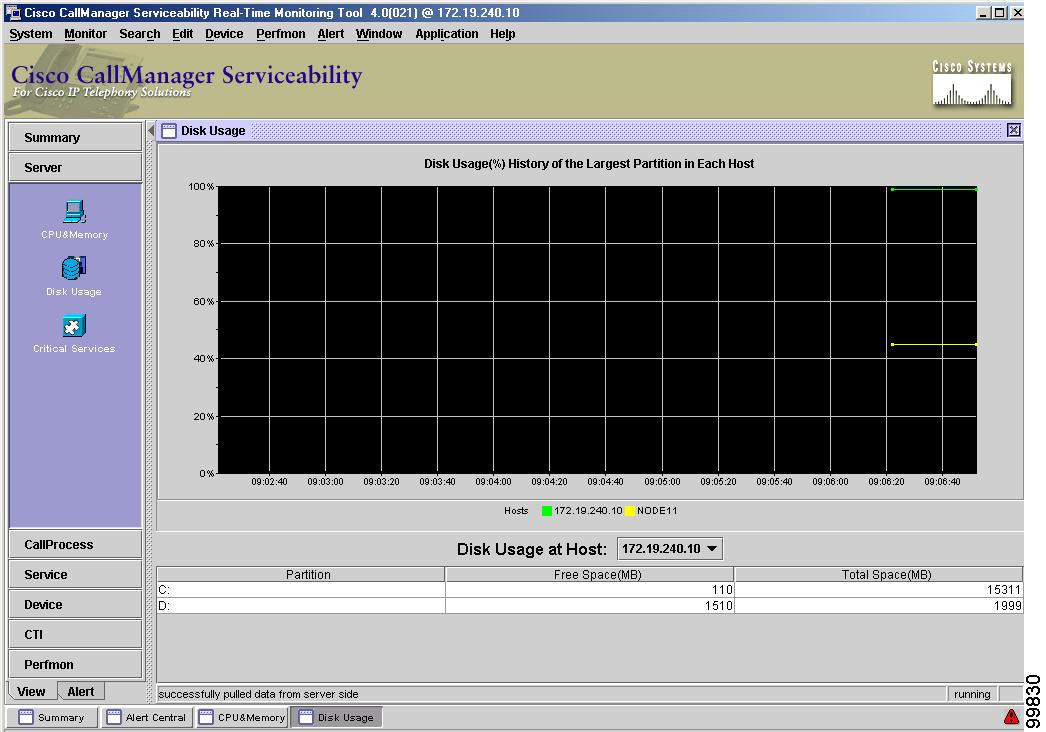
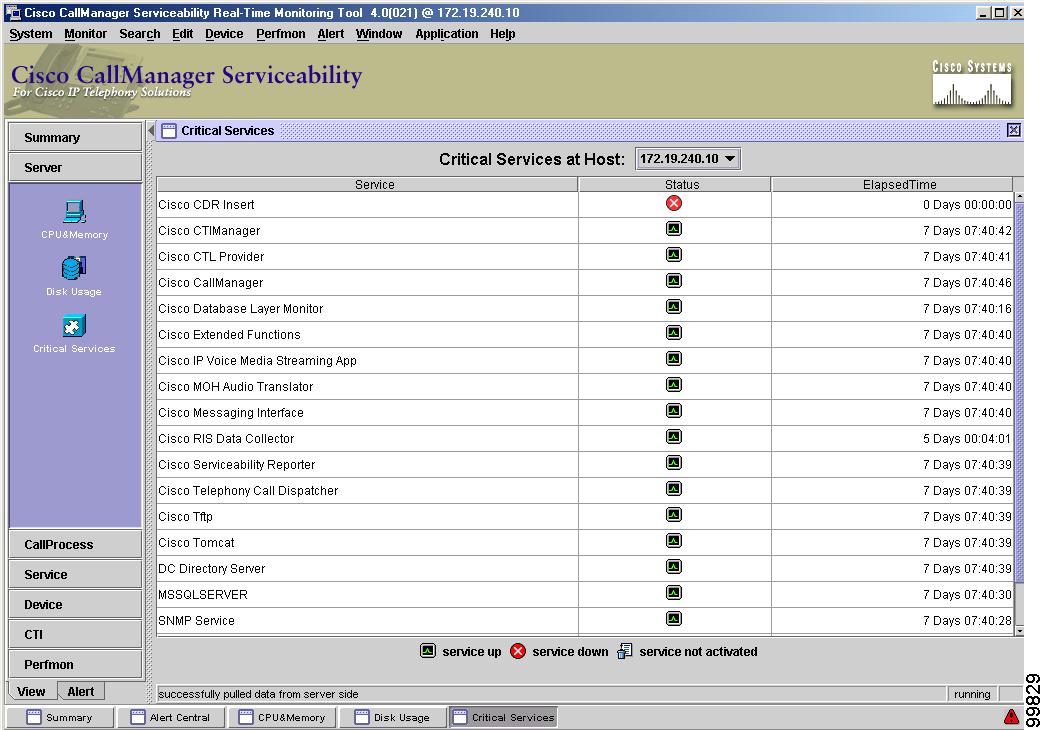
Server Status Monitoring
The Server category monitors precanned objects such as CPU and memory usage, disk usage, and critical Cisco CallManager services. See Figure 9-30 through Figure 9-32 for examples of each monitored object.
Figure 9-30 CPU and Memory Usage
Figure 9-31 Disk Usage
Figure 9-32 Critical Services
The Critical Services monitoring category provides the name of the critical service, the status (whether the service is up, down, or activated), and the elapsed time during which the services have been in a particular status for a particular Cisco CallManager node.
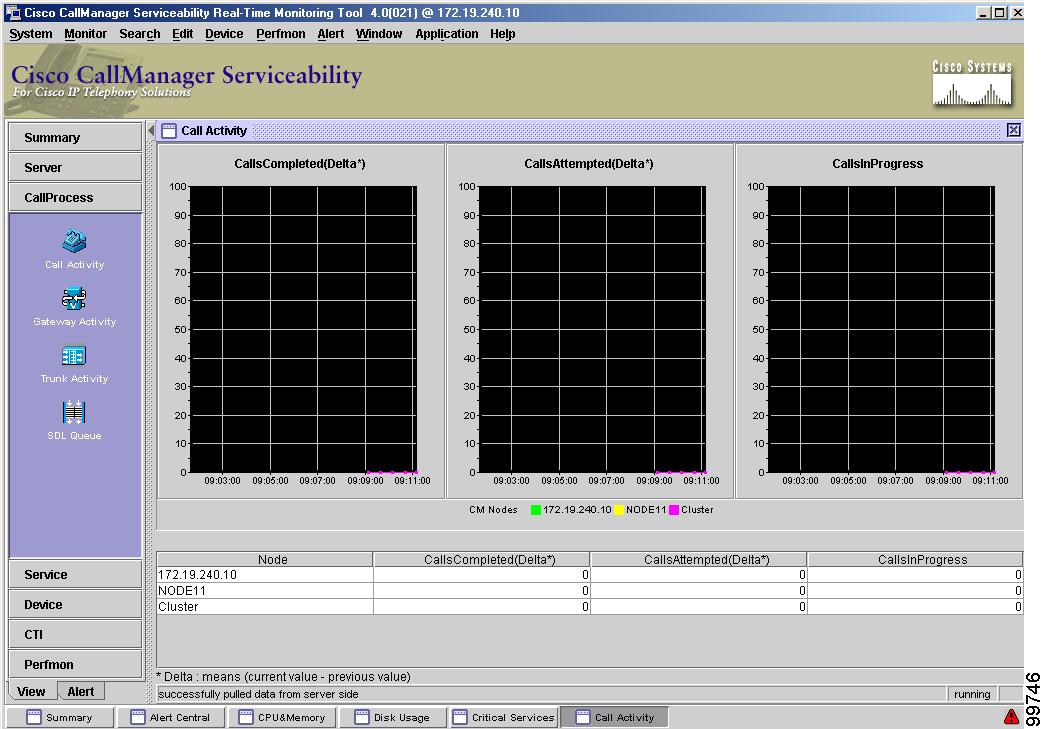
Call Process Activity Monitoring
The Call Process monitoring category monitors Cisco CallManager call processing activity. Call processing monitored items include
•
•
•
•
See Figure 9-33 through Figure 9-36 for examples of call-processing activity monitoring.
Figure 9-33 Call Activity Monitoring
Figure 9-34 Gateway Activity Monitoring
Figure 9-35 Trunk Activity Monitoring
Figure 9-36 SDL Queue Monitoring
Service Monitoring
The Service monitoring category monitors the activities of the Cisco TFTP, the directory server, and the heartbeat information. See the following sections for more information on the directory server and heartbeat:
Cisco TFTP
The Cisco TFTP service builds and serves files that are consistent with the trivial file transfer protocol, which is a simplified version of the File Transfer Protocol (FTP). Cisco TFTP builds configuration files and serves embedded component executables, ringer files, and device configuration files.
You can view the total Cisco TFTP requests, requests not found, and requests that were aborted.
Directory Servers
Directory servers comprise database repositories that store user and device information such as user name, password, and location. The Cisco CallManager publisher contains the directory where the directory settings are similar to SQL. Each node in the cluster has its own copy of the directory. The directory supports three types of directory: embedded, active, and Netscape. An embedded directory resides on the same node as its associated Cisco CallManager (other types reside on other nodes in the cluster). A directory that resides on the publisher node provides write permission.
You can view the directory servers connection status. Directory server connection status and replication status get checked when an alert is pending. If the server is not connected, an alert occurs. The directory server connection status gets polled every 10 minutes; replication status gets polled once every hour.
RTMT Heartbeat Feature
The Real-Time Monitoring tool monitors the heartbeat of Cisco CallManagers, Cisco TFTPs, and Cisco TCDs. The heartbeat acts as an indicator of the life of whatever it is monitoring. When the heartbeat is lost, a blinking icon appears in the lower, right corner of the RTMT window. To find when the heartbeat loss was detected, click the blinking icon. An e-mail can notify you of the heartbeat loss.
Device Monitoring
The Device monitoring category provides a summary of devices and device search capability. The device summary monitors registered phone, gateway, and media resource devices on a particular Cisco CallManager and an entire cluster. The device search category allows you to search for every device in a Cisco CallManager cluster on the basis of the search criteria that you set up.
Note
CTI Monitoring
The CTI category monitors CTI Manager activities and provides CTI search capability. With CTI Manager, you can monitor the number of open devices, lines, and CTI connections.
Note
Perfmon Monitoring
RTMT displays performance information of all Cisco CallManager components in a cluster. The tool integrates with Cisco CallManager administration and serviceability software. RTMT provides an alert notification mechanism to ease the system administrator troubleshooting tasks. It also monitors various aspects of the Cisco CallManager performance by periodically polling NT/2000 performance counter values. The system continuously monitors a set of common, preconfigured objects, and various alerts in the form of e-mail messages get generated for these objects when values are over or below user-configured thresholds. In addition, the system generates daily reports for these objects.
Perfmon monitoring provides the following services:
•
•
•
•
•
•
See the following sections for configuration options in the RTMT perfmon monitoring pane:
•
Refer to Chapter 12, "Real-Time Monitoring Configuration," in the Cisco CallManager Serviceability Administration Guide for more configuration options.
Category Tabs
A category comprises monitored performance counters. A tab in the RTMT monitoring pane contains the category name. All performance counters that are monitored in this tab belong to a category. The system polls the performance counters in the tab at the same rate, with each category configured to have its own polling rate.
You can create custom categories in the RTMT monitoring pane to view information that helps you troubleshoot specific performance or device problems. If your Cisco CallManager system is experiencing performance problems with specific objects, create custom categories to monitor the performance of the counters within the object. If the system is experiencing problems with specific devices, create custom categories to monitor the devices within the cluster. In addition, you can create alert notifications for counters and gateways in these custom categories.
To create custom categories, you add a new category tab. When the tab is created, you specify the specific performance counters, devices, and alerts within that tab and then save your custom category by using Profile.
Sample Rate
The Cisco CallManager software polls counters, devices, and gateway ports to gather status information. In the RTMT monitoring pane, you configure the polling intervals for the performance counters, devices, and gateway ports for each category tab that you create.
Note
Perfmon Counters Table View/Chart View
The Cisco CallManager software displays performance counters in chart or table format. Chart format looks like a miniature screen of information. Up to six charts display in the RTMT performance monitoring pane for each category tab that you create. You can display a particular counter by double clicking the counter in the perfmon monitoring pane. Because chart view represents the default, you configure the performance counters to display in table format when you create a category.
Remove Chart/TableEntry
You can remove a counter chart (table entry) with the Remove Chart/TableEntry menu item in the Perfmon menu in the menu bar. See the "Perfmon Menu" section for an example of the Perfmon menu.
Understanding Perfmon Monitoring
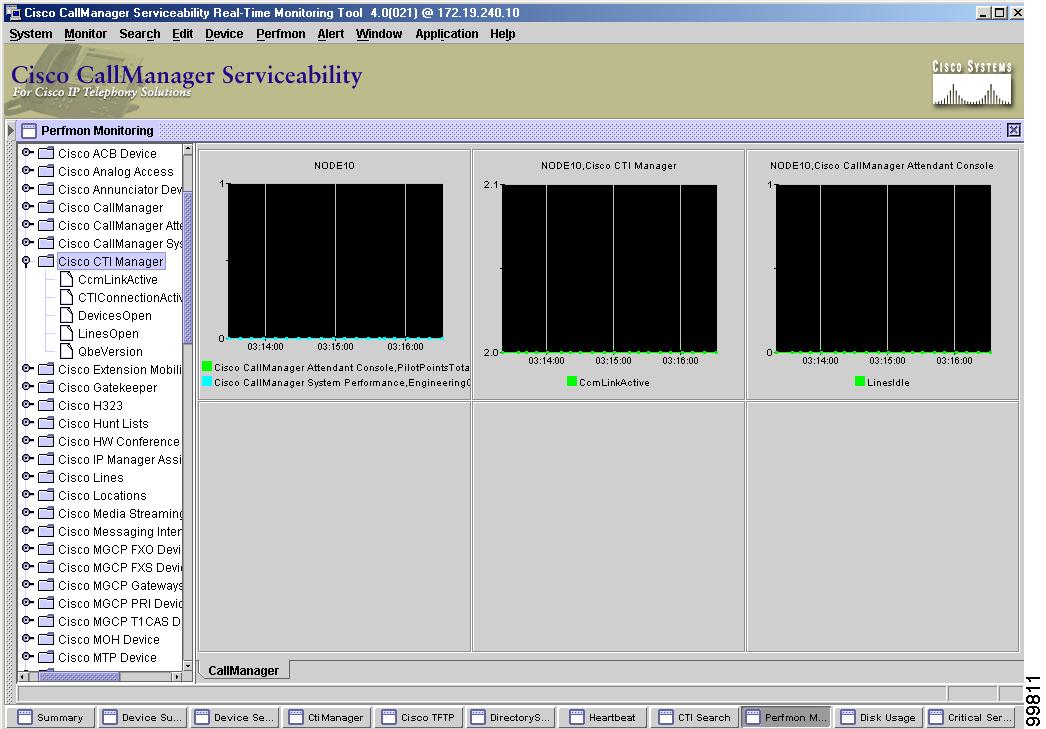
You can monitor the performance of the Cisco CallManager software by choosing the counters for any object. The counters for each object display when the folder is expanded. Figure 9-37 shows an example of the perfmon monitoring objects and counters in the expanded view.
Figure 9-37 Perfmon Objects and Counters in Expanded View
Add a Counter to Monitor
To troubleshoot system performance problems, you add the counter that is associated with the perfmon object to the RTMT performance monitoring pane, which displays a chart for the counter. Before you add counters, see the "Category Tabs" section.
Category tabs contain up to six perfmon counter charts.
Configure Alert Notification for Counter
Using the alert notification feature, Cisco CallManager notifies you of system problems. Perform the following configuration setup to activate alert notifications for a system counter:
•
•
•
•
•
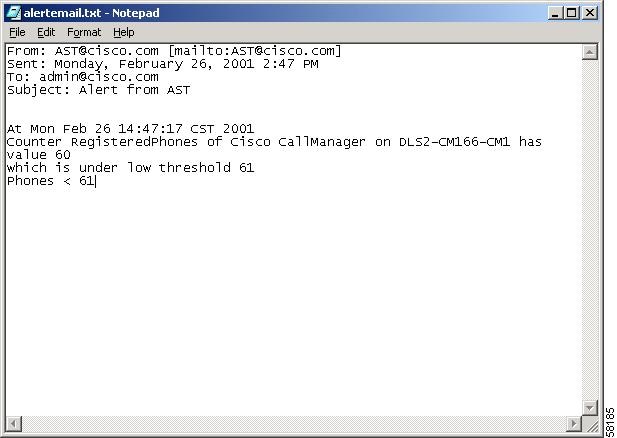
Figure 9-38 provides an example of an alert e-mail that was sent to the system administrator when the RegisteredPhones was below the low threshold.
Figure 9-38 Alert Notification E-Mail
Refer to "Real-Time Monitoring Configuration" in the Cisco CallManager Serviceability Administration Guide for more detailed information.
Zoom Counter
To get a closer look at performance monitors, zoom the monitor counter in the RTMT perfmon monitoring pane by highlighting the counter chart and choosing Zoom Chart in the Perfmon menu.
Counter Properties
Counter properties provide two capabilities: display a description of the counter and configure data sampling parameters.
Property Description
Use one of two ways to obtain a description of the counter:
•
•
Data Sample
The Counter Property window contains the option to configure data samples for a counter. The performance counters that display in the RTMT performance monitoring pane contain green dots that represent samples of data over time. You can configure the number of data samples to collect and the number of data points to show in the chart. After the data sample is configured, view the information by using the View All Data/View Current Data menu selection. See View All Data for a Counter.
View All Data for a Counter
Use this view data for a monitor option to view all the data that was collected for a perfmon counter. See Counter Properties, for a description of data sample configuration.
Perfmon Monitoring Configuration Checklist
Table 9-6 provides an overview of the steps for monitoring perfmon counters.
Table 9-6 Performance Monitoring Configuration Checklist
Step 1
Load RTMT.
Loading Real-Time Monitoring, Cisco CallManager Serviceability Administration Guide
Step 2
Choose a Cisco CallManager object/counter to monitor and activate alert notification for the counter.
Adding a Counter to Monitor by Using the Perfmon Category, Cisco CallManager Serviceability Administration Guide
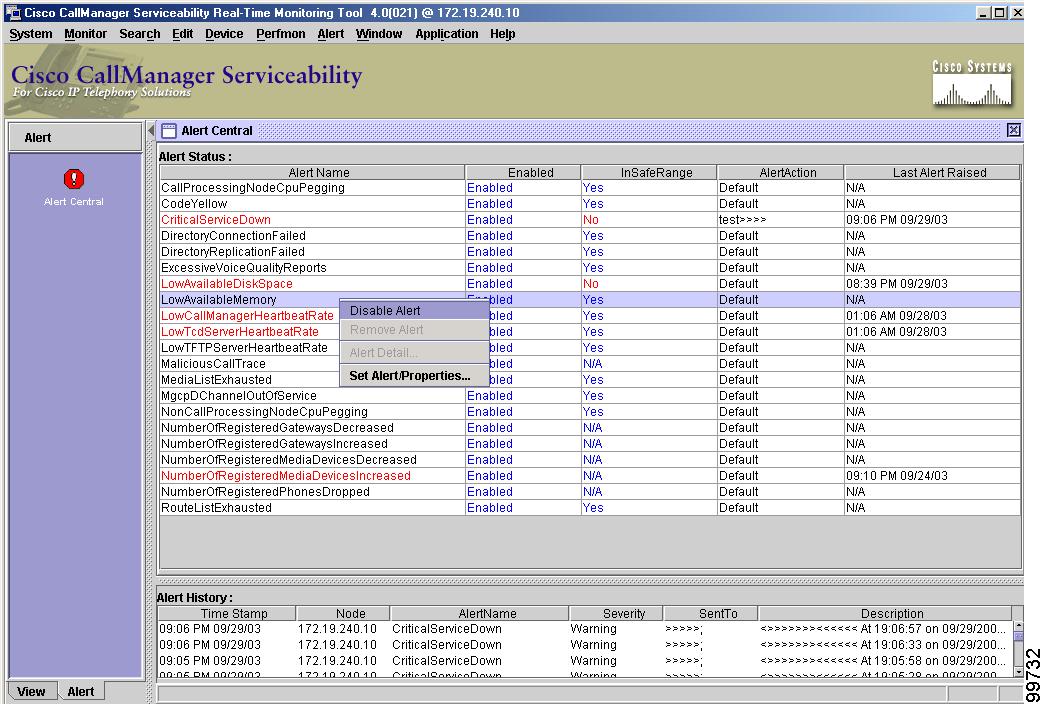
Alert Tab
In RTMT you can configure alert notification for perfmon counter value thresholds, schedule for alert checking, and status change of device (for example, port is out of service).
The Alert tab in the left controlling center in the RTMT monitor window, comprises the Alert Central category. Alert Central provides both the current status and the history of all the alerts in the Cisco CallManager cluster.
Use the Alert tab in conjuction with the Alert menu in the RTMT menu bar to monitor Cisco CallManager alerts. See the "Alert Menu" section for more information about the alert menu.
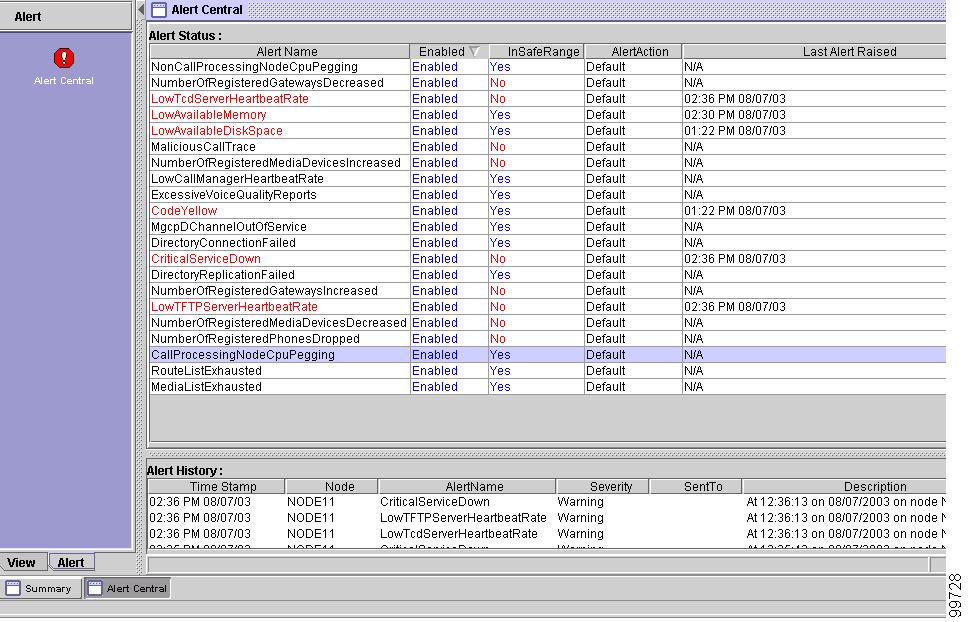
Figure 9-39 shows an alert tab example.
Figure 9-39 Alert Tab
Alert Customization
You can configure both preconfigured and user-defined alerts in RTMT; however, you cannot delete preconfigured alerts. You can add and delete user-defined alerts. You can also disable both preconfigured and user-defined alerts in RTMT.
Table 9-7 provides a list of fields that you will use to configure each alert; all fieldspreconfigured are user-configurable unless otherwise marked.
Table 9-7 Alert Customization
Alert Name
High-level name of the monitoring item with which RTMT associates an alert
Descriptive name. For preconfigured alerts, you cannot change this field. See the "Preconfigured Alerts" section.
Description
Description of the alert
You cannot edit this field for preconfigured alerts. See the "Preconfigured Alerts" section.
Perfmon Counters
List of source perfmon counters
For preconfigured alerts, you cannot change this field.
Value Threshold
Condition to raise alert (value is...)
Specify up < - > down, less than #, %, rate greater than #, %, rate.
Evaluation Method
Method used to check the threshold condition
Specify value to be evaluated as absolute, delta (present - previous), or % delta.
Duration Threshold
Condition to raise alert (how long value threshold has to persist before raising alert)
Options include right away and specify at least X minutes.
Number of Events Threshold
Raise alert only when a configurable number of events exceed a configurable time interval (in minutes).
For ExcessiveVoiceQualityReports, the default thresholds are 10 within 60 minutes. For RouteListExhausted and MediaListExhausted, the defaults are 0 within 60 minutes.
Node IDs
Cluster or list of nodes to monitor
Cisco CallManager nodes, Cisco TFTP node, or publisher node.
Note
Alert Action ID
ID of alert action to take (system always logs alerts no matter what the alert action).
Alert action gets defined first (see the "Alert Action Configuration" section). If this field is blank, that indicates that e-mail is disabled.
Disabled
Alert disabled
Options include enabled or disabled
Clear Alert
To reset alert (change the color of an alert item from red to black) to signal that the alert has been resolved.
After an alert has been raised, its color will automatically change to red and stay that way until you manually clear the alert. Use Clear All to clear all alerts.
In Safe Range
To indicate if an alert threshold condition has been met (not configurable).
This field is not applicable to MaliciousCall and Registered YYY types of alerts. For DChannel OOS alert, this field is YES only when you no longer have any outstanding OOS devices. The Code Yellow alert will be back in safe range only when you receive a CodeYellowExit event from Cisco CallManager.
Alert Details
To view the detail of an alert (not configurable).
For VoiceQualityReports, RouteListExhausted, and MediaListExhausted, up to 30 current event details get displayed in the current monitoring interval if an alert has been raised in the current interval. Otherwise, the previous 30 event details in the previous interval get displayed. For DChannel OOS alert, the list of outstanding OOS devices at the time the alert was raised gets displayed.
Alert Generation Rate
How often to generate alert when alert condition persists
Specify every X minutes. (Raise alert once every X minutes if condition persists.)
Specify every X minutes up to Y times. (Raise alert Y times every X minutes if condition persists.)
User Provide Text
Administrator to append text on top of predefined alert text
N/A
Severity
For viewing purposes (for example, show only Sev. 1 alerts)
Specify defaults that are provided for predefined (for example, Error, Warning, Information).
Collection Polling Rate
Same rate for both preconfigured and user-defined alerts
Although not configurable through RTMT Alert Central, you can customize this through Cisco CallManager Administration in Service Parameters.
Alert Action Configuration
In RTMT, you can configure alert actions for every alert that is generated and have the alert action sent to e-mail recipients that you specify in the alert action list.
RTMT provides a list of fields you will use to configure alert actions. All are user-configurable unless otherwise marked.
Preconfigured Alerts
RTMT comprises a set of preconfigured alerts. You cannot delete these alerts; however, you can enable or disable them in Alert Central.
The following list comprises the preconfigured alerts in RTMT:
•
•
•
•
•
•
•
•
•
•
•
•
•
•
•
•
•
•
•
•
•
Alert Configuration Checklist
Table 9-9 provides an overview of the steps for configuring alerts.
Table 9-9 Alert Configuration Checklist
Step 1
Load RTMT.
Loading Real-Time Monitoring, Cisco CallManager Serviceability Administration Guide
Step 2
For non-preconfigured alerts, set up alert for counters within a category.
Adding a Counter to Monitor by Using the Perfmon Category, Cisco CallManager Serviceability Administration Guide
Step 3
Set up alert notification for a perfmon counter.
Configuring Alert Notification for a Counter, Cisco CallManager Serviceability Administration Guide
Logging in RIS
See the following sections for information about logging in RIS in RTMT:
Logger
RTMT Collector uses the logger to log preconfigured monitoring objects information and Alert Manager uses logger to log alert histories into log files. Each preconfigured object belongs to one of the four categories, namely devices, services, servers, and call activities. Each category has a separate log file. Alert details get logged in a separate file. Also, another log file exists for perfmon that logs the important perfmon object values for Cisco CallManager-related services and processes.
The primary collector invokes the logger with the data from the whole of the Cisco CallManager cluster. The locally written log files appear in the primary collector server at C:\Program Files\Common Files\Cisco\Logs\RTMTLogger. As the primary collector can change due to failover/fallback scenarios, the log files can exist in more than one server in the Cisco CallManager cluster.
Log files exist in csv format. You can read log files, except alert log file, by native NT perfmon viewer. New log files get created every day at 00:00 hours on the local system. New logs for devices, services, servers, and calls get created when the time zone changes or when a new node is added to the cluster, or during failover/fallback scenarios. The first column of all these logs comprises the time zone information and the number of minutes from the Greenwich Meridian Time (GMT). Reporter uses these log files as data source to generate daily summary reports.
Alert Log
The Alert log stores the alert, which is also stored in memory. The memory gets cleared at a constant interval, leaving the last 30 minutes of data in the memory. When the service starts/restarts, the last 30 minutes of alert data loads into the memory by the system reading from the alert logs that exist in all servers in the cluster. The alert data in the memory gets sent to the RTMT clients on request.
Upon RTMT startup, RTMT shows all logs that occurred in the last 30 minutes in the Alert Central log history. Alert log periodically gets updated and new logs get inserted into the log history window. After the number of logs reaches 100, RTMT removes the oldest 40 logs.
The file name format of the alert log will be AlertLog_MM_DD_YYYY_hh_mm.csv.
The alert log includes the following attributes:
•
•
•
•
•
•
•
•
The first line of each log file comprises the header. Details of each alert gets written in a single line, separated by a comma.
Server Log
The server data accumulates in the memory whenever the LogServer API is called. Every 5 minutes, the data gets logged into the file as a single record, and RTMT cleans the memory.
The system logs the data every 5 minutes for the following counters, based on the following calculation:
•
•
•
RISDC logs the server data in windows Performance tool-compatible csv format. The header of the log comprises the time zone information and a set of columns with the previous counters for a Cisco CallManager node. These sets of columns get repeated for every node.
The following file name format of the server log applies: ServerLog_MM_DD_YYYY_hh_mm.csv.
The first line of each log file comprises the header.
Service Log
The service data accumulates in the memory whenever RTMT calls the LogService API. Every 5 minutes, RTMT logs the data into the file as a single record and cleans the memory.
The data gets logged every 5 minutes for the following counters, based on the following calculation:
•
•
•
•
•
•
RISDC logs the service data in windows Performance tool-compatible scv format. The header of the log comprises the time zone information and a set of columns with the counters that were previously listed for a Cisco CallManager node. These sets of columns repeat for every node.
The following file name format of the Service Log applies: ServiceLog_MM_DD_YYYY_hh_mm.csv.
The first line of each log comprises the header.
Call Log
The system accumulates call data in the memory whenever RTMT calls the LogCall API. Every 5 minutes, RTMT logs the data into the file as a single record and cleans the memory.
The system logs data every 5 minutes for the following counters on the basis of the following calculation:
•
•
•
•
•
•
•
•
•
•
•
•
•
•
•
•
•
•
•
•
•
•
•
•
RISDC logs the call data in windows Performance tool-compatible csv format. The header of the log comprises the time zone information and a set of columns with the previously listed counters for a node. These sets of columns repeat for every node.
The following file name format of the Call Log is CallLog_MM_DD_YYYY_hh_mm.csv.
The first line of each log file is the header.
Device Log
The device data accumulates in the memory whenever RTMT calls the LogDevice API. Every 5 minutes, RTMT logs the data into the file as a single record and cleans the memory.
The data gets logged every 5 minutes for the following counters based on the following calculation:
•
•
•
•
•
RISDC logs the device data in windows Performance tool-compatible csv format. The header of the log comprises the time zone information and a set of columns with the previously listed counters for a node. These sets of columns repeat for every node.
The following file name format of the Device Log applies: DeviceLog_MM_DD_YYYY_hh_mm.csv.
The first line of each log file comprises the header.
Perfmon Log
The Perfmon data is logged whenever RTMT calls the LogPerfMon API. The file log is compatible with the Windows Performance tool csv format and can be opened using the Performance tool for analysis.
When you add new counters, RTMT changes the header to accommodate the new counters and logs the values correspondingly. When data is unavailable for an already existing counter (already added to header), then RTMT inserts blank values in the file. If the character length of the new counters added is greater than 2000, then the new file gets generated with all the counters.
The file name format of the PerfMon Log is PerfMonLog_<NodeName>_MM_DD_YYYY_hh_mm.csv.
The following lists comprises the perfmon counters that RTMT logs:
At System level:
•
•
•
•
•
•
•
•
For each process that is running on the system:
•
•
•
•
Where to Find More Information
Related Topics
•
•
•
•
•
•