Table Of Contents
Configuring RMON
About RMON
Configuring RMON Using Threshold Manager
RMON Alarm Configuration
Enabling RMON Alarms by Port
Enabling RMON Alarms for VSANs
Enabling RMON Alarms for Physical Components
Managing RMON Events
Managing RMON Alarms
Viewing the RMON Log
Default Settings
Configuring RMON
RMON is an Internet Engineering Task Force (IETF) standard monitoring specification that allows various network agents and console systems to exchange network monitoring data. You can use the RMON alarms and events to monitor Cisco MDS 9000 Family switches running the Cisco SAN-OS Release 2.0(1b) or later software.
This chapter includes the following sections:
•
About RMON
•
Configuring RMON Using Threshold Manager
•
Default Settings
About RMON
All switches in the Cisco MDS 9000 Family support the following RMON functions (defined in RFC 2819):
•
Alarm—Monitors a specific management information base (MIB) object for a specified interval, triggers an alarm at a specified value (rising threshold), and resets the alarm at another value (falling threshold). Alarms can be used with events; the alarm triggers an event, which can generate a log entry or an SNMP trap.
•
Event—Determines the action to take when an event is triggered by an alarm. The action can be to generate a log entry, an SNMP trap, or both.
Refer to the Cisco MDS 9000 Family MIB Quick Reference for agent and management information.
See the "About SNMP Security" section on page 40-1 for SNMP security-related CLI configurations.
Configuring RMON Using Threshold Manager
RMON is disabled by default and no events or alarms are configured in the switch. You can configure your RMON alarms and events by using the CLI or by using Threshold Manager in Device Manager.
The Threshold Monitor allows you to trigger an SNMP event or log a message when the selected statistic goes over a configured threshold value. RMON calls this a rising alarm threshold. The configurable settings are as follows:
•
Variable—The statistic you want to set the threshold value on.
•
Value—The value of the variable that you want the alarm to trigger at. This value is the difference (delta) between two consecutive polls of the variable by Device Manager.
•
Sample—The sample period (in seconds) between two consecutive polls of the variable. Select your sample period such that the variable would not cross the threshold value you set under normal operating conditions.
•
Warning—The warning level used by Device Manager to indicate the severity of the triggered alarm. This is a Fabric Manager and Device Manager enhancement to RMON.
Note
To configure any type of RMON alarm (absolute or delta, rising or falling threshold) click More on the Threshold Manager dialog box. You should be familiar with how RMON defines these concepts before configuring these advanced alarm types. Refer to the RMON-MIB (RFC 2819) for information on how to configure RMON alarms.
Note
You must also configure SNMP on the switch to access RMON MIB objects.
RMON Alarm Configuration
Threshold Manager provides a list of common MIB objects that you may want to set an RMON threshold and alarm on. You can also set an alarm on any MIB object. The specified MIB must be an existing SNMP MIB object in standard dot notation (1.3.6.1.2.1.2.2.1.14.16 for ifInOctets.16).
Use one of the following options to specify the interval to monitor the MIB variable (ranges from 1 to 4294967295 seconds):
•
Use the delta option to test the change between samples of a MIB variable.
•
Use the absolute option to test each MIB variable directly.
•
Use the delta option to test any MIB objects that are counters.
The range for the rising threshold and falling threshold values is -2147483647 to 2147483647.
Caution 
The
falling threshold must be less than the
rising threshold.
You can optionally specify the following parameters:
•
The event-number to trigger if the rising or falling threshold exceeds the specified limit.
•
The owner of the alarm.
Enabling RMON Alarms by Port
To configure an RMON alarm for one or more ports using Device Manager, follow these steps:
Step 1
Choose Admin > Events > Threshold Manager and click the FC Interfaces tab.
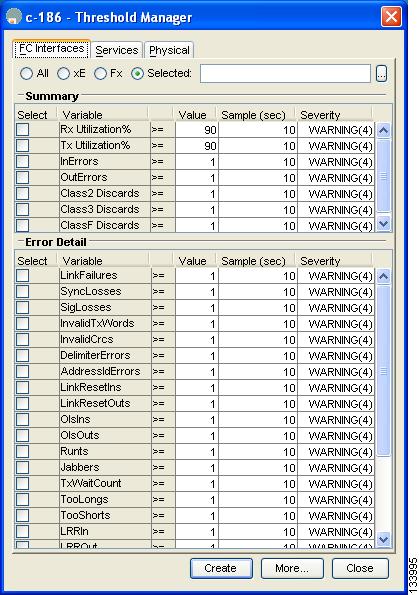
You see the Threshold Manager dialog box shown in Figure 61-1.
Figure 61-1 Threshold Manager Dialog Box
Step 2
Choose the Select radio button to select individual ports for this threshold alarm.
a.
Click the ... button to the right of the Selected field to display all ports.
b.
Select the ports you want to monitor.
c.
Click OK to accept the selection.
Alternatively, click the appropriate radio button to choose ports by type: All ports, xE ports, or Fx ports.
Step 3
Check the check box for each variable to be monitored.
Step 4
Enter the threshold value in the Value column.
Step 5
Enter the sampling period in seconds. This is the time between each snapshot of the variable.
Step 6
Choose one of the following severity levels to assign to the alarm: Fatal, Warning, Critical, Error, Information.
Step 7
Click Create.
Step 8
Confirm the operation to define an alarm and a log event when the system prompts you to define a severity event. If you do not confirm the operation, the system only defines a log event.
Step 9
Click More then click the Alarms tab from the Threshold Manager dialog box to verify the alarm you created.
Step 10
Close both dialog pop-ups.
Enabling RMON Alarms for VSANs
To enable an RMON alarm for one or more VSANs using Device Manager, follow these steps:
Step 1
Choose Admin > Events > Threshold Manager and click the Services tab.
You see the Threshold Manager dialog box.
Step 2
Click the Services tab.
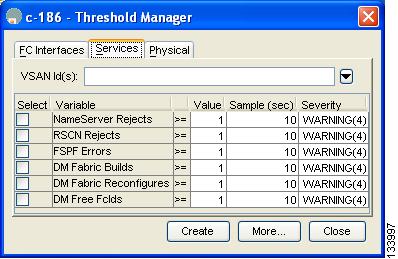
You see the Threshold Manager dialog box with the Services tab selected (see Figure 61-2).
Figure 61-2 Threshold Manager Services Tab
Step 3
Enter one or more VSANs (multiple VSANs separated by commas) to monitor in the VSAN ID(s) field. Use the down arrow to see a list of available VSANs to choose from.
Step 4
Check the check box in the Select column for each variable to monitor.
Step 5
Enter the threshold value in the Value column.
Step 6
Enter the sampling period in seconds.
Step 7
Choose a severity level to assign to the alarm (Fatal, Critical, Error, Warning, or Information).
Step 8
Click Create.
Step 9
Confirm the operation to define an alarm and a log event when the system prompts you to define a severity event.
If you do not confirm the operation, the system only defines a log event.
Step 10
Click More, then click the Alarms tab in the Threshold Manager dialog box to verify the alarm you created (see Figure 61-3).
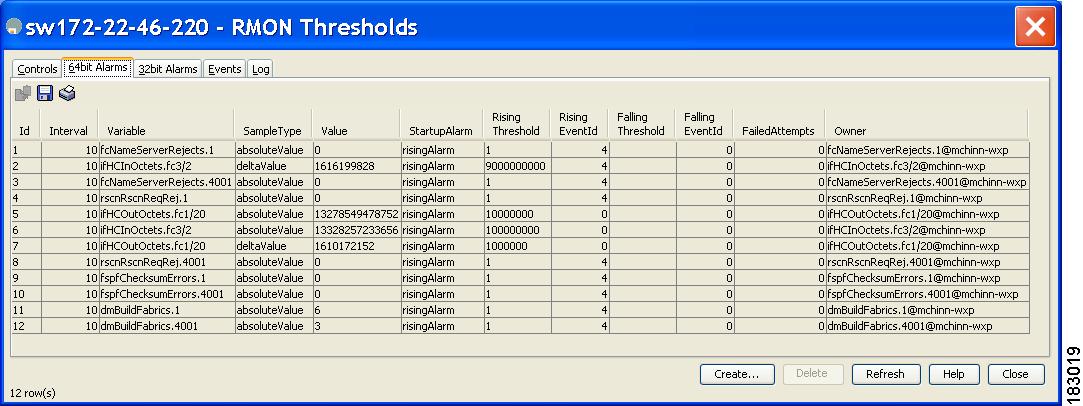
Figure 61-3 List of Threshold Alarms
Step 11
Close both pop-up windows.
Enabling RMON Alarms for Physical Components
To configure an RMON alarm for a physical component using Device Manager, follow these steps:
Step 1
Choose Admin > Events > Threshold Manager and click the Physical tab.
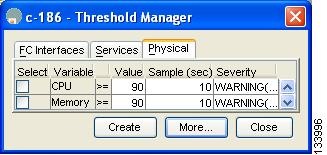
You see the Threshold Manager dialog box with the Physical tab selected (see Figure 61-4).
Figure 61-4 Threshold Manager Physical Tab
Step 2
Check the check box in the Select column for each variable to monitor.
Step 3
Enter the threshold value in the Value column.
Step 4
Enter the sampling period in seconds.
Step 5
Choose one of the following severity levels to assign to the alarm: Fatal(1), Warning(2), Critical(3), Error(4), Information(5).
Step 6
Click Create.
Step 7
Confirm the operation to define an alarm and a log event when the system prompts you to define a severity event.
If you do not confirm the operation, the system only defines a log event.
Step 8
Click More, then click the Alarms tab in the Threshold Manager dialog box to verify the alarm you created (see Figure 61-5).
Figure 61-5 List of Threshold Alarms
Step 9
Close both dialog boxes.
Managing RMON Events
To define customized RMON events using Device Manager, follow these steps:
Step 1
Choose Admin > Events > Threshold Manager and click More on the Threshold Manager dialog box.
Step 2
Click the Events tab on the RMON Thresholds dialog box.
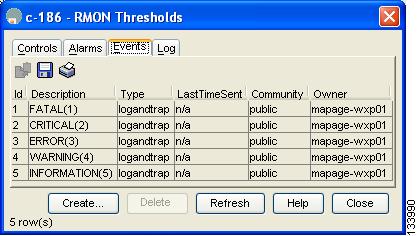
You see the RMON Thresholds Events tab (see Figure 61-6).
Figure 61-6 RMON Thresholds Events Tab
Step 3
Click Create to create an event entry.
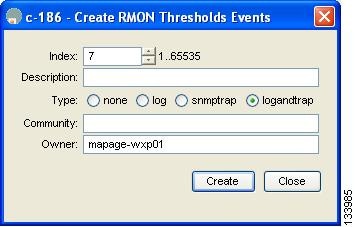
You see the Create RMON Thresholds Events dialog box shown in Figure 61-7.
Figure 61-7 Create RMON Thresholds Events Dialog Box
Step 4
Configure the RMON threshold event attributes by choosing the type of event (log, snmptrap, or logandtrap).
Step 5
Increment the index. If you try to create an event with the existing index, you see a duplicate entry error message.
Step 6
Optionally provide a description and a community.
Step 7
Click Create, then close this dialog box.
Step 8
Verify that your event is listed in the remaining RMON Thresholds dialog box.
Step 9
Click Close to close the RMON Thresholds dialog box.
Managing RMON Alarms
To view the alarms that have already been enabled using Device Manager, follow these steps:
Step 1
Choose Admin > Events > Threshold Manager and click More in the Threshold Manager dialog box.
Step 2
Click the Alarms tab.
You see the RMON Thresholds dialog box shown in Figure 61-8.
Figure 61-8 RMON Thresholds Dialog Box
Step 3
Delete any alarm by selecting it, then clicking Delete.
Viewing the RMON Log
To view the RMON log using Device Manager, follow these steps:
Step 1
Choose Admin > Events > Threshold Manager and click More on the Threshold Manager dialog box.
Step 2
Click the Log tab in the RMON Thresholds dialog box.
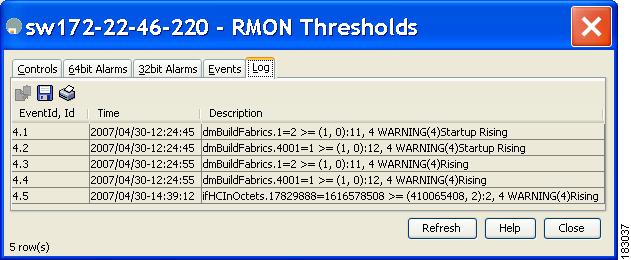
You see the RMON Thresholds Log tab (see Figure 61-9). This is the log of RMON events that have been triggered by the Threshold Manager.
Figure 61-9 RMON Thresholds Log Tab
Default Settings
Table 61-1 lists the default settings for all RMON features in any switch.
Table 61-1 Default RMON Settings
Parameters
|
Default
|
RMON alarms
|
Disabled.
|
RMON events
|
Disabled.
|