-
Cisco MDS 9000 Family Fabric Manager User Guide, Release 1.0(3a)
-
Index
-
Preface
-
Getting Started with Cisco Fabric Manager
-
Using Cisco Fabric Manager and Device Manager
-
Managing Zones and Zone Sets
-
Managing VSANs
-
Managing Administrator Access
-
Managing Software and Configuration Files
-
Managing Interfaces
-
Managing Events and Alarms
-
Managing the System and Components
-
Managing Fibre Channel Routing and FSPF
-
Managing Advanced Features
-
 Feedback
Table Of Contents
Using Cisco Fabric Manager and Device Manager
Summary of Fabric and Device Management Tasks
Menu Bar, Toolbars, and Message Bar
Troubleshooting Switch Configuration
Analyzing Switch Device Health
Analyzing End-to-End Connectivity
Analyzing Switch Fabric Configuration
Analyzing the Results of Merging Zones
Using Other Troubleshooting Tools
Viewing Reports in Fabric Manager
Launching Device Manager from Fabric Manager
Comparing Device Manager to Fabric Manager
Using Cisco Fabric Manager and Device Manager
This chapter describes how to use Cisco Fabric Manager and Device Manager, and it includes the following sections:
•
Summary of Fabric and Device Management Tasks
Summary of Fabric and Device Management Tasks
Table 2-1 summarizes the tasks that you can perform using Fabric Manager and Device Manager. In general, you can perform tasks using Fabric Manager for multiple devices. Device Manager is more convenient to use when you are working with a single switch.
Using Fabric Manager
This section describes how to use Fabric Manager and summarizes the tasks that you can perform with it. It includes the following sections:
•
•
Fabric Mangaer Main Window
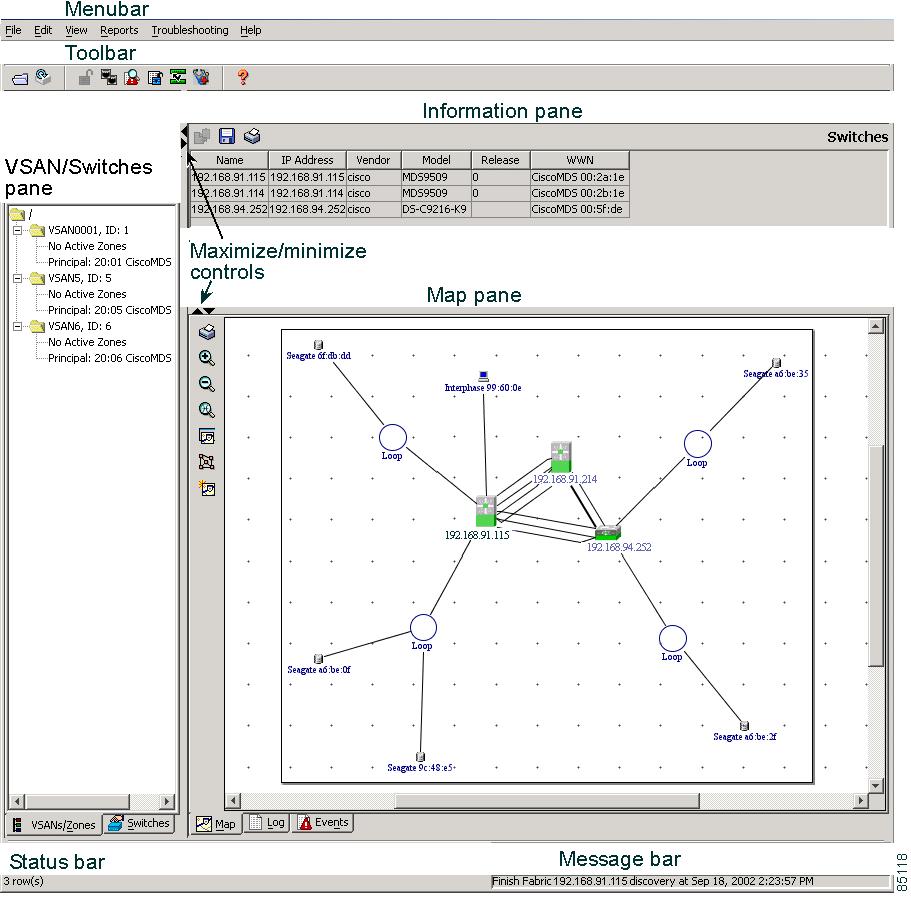
The Fabric Manager displays a view of your network fabric, including Cisco 9000 or third-party switches and end devices. To launch the Fabric Manager from your desktop, double-click the Fabric Manager icon and follow the instructions described in the "Launching Views" section. Figure 2-1 shows the Fabric Manager main window.
Note
Figure 2-1 Fabric Manager Main Window
The menu bar at the top of the Fabric Manager window provides access to options, that are organized by menus. The toolbar provides icons that duplicate the most commonly used options on the File, Tools, and Help menus.
The main window has a menu bar, toolbar, message bar, status bar, and three panes:
•
•
•
You can resize each pane by dragging the boundaries between each region or by clicking the Minimize or Maximize controls. (See Figure 2-1.)
Menu Bar, Toolbars, and Message Bar
The menu bar at the top of the Fabric Manager window provides options for managing and troubleshooting the current fabric and for controlling the display of information on the Map pane. The menu bar provides the following menus:
•
•
•
•
•
•
The Fabric Manager main toolbar provides buttons for accessing the most commonly used menu bar options. The Map pane toolbar provides buttons for managing the appearance of the map. The Information pane toolbar provides buttons for editing and managing the Information pane.
The message bar shows the last entry displayed by the discovery process, and the possible error message. It displays a dialog stating that something has changed in the fabric and a new discovery is needed. The status bar shows both short-term, transient messages (such as the number of rows displayed in the table), and long-term discovery issues.
VSAN/Switch Pane
Use the VSAN tab on the VSAN/Switch pane to manage VSANs and zones in the currently discovered fabric. For information about managing VSANs see "Managing VSANs."
To manage zones, right-click one of the folders in the VSAN tree and click Edit Zones from the pop-up menu. You see the Edit Zones dialog box. For information about managing zones and zone sets, see "Managing Zones and Zone Sets."
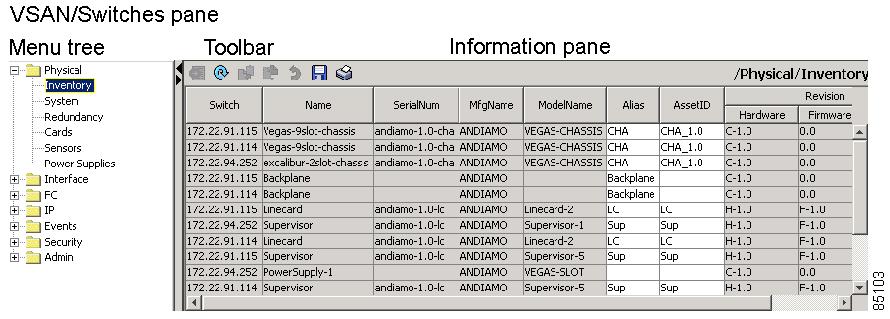
Use the Switch tab on the VSAN/Switch pane to display a menu tree of the options available for managing the switches in the currently discovered fabric. You see the menu tree shown in Figure 2-2.
Figure 2-2 Menu Tree and Dialog Box
To select an option, click a folder to display the options available and then click the option. You see the dialog box for the selected option in the Information pane. The menu tree provides the following main folders:
•
•
•
•
•
•
•
Information Pane
The Information pane displays tables or other information associated with the option selected from the menu tree. The Information pane toolbar provides buttons for performing one or more of the following operations:
•
•
•
•
•
Note
•
•
•
•
•
Note
Map Pane
There are three tabs on the bottom of the Map pane:
•
•
When you right-click an icon, you see a pop-up menu with options that vary depending on the type of icon selected. The various options available for different objects include the following:
•
•
•
•
•
•
•
•
•
The Map pane has its own toolbar with options for saving, printing, and changing the appearance of the map. When you right-click on the map, a pop-up menu appears that provides options (duplicated on the toolbar) for changing the appearance of the map.
Note
Locating Other Switches
The Locate Switches option uses SNMPv2 and discovers devices responding to SNMP requests with the read-only community string public. To enable your Cisco MDS 9000 Family switches to respond to SNMPv2 requests, see "Managing Administrator Access."
To locate switches that are not included in the currently discovered fabric, follow these steps:
Step 1
You see the Locate Devices dialog box.
Step 2
192.168.100.[1-254]
Multiple ranges can be specified, separated by commas. For example, to look for all the devices in the two subnets 192.168.199.0 and 192.169.100.0, use the following string:
192.168.100.[1-254], 192.169.100.[1-254]
Step 3
The default value for this string is "public."
Step 4
Step 5
Note
To manage the discovered switches, follow these steps:
Step 1
Step 2
Step 3
If the SNMPv3 Privacy feature is implemented, enter the encryption password as well.
Step 4
Step 5
Modifying Device Grouping
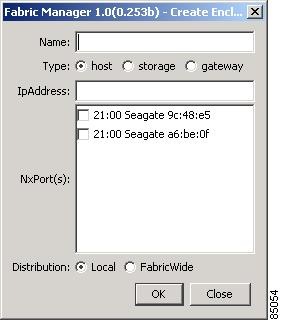
Because of not all the devices are capable of responding to FC-GS3 requests, different ports of a single server or storage subsystem may be displayed as individual end devices on the Fabric Manager map. To group end devices in a single enclosure in order to have them represented by a single icon on the map, follow these steps:
Step 1
Step 2
You see the window shown in Figure 2-3.
Figure 2-3 Create Enclosure Window
Step 3
Step 4
•
•
•
Step 5
Step 6
The list of all ports in a fabric that are not already assigned to en enclosure are shown.
Step 7
Step 8
Note
Note
Troubleshooting Switch Configuration
This section describes how to use the tools provided by the Fabric Manager and Device Manager to verify and troubleshoot fabric connectivity and switch configuration. It includes the following sections:
•
•
•
•
•
Analyzing Switch Device Health
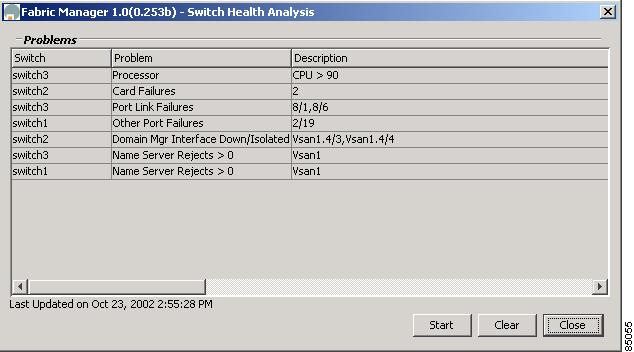
The Switch Health option lets you determine the status of the components of a specific switch.
To use the Switch Health option, follow these steps:
Step 1
You see the window shown in Figure 2-4.
Figure 2-4 Switch Health Analysis Window
Step 2
The Switch Health Analysis window displays any problems affecting the selected switches.
Step 3
Step 4
Step 5
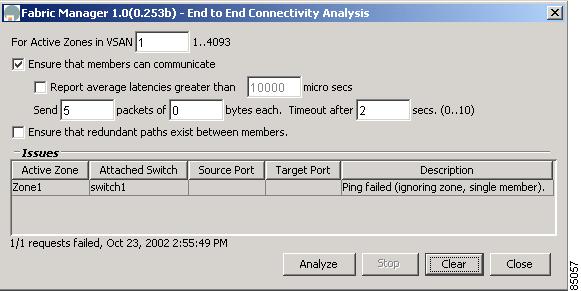
Analyzing End-to-End Connectivity
You can use the End to End Connectivity option to determine connectivity and routes among devices with the switch fabric. The connectivity tool checks to see that every pair of end devices can talk to each other, using a Ping test and by determining if they are in the same VSAN or in the same active zone.
This option uses versions of the ping and traceroute commands modified for Fibre Channel networks.
To use this option, follow these steps:
Step 1
You see the window shown in Figure 2-5.
Figure 2-5 End to End Connectivity Analysis Window
Step 2
Step 3
Step 4
Step 5
Step 6
Step 7
The End to End Connectivity Analysis window displays the selected end points with the switch to which each is attached, and the source and target ports used to connect it.
The output shows all the requests which have failed. The possible descriptions are:
•
•
•
•
•
•
•
Step 8
Step 9
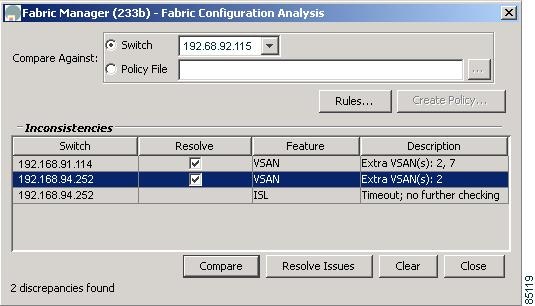
Analyzing Switch Fabric Configuration
The Fabric Configuration option lets you analyze the configuration of a switch by comparing the current configuration to a specific switch or to a policy file. You can save a switch configuration to a file and then compare all switches against the configuration in the file.
To use the Fabric Configuration option to analyze the configuration of a switch, follow these steps:
Step 1
You see the window shown in Figure 2-6.
Figure 2-6 Fabric Configuration Analysis Window
Step 2
•
•
Step 3
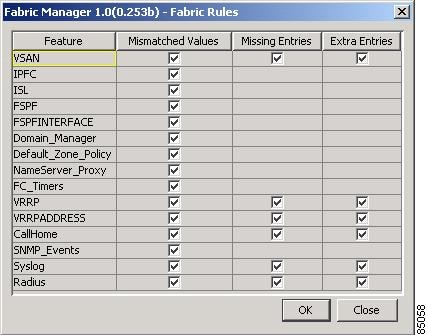
You see the window shown in Figure 2-7.
Figure 2-7 Fabric Configuration Rules
Step 4
Step 5
The system analyzes the configuration and displays issues that arise as a result of the comparison.
Step 6
Step 7
You use a policy file to define the rules to be applied when running the Fabric Configuration Analysis tool. When you create a policy file, the system saves the rules selected for the selected switch.
To create a policy file, follow these steps:
Step 1
Step 2
Step 3
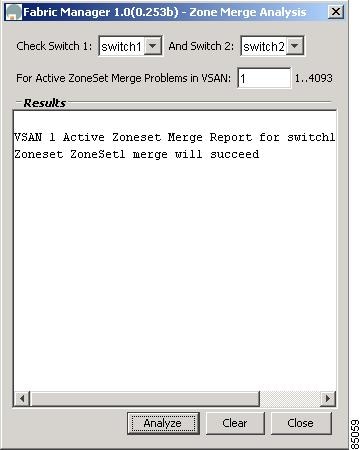
Analyzing the Results of Merging Zones
You can use the Zone Merge option on the Fabric Manager Troubleshooting menu to determine if two connected switches have compatible zone configurations.
To use the Zone Merge option, follow these steps:
Step 1
You see the window shown in Figure 2-8.
Figure 2-8 Zone Merge Analysis Window
Step 2
Step 3
Step 4
The Zone Merge Analysis window displays any inconsistencies between the zone configuration of the two selected switches.
Step 5
Step 6
Using Other Troubleshooting Tools
You can use the following options on the Troubleshooting menu to verify connectivity to a selected object or to open other management tools:
•
•
•
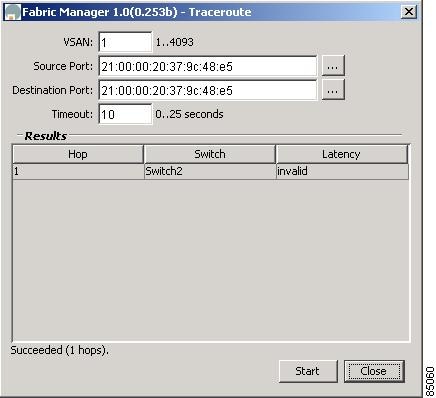
To use the Traceroute option to verify connectivity, follow these steps:
Step 1
Step 2
You see the window shown in Figure 2-9.
Figure 2-9 Traceroute Window
Step 3
Step 4
The results of the Traceroute operation appear in the Results box.
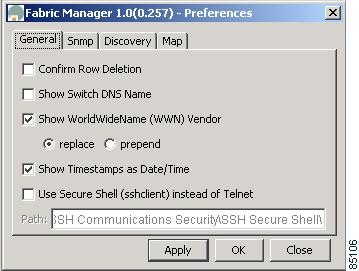
Setting Preferences
To set your preferences for the behavior of the Fabric Manager, choose File > Preferences from the Fabric Manager menu bar. You see the dialog box shown in Figure 2-10.
Figure 2-10 Fabric View Preferences
This dialog box has the following four tabs, which let you set your preferences for different components of the application:
•
•
•
•
Table 2-2 describes the configurable attributes on each tab.
Viewing Reports in Fabric Manager
The Fabric Manager provides a series of tables grouped under the Reports menu. To open the tables to view this information, click Reports on the Fabric Manager menu bar and select one of the following options:
•
•
When you select one of these options, you see the available information in tabular form in the Information pane of the Fabric Manager main window. The following sections describe the tables provided by each option.
ISL Statistics
Choose Reports > ISL Statistics from the Fabric Manager menu bar to display information about the Inter-Switch Links in the currently discovered fabric. See Table 2-3.
You can use the controls at the top of the table to change the following report parameters:
•
•
ISLs
Choose Reports > ISLs from the Fabric Manager menu bar to display information about the Inter-Switch links in the currently discovered fabric. See Table 2-4.
Switches
Choose Reports > Switches from the Fabric Manager menu tree to display information about the switches in the currently discovered fabric. See Table 2-5.
Hosts
Choose Reports > Hosts from the Fabric Manager menu tree to display information about the hosts in the currently discovered fabric. See Table 2-6.
Storage
Choose Reports > Storage from the Fabric Manager menu tree to display information about the links to hosts and storage in the currently discovered fabric. See Table 2-7.
LUNs
Choose the Reports > LUNs option from the Fabric Manager menu tree to display information about the LUNs in the currently discovered fabric. See Table 2-8.
Using Device Manager
This section describes how to use the Device Manager to manage the configuration of specific devices. It includes the following sections:
•
•
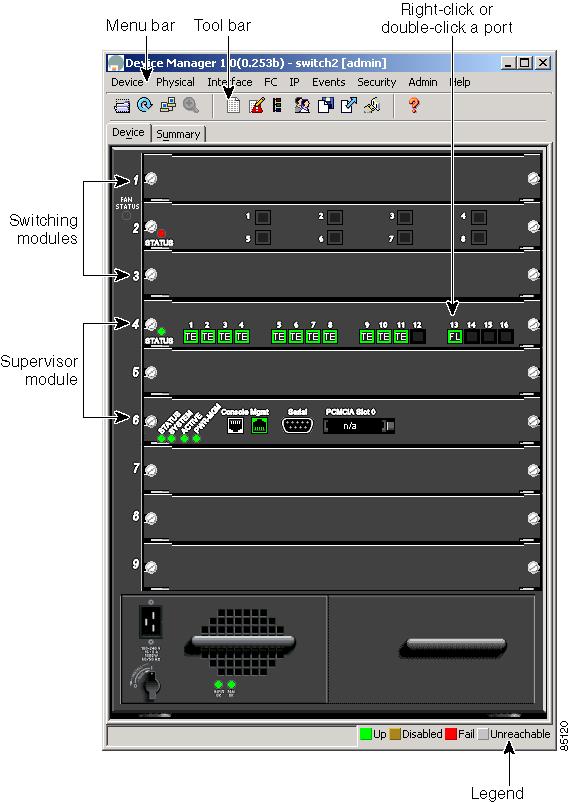
Overview of Device Manager
Device Manager provides a physical representation of your switch chassis, with the modules, ports, power supplies, and fan assemblies (Figure 2-11). The menu bar at the top of the Device Manager window provides access to options, organized into menus that correspond to the menu tree in Fabric Manager (Figure 2-12).
The legend at the bottom right of the Device Manager indicates port status, as follows:
•
•
•
•
Launching Device Manager from Fabric Manager
Device Manager gives a graphic representation of a Cisco MDS 9000 Family switch, including the installed switching modules, the supervisor modules, the power supplies, and the status of each port within each module.
To launch the Device Manager from your desktop, double-click the Device Manager icon and follow the instructions described in the "Launching Views" section.
To launch Device Manager from Fabric Manager , right-click the switch you want to manage on the Fabric Manager map and click Device Manager from the pop-up menu that appears. The Device Manager main window is shown in Figure 2-11.
Device Manager can also be started by double-clicking on a switch in the Fabric Manager topology view.
Figure 2-11 Device Manager, Deview Tab
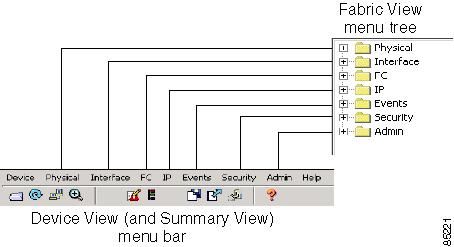
Comparing Device Manager to Fabric Manager
As shown in Figure 2-12, the menu bar at the top of the Device Manager contains the same menus as the Fabric Manager menu tree.
Figure 2-12 Device Manager Menu Bar Compared to the Fabric Manager Menu Tree
For information about the options provided by these menus, see the "VSAN/Switch Pane" section. The Device menu, which is unique to the Device View and Summary View, provides the following options:
•
•
•
•
•
•
•
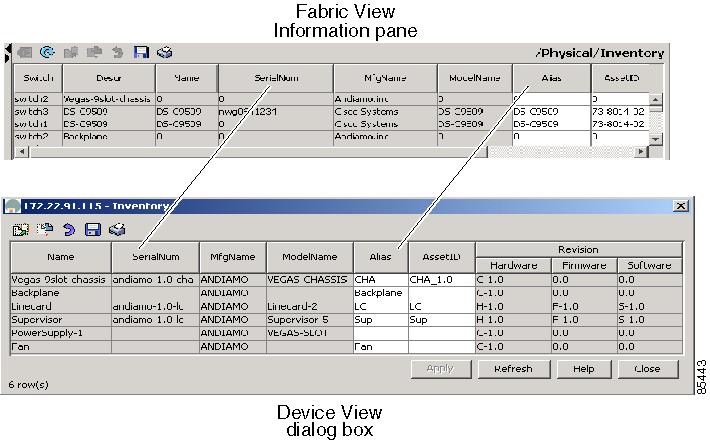
As shown in Figure 2-13, the tables in the Fabric Manager correspond to the dialog boxes that appear in Device Manager. However, the Fabric Manager tables show values for multiple switches and so the first column identifies the specific switch. The Device Manager dialog box shows values for a single switch, while the Fabric Manager shows the same values for one or more switches.
Figure 2-13 Device Manager Dialog Box Compared to Fabric Manager
The toolbar on the Device Manager dialog box provides the same options as the toolbar on the Information pane in Fabric Manager , as summarized here:
•
•
•
•
•
Note
•
•
•
Tip
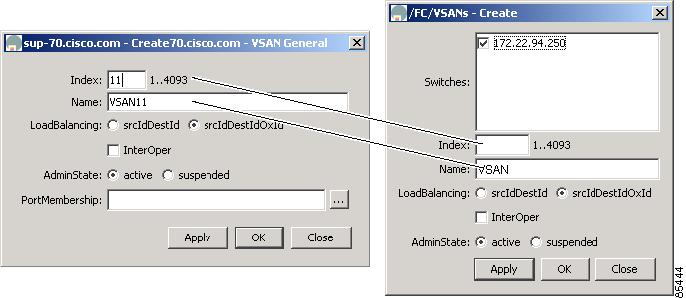
When you click the Create button, you see a dialog box that lets you enter the values required for the specific table. Figure 2-14 shows dialog boxes for creating a new VSAN. As you can see the fields and options are the same from both views, but the appearance of the window may vary slightly. For instance, the dialog box from Fabric Manager may have an option for selecting a specific switch, while the dialog box from Device Manager may have additional port-level detail.
Figure 2-14 Create Dialog Boxes in Fabric Manager and Device Manager
Managing Ports
Tip
To enable or disable a port, right-click the port and click Enable or Disable from the pop-up menu. To enable or disable multiple ports, drag the mouse to select the ports and then right-click the selected ports. Then click Enable or Disable from the pop-up menu.
To manage trunking on one or more ports, right-click the ports and click Configure. On the dialog box that appears, in the Trunk column, right-click the current value and click nonTrunk, trunk, or auto from the pull-down list.
To create PortChannels using Device Manager, click PortChannels from the Interface menu. For detailed instructions, see the "Managing PortChannel Interfaces" section. You can also use Fabric Manager to conveniently create a PortChannel.
Note
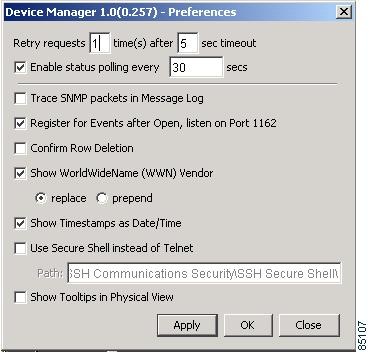
Setting Preferences
To set your preferences for the behavior of the Device Manager application, choose Preferences from the Device menu. You see the dialog box shown in
Figure 2-15 Device Manager Preferences
Table 2-9 describes the configurable attributes on this dialog box.
Using Summary View
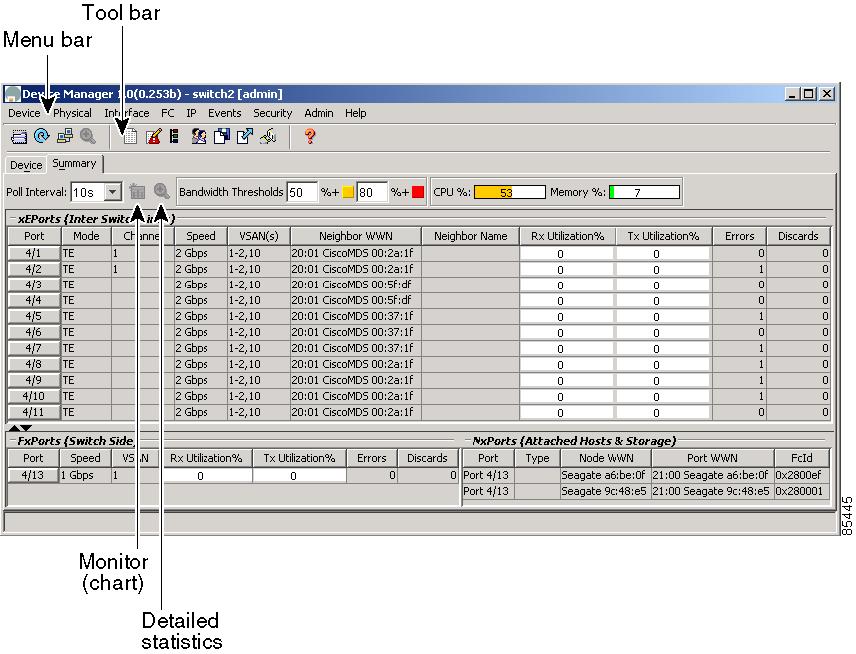
Click the Summary tab on the Device Manager main window to see a summary of xEPorts, FxPorts, and NxPorts on a single switch. Figure 2-16 shows the Summary View.
Figure 2-16 Summary View
The Summary View displays attributes for a single switch, such as port speed, link utilization, and other traffic statistics. It has the same menu bar and toolbar buttons as the Device View.
To monitor traffic for selected objects, click the Monitor icon. To display detailed statistics for selected objects, click the Detailed Statistics icon.
The Summary View provides the same menus and options that are available from the Device View and shows the display-only information described in Table 2-10.
Table 2-11 describes the configurable attributes on the Summary View.