Cisco MDS 9000 Family Fabric Manager User Guide, Release 1.0(2a)
Managing VSANs

Table Of Contents

Managing VSANs

Adding and Configuring VSANs

Controlling In-Band Management Connectivity

Configuring IP Routing for Management Traffic

Managing IPFC Connectivity with Multiple VSANs

Viewing In-Band Management Information

Viewing IP Address Information

Enabling or Disabling IP Forwarding

Viewing TCP Information and Statistics

Viewing UDP Information and Statistics

Viewing IP Statistics

Viewing ICMP Statistics

Monitoring SNMP Traffic


Managing VSANs


VSANs (virtual SANs) allow you to separate devices that are physically connected to the same fabric, and thus provide higher security and greater scalability in the network fabric. When you create VSANs, you are creating multiple logical SANs over a common physical infrastructure. After creating VSANs, you must establish IP static routes between the network segments if you are using the IP over Fibre Channel (IPFC) protocol to manage your Cisco MDS 9000 Family switches.

The Fabric Manager allows you to configure VSANs on multiple Cisco 9000 switches. The Device Manager allows you to configure VSANs on a single Cisco 9000 switch. This chapter describes how to configure VSANs using the Fabric Manager and the Device Manager.


Note For information about VSANs and configuring them using the command-line interface (CLI), refer to the Cisco 9000 Family Configuration Guide.


You can manage Cisco MDS 9000 Family switches through Ethernet connections to the management interface (mgmt 0) of each switch or by using the IPFC protocol. To use IPFC, you connect to a switch using the Ethernet management interface and establish routes from that switch to the other switches over the Fibre Channel network. When you segment the Fibre Channel network using VSANs, you must establish static routes between the network segments.

This chapter includes the following sections:

Adding and Configuring VSANs

Controlling In-Band Management Connectivity

Adding and Configuring VSANs

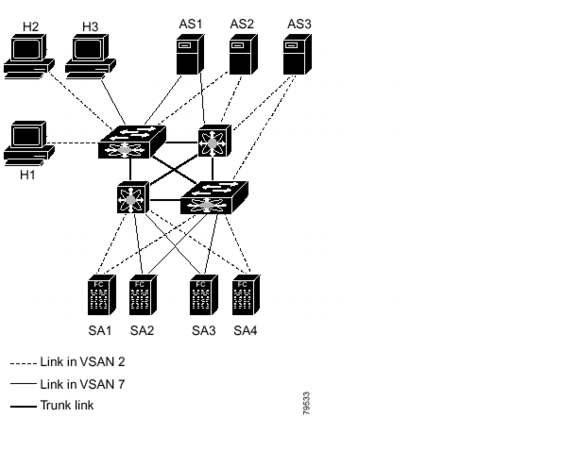
Figure 4-1 shows a physical Fibre Channel network with two VSANs. VSAN 2 is connected by dashed lines and VSAN 7 is connected by solid lines.

Figure 4-1 Configuring VSANs

VSAN 2 includes the H1 and H2 hosts, the AS2 and AS3 application servers, and the SA1 and SA4 storage arrays. VSAN 7 connects H3, AS1, SA2, and SA3. The four switches in this network are interconnected by trunk links that carry both VSAN 2 and VSAN 7 traffic.

VSAN 1 is the default VSAN for Cisco MDS 9000 Family switches. All ports are assigned by default to VSAN 1. VSAN 4094 is called the isolated VSAN. When a VSAN is deleted, any ports in that VSAN are moved to VSAN 4094.


Note We recommend that you delete or move all the ports in a VSAN before deleting the VSAN.


VSANs are enabled through trunking, which enables interconnect ports to transmit and receive frames in more than one VSAN over a single physical link, using the Extended Inter-Switch Link (EISL) protocol. The trunking protocol is enabled by default, and if disabled on a switch, no ports on that switch or directly connected to the switch will support the use of VSANs.

By default, the trunk mode is enabled on all Fibre Channel interfaces, but can be disabled on a port-by-port basis. When connected to a third-party switch, the trunk mode configuration has no effect—the ISL is always in a trunking disabled state.

Each Fibre Channel interface has an associated trunk-allowed VSAN list. This list determines the VSANs that are supported on each interface. By default, the entire range of VSANs from 1 through 4093 are allowed on any interface. You can restrict an interface to the use of a specific set of VSANs, which prevents traffic from any other VSAN being transmitted on the interface.

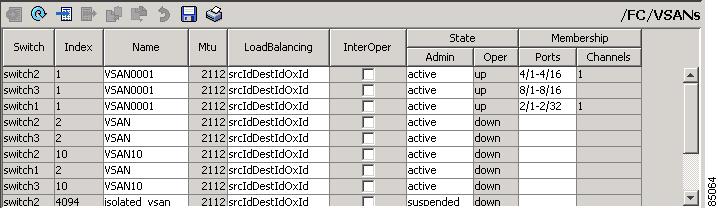
To add and configure VSANs from the Fabric Manager, choose FC > VSAN from the menu tree. Figure 4-2 shows the FC > VSAN dialog box from the Fabric Manager. This view displays VSAN attributes for multiple switches.

Figure 4-2 FC > VSANs Dialog Box, Fabric Manager

To manage VSANs from Device Manager, choose the VSAN option from the FC menu or click the VSAN icon on the toolbar. The dialog box in the Device Manager displays VSAN general attributes for a single switch.

Both dialog boxes show the display-only information described in Table 4-1.

Table 4-1 FC > VSANs—Display-Only Attributes

Display-Only Attribute
Description

Switch

Displays the switch ID. This attribute is only displayed from the Fabric Manager.

Index

Displays the VSAN ID.

Mtu

Displays the MTU (maximum transmission unit) of the VSAN. Normally, this attribute is 2112 for all VSANs with a Fibre Channel media type.


Table 4-2 lists the attributes that you can configure for the VSAN.

Table 4-2 FC > VSANs—Configurable Attributes 

Configurable Attribute
Description

Name

Specifies the name of the VSAN.

State

Specifies the state of the VSAN. Valid states are active and suspended.

InorderDelivery

Enables InorderDelivery for the VSAN. Check the checkbox to guarantee that packets are delivered in order.

LoadBalancingType

Specifies the type of load balancing used on this VSAN.

PortMembership

Specifies the ports assigned to this VSAN.


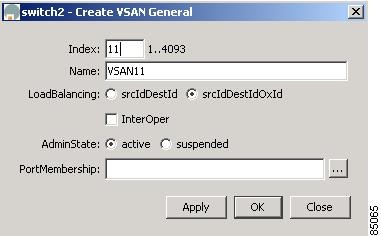
To add a VSAN from Fabric Manager, click Create on the Information pane toolbar. To add a VSAN from Device Manager, click Create on the FC > VSAN dialog box. You see the dialog box shown in Figure 4-3.

Figure 4-3 Create VSANs

Complete the fields on this dialog box and click OK to add the VSAN.

Controlling In-Band Management Connectivity

The Fabric Manager allows you to configure and monitor IP traffic on multiple Cisco MDS 9000 Family switches. The Device Manager allows you to configure and monitor IP traffic on a single Cisco 9000 switch.

Cisco MDS 9000 Family switches support both out-of-band and in-band management schemes. An Ethernet connection provides out-of-band management using Telnet, SSH or SNMP access. In-band IP management is also available using IP over Fibre Channel (IPFC). IPFC encapsulates IP packets into Fibre Channel frames so that management information can cross the Fibre Channel network without requiring a dedicated Ethernet connection to each switch. IP addresses are resolved to the Fibre Channel address through the Address Resolution Protocol (ARP).

This section includes the following topics:

Configuring IP Routing for Management Traffic

Managing IPFC Connectivity with Multiple VSANs

Viewing In-Band Management Information

Configuring IP Routing for Management Traffic

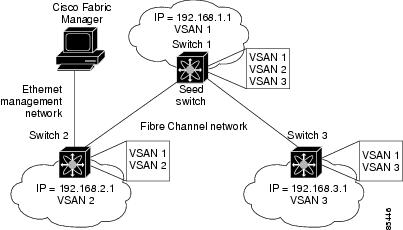
When using in-band network management over Fibre Channel links, you must ensure that a path exists from the seed switch, connected to the Cisco Fabric Manager over its Ethernet interface (mgmt0), and the other switches in the network fabric. See Figure 4-4.

Figure 4-4 IP Routing Between VSANs

To do this, make sure that the seed switch has a path to each VSAN. Each of the other switches can then be configured to use the seed switch as their default gateway. For example, in Figure 4-4, switch 1 is connected to VSAN 2 and VSAN 3, while switch 2 and switch 3 are configured to use switch 1 as their default gateway.

You can also configure static routes on a point-to-point basis from one switch to another. In this example, you would configure a static route on both switch 2 and switch 3 to switch 1.

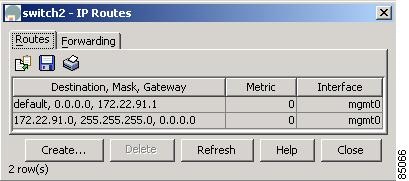
To configure an IP route or identify the default gateway, choose IP Routes from the Device Manager IP menu. You see the window shown in Figure 4-5.

Figure 4-5 IP Routes

Table 4-3 describes the configurable attributes for IP routes.

Table 4-3 IP > IP Routes—Configurable Attributes 

Configurable Attribute
Description

Destination

Specifies the destination for the route.

Mask

Specifies the mask for the interface.

Gateway

Specifies the default gateway for the switch.

Metric

Specifies the primary routing metric for this route.

Interface

Specifies the interface that exchanges management traffic.


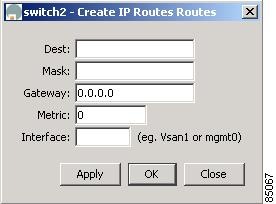
To create a new IP route or identify the default gateway on a switch, click the Create button.

You see the window shown in Figure 4-6.

Figure 4-6 Create IP Routes

Complete the fields on this window and click OK to add an IP route.

To configure a static route, enter the destination network ID and subnet mask in the Dest and Mask fields. To configure a default gateway, enter the IP address of the seed switch in the Gateway field.

Managing IPFC Connectivity with Multiple VSANs

To configure IPFC, choose VSAN from the Device Manager FC menu and click the IP FC tab.

The IP > IP FC dialog boxes show the display-only information described in Table 4-4.

Table 4-4 FC > VSAN > IP FC—Display-Only Attributes 

Display-Only Attribute
Description

Switch

Displays the switch ID. This attribute is only displayed from the Fabric Manager.

VSAN

Displays the VSAN ID.

IpAddress/Mask

Displays the IP address and mask for the interface.

FcId

Displays the Fibre Channel identifier for this interface.

Status—Oper

Displays the current operational status of the interface. Valid values are up, down, and disabled.

Status—Cause

Displays the cause for the current operational status.


Table 4-5 describes the configurable attributes for IPFC.

Table 4-5 FC > VSAN > IP FC—Configurable Attributes

Configurable Attribute
Description

Mtu

Specifies the maximum transmission unit (MTU)- for the interface.

Admin

Specifies the desired state of the interface. Valid values are up and disabled.


Viewing In-Band Management Information

This section describes how to monitor different types of IP management traffic over the Fibre Channel network. It includes the following topics:

Viewing IP Address Information

Enabling or Disabling IP Forwarding

Viewing TCP Information and Statistics

Viewing UDP Information and Statistics

Viewing IP Statistics

Viewing ICMP Statistics

Monitoring SNMP Traffic

Viewing IP Address Information

To view IP addresses of the switches in the current fabric, choose IP > Addresses from the Fabric Manager menu tree. The dialog box from displays IP address information for multiple switches.

Table 4-6 IP > IP Addresses 

Attribute
Description

Switch

Displays the identity of the switch.

Interface, IpAddress

Displays the interface on the switch and the IP address assigned to it.

MaskLength

Displays the length of the subnet mask assigned to the interface.


Enabling or Disabling IP Forwarding

To view or change the IP forwarding configuration of the switches in the current fabric, choose IP > Forwarding from the Fabric Manager menu tree. The dialog box shows the display-only and configurable attributes described in Table 4-7.

Table 4-7 IP > IP Addresses 

Attribute
Description

Switch

Displays the identity of the switch.

RoutingEnabled

Determines if IP forwarding is enabled on the switch.


To enable IP forwarding for a specific switch, click the RoutingEnabled check box.

Viewing TCP Information and Statistics

To view TCP information from the Device Manager, choose TCP/UDP from the IP menu. The dialog box shows the display-only attributes described in Table 4-8.

Table 4-8 IP > TCP/UDP > TCP—Display-Only Attributes

Display-Only Attribute
Description

Local IP, Port, Remote IP, Port

Displays the local IP port ID and remote IP port ID.

State

Displays the state of the TCP connection.


To monitor TCP statistics from the Fabric Manager, choose IP > Statistics > TCP from the menu tree. To monitor TCP statistics from the Device Manager, choose Statistics from the IP menu and view the TCP tab. The dialog boxes in Fabric Manager and Device Manager show the display-only attributes described in Table 4-9.

Table 4-9 IP > Statistics > TCP—Display-Only Attributes 

Display-Only Attribute
Description

Switch

Displays the identity of the switch (Fabric Manager only).

ActiveOpens

Displays the number of times TCP connections have made a direct transition from the CLOSED state to the SYN-SENT state.

PassiveOpens

Displays the number of times TCP connections have made a direct transition from the LISTEN state to the SYN-RCVD state.

AttemptFails

Displays the number of times TCP connections have made a direct transition from either the SYN-SENT state or the SYN-RCVD state to the CLOSED state.

Also displays the number of times TCP connections have made a direct transition from the SYN-RCVD state to the LISTEN state.

EstabResets

Displays the number of times TCP connections have made a direct transition from either the ESTABLISHED state or the CLOSE-WAIT state to the CLOSED state.

InSegs

Displays the total number of segments received, including those received in error. This count includes segments received on currently established connections.

OutSegs

Displays the total number of segments sent, including those on current connections but excluding those containing only retransmitted octets.

RetransSegs

Displays the total number of segments retransmitted; that is, the number of TCP segments transmitted containing one or more previously transmitted octets.

InErrs

Displays the total number of segments received in error; for example, bad TCP checksums.

OutRsts

Displays the number of TCP segments sent containing the RST (reset) flag.


Viewing UDP Information and Statistics

To view User Datagram Protocol (UDP) information from the Device Manager, choose TCP/UDP from the IP menu and click the UDP tab. The dialog box shows the display-only attributes described in Table 4-10.

Table 4-10 IP > TCP/UDP > UDP—Display-Only Attributes

Display-Only Attribute
Description

IpAddress

Displays the IP address of the UDP listener.

Port

Displays the local port number of the UDP listener.


To monitor UDP traffic from the Fabric Manager, choose IP > Statistics > UDP from the menu tree. To monitor UDP statistics from Device Manager, choose Statistics from the IP menu and click the UDP tab.

The Fabric Manager dialog box displays TCP traffic information for multiple switches. The Device Manager dialog box displays information for a single switch. Both dialog boxes show the display-only attributes described in Table 4-11.

Table 4-11 IP > Statistics > UDP—Display-Only Attributes 

Display-Only Attribute
Description

InDatagrams

Displays the total number of UDP datagrams delivered to UDP users.

NoPorts

Displays the total number of UDP datagrams received for which there was no application at the destination port.

InErrors

Displays the number of UDP datagrams received that could not be delivered for reasons other than the lack of an application at the destination port.

OutDatagrams

Displays the total number of UDP datagrams sent.


Viewing IP Statistics

To monitor statistics from the Fabric Manager, choose IP > Statistics > IP. The Fabric Manager dialog box displays IP statistics for multiple switches.

To monitor IP statistics from Device Manager, select Statistics from the IP menu and click the IP tab. The Device Manager dialog box displays information for a single switch.

Both dialog boxes show the display-only attributes described in Table 4-12.

Table 4-12 IP > Statistics > IP—Display-Only Attributes 

Display-Only Attribute
Description

InReceives

Displays the total number of input datagrams received from interfaces, including those received in error.

InHdrErrors

Displays the number of input datagrams discarded due to errors in their IP headers, including:

Bad checksums

Version number mismatch

Format errors

Time-to-live exceeded

Errors discovered in processing their IP options

InAddrErrors

Displays the number of input datagrams discarded because the IP address in their IP header's destination field was not a valid address to be received.

This count includes invalid addresses (for example, 0.0.0.0) and addresses of unsupported classes (for example, class E).

For devices that are not IP routers and do not forward datagrams, this counter includes datagrams discarded because the destination address was not a local address.

ForwDatagrams

Displays the number of input datagrams for which this device was not their final IP destination. As a result, an attempt was made to find a route to forward them to that final destination.

In devices that do not act as IP routers, this counter includes only those packets that were source-routed through this device and the source-route option processing was successful.

InUnknownProtos

Displays the number of locally addressed datagrams that were received successfully, but were discarded because of an unknown or unsupported protocol.

InDiscards

Displays the number of input IP datagrams for which no problems were encountered to prevent their continued processing, but which were discarded (for example, for lack of buffer space).

This counter does not include any datagrams discarded while awaiting reassembly.

InDelivers

Displays the total number of input datagrams that were delivered successfully to IP user protocols, including Internet Control Message Protocol (ICMP).

OutRequests

Displays the total number of IP datagrams supplied to IP by local IP user protocols (including ICMP), during requests for transmission.

This counter does not include any datagrams counted in the ForwDatagrams attribute.

OutDiscards

Displays the number of output IP datagrams for which no problem was encountered to prevent their transmission to their destination, but which were discarded (for example, for lack of buffer space).

This counter includes datagrams counted in the ForwDatagrams attribute, if any of these packets meet the discard criterion.

OutNoRoutes

Displays the number of IP datagrams discarded because no route could be found to transmit them to their destination.

This counter includes any packets counted in the ForwDatagrams attribute, which meet this no-route criterion. This includes any datagrams that a host cannot route because all of its default routers are down.

FragOKs

Displays the number of IP datagrams that have been successfully fragmented.

FragFails

Displays the number of IP datagrams that have been discarded because they needed to be fragmented, but could not be; for example, because their "Don't Fragment" flag was set.

FragCreates

Displays the number of IP datagram fragments that have been generated as a result of fragmentation.

ReasmReqds

Displays the number of IP fragments received that needed to be reassembled.

ReasmOKs

Displays the number of IP datagrams reassembled successfully.

ReasmFails

Displays the number of failures detected by the IP reassembly algorithm, due to timeout or errors.

This is not necessarily a count of discarded IP fragments, because some algorithms can lose track of the number of fragments by combining them as they are received.


Viewing ICMP Statistics

To monitor statistics for ICMP packets received, select IP > Statistics > ICMP > In from the Fabric Manager menu tree. To monitor statistics for ICMP packets transmitted from the Fabric Manager, select IP > Statistics > ICMP > Out from the Fabric Manager menu tree.

To monitor ICMP statistics from Device Manager, select Statistics from the IP menu and click the ICMP tab.

The Fabric Manager dialog box displays information for multiple switches. The Device Manager dialog box displays information for a single switch.

Table 4-13 describes the information displayed by both dialog boxes. In the Device Manager, a prefix (In or Out) identifies whether the packets are received or transmitted. In the Fabric Manager, separate dialog boxes are provided for incoming and outbound ICMP traffic and this prefix is omitted.

Table 4-13 IP > Statistics > ICMP—Display-Only Attributes 

Display-Only Attribute
Description

InSrcQuenchs

Displays the number of ICMP source quench messages received.

InRedirects

Displays the number of ICMP redirect messages received.

InEchos

Displays the number of ICMP echo request messages received.

InEchoReps

Displays the number of ICMP echo reply messages received.

InTimestamps

Displays the number of ICMP timestamp request messages received

InTimestampReps

Displays the number of ICMP timestamp reply messages received.

InAddrMasks

Displays the number of ICMP address mask request messages received.

InAddrMaskReps

Displays the number of ICMP address mask reply messages received.

InParmProbs

Displays the number of ICMP parameter problem messages received.

InDestUnreachs

Displays the number of ICMP destination unreachable messages received.

InTimeExcds

Displays the number of ICMP time exceeded messages received.

OutSrcQuenchs

Displays the number of ICMP source quench messages sent.

OutRedirects

Displays the number of ICMP redirect messages sent. For a host, this attribute is always zero (0), because hosts do not send redirects.

OutEchos

Displays the number of ICMP echo request messages sent.

OutEchoReps

Displays the number of ICMP echo reply messages sent.

OutTimestamps

Displays the number of ICMP timestamp request messages sent.

OutTimestampReps

Displays the number of ICMP timestamp reply messages sent.

OutAddrMasks

Displays the number of ICMP address mask request messages sent.

OutAddrMaskReps

Displays the number of ICMP address mask reply messages sent.

OutParmProbs

Displays the number of ICMP parameter problem messages sent.

OutDestUnreachs

Displays the number of ICMP destination unreachable messages sent.

OutTimeExcds

Displays the number of ICMP time exceeded messages sent.


Monitoring SNMP Traffic

To monitor statistics from the Fabric Manager, select IP > Statistics > SNMP. To monitor SNMP traffic from Device Manager, select Statistics from the IP menu and click the SNMP tab.

The Fabric Manager dialog box displays information for multiple switches. The Device Manager dialog box displays information for a single switch. Both dialog boxes show the display-only attributes described in Table 4-14.

Table 4-14 IP > Statistics > SNMP—Display-Only Attributes 

Display-Only Attribute
Description

InPkts

Displays the total number of messages delivered by the transport service.

InBadVersions

Displays the total number of SNMP messages for an unsupported version of SNMP that were delivered.

InBadCommunityNames

Displays the total number of SNMP messages delivered that used an unknown SNMP community name.

InBadCommunityUses

Displays the total number of SNMP messages that represented an SNMP operation that was not allowed by the SNMP community named in the message.

InASNParseErrs

Displays the total number of ASN.1 or BER (bit error rate) errors encountered when decoding received SNMP messages.

SilentDrops

Displays the total number of the following protocol data units (PDUs) that were delivered and were dropped silently:

GetRequest-PDUs

GetNextRequest-PDUs

GetBulkRequest-PDUs

SetRequest-PDUs

InformRequest-PDUs

These PDUs were dropped because the size of a reply containing an alternate Response-PDU with an empty variable-bindings field was greater than either a local constraint or the maximum message size associated with the originator of the request.

ProxyDrops

Displays the total number of the following PDUs that were delivered and were dropped silently:

GetRequest-PDUs

GetNextRequest-PDUs

GetBulkRequest-PDUs

SetRequest-PDUs

InformRequest-PDUs

These PDUs were dropped because the transmission of the (possibly translated) message to a proxy target failed in a manner (other than a timeout), such that no Response-PDU could be returned.