
 Feedback
Contents
- Detecting and Analyzing Network Threats With NetFlow
- Finding Feature Information
- Prerequisites for Detecting and Analyzing Network Threats With NetFlow
- Information About Detecting and Analyzing Network Threats With NetFlow
- NetFlow Layer 2 and Security Monitoring
- Layer 3 Information Capture Using NetFlow Layer 2 and Security Monitoring Exports
- Layer 2 Information Capture Using NetFlow Layer 2 and Security Monitoring Exports
- Layer 2 MAC Address Fields
- Layer 2 VLAN ID Fields
- NetFlow Top Talkers
- Comparison of the NetFlow Dynamic Top Talkers CLI and NetFlow Top Talkers Features
- NetFlow Dynamic Top Talkers CLI
- NetFlow Top Talkers
- Filtering and Sampling of NetFlow Traffic
- NetFlow Input Filters Flow Classification
- Random Sampled NetFlow Sampling Mode
- Random Sampled NetFlow The NetFlow Sampler Map
- How to Configure and Use NetFlow to Detect and Analyze Network Threats
- Prerequisites
- Configuring NetFlow Layer 2 and Security Monitoring Exports
- Verifying NetFlow Layer 2 and Security Monitoring Exports
- Restrictions
- Using NetFlow Dynamic Top Talkers CLI to Display the Protocol Distribution
- Using NetFlow Dynamic Top Talkers CLI to Display the Source IP Address Top Talkers Sending ICMP Traffic
- Using NetFlow Dynamic Top Talkers CLI to Display the Destination IP Address Top Talkers Receiving ICMP Traffic
- Configuring NetFlow Top Talkers to Monitor Network Threats
- Monitoring and Analyzing the NetFlow Top Talkers Flows
- Configuring NetFlow Filtering and Sampling
- Verify NetFlow Filtering and Sampling
- Monitoring and Analyzing the Sampled and Filtered NetFlow Top Talkers Flows
- Configuration Examples for Detecting and Analyzing Network Threats With NetFlow
- Configuring NetFlow Layer 2 and Sec Mon Exports to Capture Traffic From a Simulated FTP Attack Example
- Analyze an FTP DoS Attack Using the show ip cache verbose flow command Example
- Analyze an FTP DoS Attack Using NetFlow Dynamic Top Talkers CLI Example
- Configuring NetFlow Layer 2 and Sec Mon Exports to Capture Traffic From a Simulated ICMP Attack Example
- Analyze an ICMP Ping DoS Attack Using the show ip cache verbose flow command Example
- Analyze an ICMP Ping DoS Attack Using NetFlow Dynamic Top Talkers CLI Example
- Configure NetFlow Filtering and Sampling Example
- Where to Go Next
- Additional References
- Feature Information for Detecting and Analyzing Network Threats With NetFlow
- Glossary
Detecting and Analyzing Network Threats With NetFlow
This document contains information about and instructions for detecting and analyzing network threats such as denial of service attacks (DoS) through the use of the following NetFlow features:
- NetFlow Layer 2 and Security Monitoring Exports--This feature improves your ability to detect and analyze network threats such as denial of service attacks (DoS) by adding 9 fields that NetFlow can capture the values from.A few examples are:
- NetFlow Dynamic Top Talkers CLI--This feature gives you an overview of the highest volume traffic in your network by aggregating flows on a common field. For example, you can aggregate all of the flows for a destination network by aggregating them on the destination prefix. There are over 20 fields from flows that you can aggregate the highest volume traffic on. A few examples are:
- NetFlow Top Talkers--This feature gives you a more detailed view of the traffic in your network than the NetFlow Dynamic Top Talkers CLI feature because it looks at individual flows. You use the NetFlow Dynamic Top Talkers CLI feature to quickly identify high volume traffic of interest. You use the NetFlow Top Talkers feature to obtain more detailed information on each of the flows in the high volume traffic.
- NetFlow Input Filters--This feature tracks a specific subset of NetFlow traffic for the purpose of class-based traffic analysis and monitoring. This feature is used in conjunction with the Top Talkers feature to help you focus your analysis on the traffic that might be a network threat such as a DoS attack.
- Random Sampled NetFlow--This feature is typically used for statistical sampling of network traffic for traffic engineering or capacity planning purposes. It is used in the context of monitoring and analyzing network threats because it can be used to reduce the impact on the router using NetFlow to monitor traffic that might be a network threat, such as a DoS attack.
- Finding Feature Information
- Prerequisites for Detecting and Analyzing Network Threats With NetFlow
- Information About Detecting and Analyzing Network Threats With NetFlow
- How to Configure and Use NetFlow to Detect and Analyze Network Threats
- Configuration Examples for Detecting and Analyzing Network Threats With NetFlow
- Where to Go Next
- Additional References
- Feature Information for Detecting and Analyzing Network Threats With NetFlow
- Glossary
Finding Feature Information
Your software release may not support all the features documented in this module. For the latest feature information and caveats, see the release notes for your platform and software release. To find information about the features documented in this module, and to see a list of the releases in which each feature is supported, see the Feature Information Table at the end of this document.
Use Cisco Feature Navigator to find information about platform support and Cisco software image support. To access Cisco Feature Navigator, go to www.cisco.com/go/cfn. An account on Cisco.com is not required.
Prerequisites for Detecting and Analyzing Network Threats With NetFlow
Before you can use NetFlow for detecting and analyzing network threats you need to understand NetFlow and how to configure your router to capture IP traffic status and statistics using NetFlow. See the Cisco IOS NetFlow Overview and Configuring NetFlow and NetFlow Data Export modules for more details.
NetFlow and Cisco Express Forwarding (CEF) or distributed CEF (dCEF) must be configured on your system before you enable NetFlow.
Information About Detecting and Analyzing Network Threats With NetFlow
- NetFlow Layer 2 and Security Monitoring
- NetFlow Top Talkers
- Filtering and Sampling of NetFlow Traffic
NetFlow Layer 2 and Security Monitoring
The Layer 2 and Layer 3 fields supported by the NetFlow Layer 2 and Security Monitoring Exports feature increase the amount of information that can be obtained by NetFlow about the traffic in your network. You can use the network traffic information for applications such as traffic engineering and usage-based billing.
Layer 3 fields captured by the NetFlow Layer 2 and Security Monitoring Exports feature improve the capabilities of NetFlow for identifying DoS attacks. Layer 2 IP header fields help identify the path that the DoS attack is taking through the network.
Layer 2 and Layer 3 fields are not key fields. They provide additional information about the traffic in an existing flow. Changes in the values of NetFlow key fields, such as the source IP address, from one packet to the next packet results in the creation of a new flow. For example, if the first packet captured by NetFlow has a source IP address of 10.34.0.2 and the second packet captured has a source IP address of 172.16.213.65, NetFlow will create two separate flows.
Most DoS attacks consist of an attacker sending the same type of IP datagram repeatedly, in an attempt to overwhelm target systems. In such cases, the incoming traffic often has similar characteristics, such as the same values in each datagram for one or more fields that the NetFlow Layer 2 and Security Monitoring Exports feature can capture.
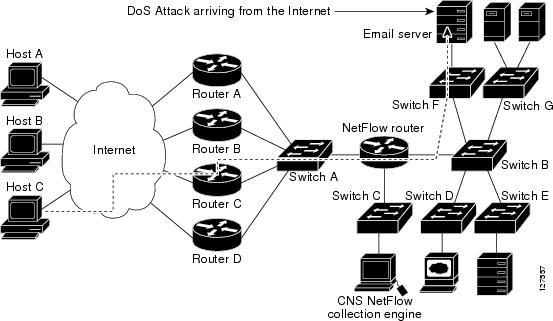
The originator of DoS attacks cannot be easily identified because the IP source address of the device sending the traffic is usually forged. However, you can easily trace the traffic back through the network to the router on which it is arriving by using the NetFlow Layer 2 and Security Monitoring Exports feature to capture the MAC address and VLAN-ID fields. If the router on which traffic is arriving supports NetFlow, you can configure the NetFlow Layer 2 and Security Monitoring Exports feature on it to identify the interface on which the traffic is arriving. The figure below shows an example of an attack in progress.
 Note | You can analyze the data captured by NetFlow directly from the router by using the show ip cache verbose flow command or by the Cisco Network Services (CNS) NetFlow Collector Engine. |
Once you have concluded that a DoS attack is taking place by analyzing the Layer 3 fields in the NetFlow flows, you can analyze the Layer 2 fields in the flows to discover the path that the DoS attack is taking through the network.
An analysis of the data captured by the NetFlow Layer 2 and Security Monitoring Exports feature, for the scenario shown in the above figure, indicates that the DoS attack is arriving on Router C, because the upstream MAC address is from the interface that connects Router C to Switch A. It is also evident that there are no routers between the target host (the e-mail server) and the NetFlow router, because the destination MAC address of the DoS traffic that the NetFlow router is forwarding to the e-mail server is the MAC address of the e-mail server.
You can learn the MAC address that Host C is using to send traffic to Router C by configuring the NetFlow Layer 2 and Security Monitoring Exports feature on Router C. The source MAC address will be from Host C. The destination MAC address will be for the interface on the NetFlow router.
Once you know the MAC address that Host C is using and the interface on Router C on which Host C's DoS attack is arriving, you can mitigate the attack by reconfiguring Router C to block Host C's traffic. If Host C is on a dedicated interface, you can disable the interface. If Host C is using an interface that carries traffic from other users, you must configure your firewall to block Host C's traffic, but still allow the traffic from the other users to flow through Router C.
- Layer 3 Information Capture Using NetFlow Layer 2 and Security Monitoring Exports
- Layer 2 Information Capture Using NetFlow Layer 2 and Security Monitoring Exports
- Layer 2 Information Capture Using NetFlow Layer 2 and Security Monitoring Exports
- Layer 3 Information Capture Using NetFlow Layer 2 and Security Monitoring Exports
Layer 3 Information Capture Using NetFlow Layer 2 and Security Monitoring Exports
The five fields that the NetFlow Layer 2 and Security Monitoring Exports feature captures from Layer 3 IP traffic in a flow are the following:
- Internet Control Message Protocol (ICMP) type and code
- ID field
- Fragment offset
- Packet length field
- Time-to-live field
Figure 5 shows the fields in an IP packet header.

Table 4 describes the header fields in Figure 5.
| Table 1 | IP Packet Header Fields |
Figure 6 shows the fields in an ICMP datagram.
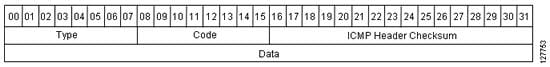
Table 5 interprets the packet format in the figure seen above. ICMP datagrams are carried in the data area of an IP datagram, after the IP header.
| Table 2 | ICMP Packet Format |
|
Type |
Name |
Codes |
|---|---|---|
|
0 |
Echo reply |
0--None. |
|
1 |
Unassigned |
-- |
|
2 |
Unassigned |
-- |
|
3 |
Destination unreachable |
0--Network unreachable. 1--Host unreachable. 2--Protocol unreachable. 3--Port unreachable. 4--Fragmentation needed and don't fragment (DF) bit set. 5--Source route failed. 6--Destination network unknown. 7--Destination host unknown. 8--Source host isolated. 9--Communication with the destination network is administratively prohibited. 10--Communication with the destination host is administratively prohibited. 11--Destination network unreachable for ToS. 12--Destination host unreachable for ToS. |
|
4 |
Source quench |
0--None. |
|
5 |
Redirect |
0--None. 0--Redirect datagram for the network. 1--Redirect datagram for the host. 2--Redirect datagram for the ToS and network. 3--Redirect datagram for the ToS and host. |
|
6 |
Alternate host address |
0--Alternate address for the host. |
|
7 |
Unassigned |
-- |
|
8 |
Echo |
0--None. |
|
9 |
Router advertisement |
0--None. |
|
10 |
Router selection |
0--None. |
|
11 |
Time exceeded |
0--Time to live exceeded in transit. |
|
12 |
Parameter problem |
0--Pointer indicates the error. 1--Missing a required option. 2--Inappropriate length. |
|
13 |
Timestamp |
0--None. |
|
14 |
Timestamp reply |
0--None. |
|
15 |
Information request |
0--None. |
|
16 |
Information reply |
0--None. |
|
17 |
Address mask request |
0--None. |
|
18 |
Address mask reply |
0--None. |
|
19 |
Reserved (for security) |
-- |
|
20-29 |
Reserved (for robustness experiment) |
-- |
|
30 |
Trace route |
-- |
|
31 |
Datagram conversion error |
-- |
|
32 |
Mobile host redirect |
-- |
|
33 |
IPv6 where-are-you |
-- |
|
34 |
IPv6 I-am-here |
-- |
|
35 |
Mobile registration request |
-- |
|
36 |
Mobile registration reply |
-- |
|
37-255 |
Reserved |
-- |
Layer 2 Information Capture Using NetFlow Layer 2 and Security Monitoring Exports
The NetFlow Layer 2 and Security Monitoring Exports feature can capture the values of the MAC address and VLAN ID fields from flows. The two supported VLAN types are 802.1q and the Cisco Inter-Switch Link (ISL) protocol.
Layer 2 MAC Address Fields
The Layer 2 fields for which the NetFlow Layer 2 and Security Monitoring Exports feature captures the values are as follows:
- The source MAC address field from frames that are received by the NetFlow router.
- The destination MAC address field from frames that are transmitted by the NetFlow router.
- The VLAN ID field from frames that are received by the NetFlow router.
- The VLAN ID field from frames that are transmitted by the NetFlow router.
Figure 2 shows the Ethernet Type II and Ethernet 802.3 frame formats. The destination address field and the source address field in the frame formats are the MAC address values that are captured by NetFlow.
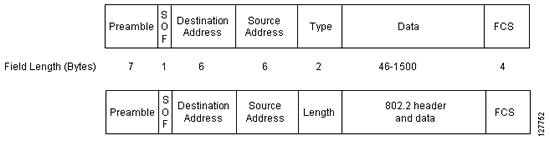
Table 1 explains the fields for the Ethernet frame formats.
| Table 3 | Ethernet Type II and 802.3 Frame Fields |
|
Field |
Description |
|---|---|
|
Preamble |
The entry in the Preamble field is an alternating pattern of 0s and 1s that communicates to receiving stations about an incoming frame. It also provides a means for the receiving stations to synchronize their clocks with the incoming bit stream. |
|
SOF (Start of frame) |
The SOF field holds an alternating pattern of 0s and 1s, ending with two consecutive 1s, indicating that the next bit is the first bit of the first byte of the destination MAC address. |
|
Destination Address |
The 48-bit destination address identifies which station on the LAN should receive the frame. The first two bits of the destination MAC address are reserved for the following special functions:
The remaining 46 bits form a uniquely assigned value that identifies a single station, a defined group of stations, or all stations on the network. |
|
Source Address |
The 48-bit source address identifies which station transmitted the frame. The source address is always an individual address, and the leftmost bit in the Source Address field is always 0. |
|
Type or Length |
Type--In an Ethernet Type II frame, a part of the frame is used for the Type field. The Type field is used to identify the next layer protocol in the frame. Length--In an 802.3 Ethernet frame, a part of the frame is used for the Length field. The Length field is used to indicate the length of the Ethernet frame. The value can be from 46 to 1500 bytes. |
|
Data or 802.2 header and data |
Ethernet Type II--46 to 1500 bytes of data or 802.3/802.2--8 bytes of header and 38 to 1492 bytes of data. |
|
FCS (Frame Check Sequence) |
This field contains a 32-bit cyclic redundancy check (CRC) value, which is created by the sending station and is recalculated by the receiving station, to check for damaged frames. The FCS is generated for the destination address, source address, Type, and Data fields of the frame. The FCS does not include the data portion of the frame. |
Layer 2 VLAN ID Fields
NetFlow can capture the value in the VLAN ID field for 802.1q tagged VLANs and Cisco ISL encapsulated VLANs. This section describes the two types of VLANs, 802.1q and ISL.
Note | ISL and 802.1q are commonly called VLAN encapsulation protocols. |
Understanding 802.1q VLANs
Devices that use 802.1q insert a four-byte tag into the original frame before it is transmitted. Figure 3 shows the format of an 802.1q tagged Ethernet frame.
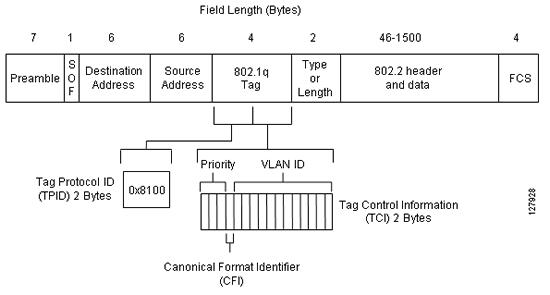
Table 2 describes the fields for 802.1q VLANs.
| Table 4 | 802.1q VLAN Encapsulation Fields |
|
Field |
Description |
|---|---|
|
Destination Address |
The 48-bit destination address identifies which stations on the LAN should receive the frame. The first two bits of the destination MAC address are reserved for the following special functions:
The remaining 46 bits form a uniquely assigned value that identifies a single station, a defined group of stations, or all stations on the network. |
|
Source Address |
The 48-bit source address identifies which station transmitted the frame. The source address is always an individual address, and the leftmost bit in the Source Address field is always 0. |
|
Type or Length |
Type--In an Ethernet Type II frame, a part of the frame is used for the Type field. The Type field is used to identify the next layer protocol in the frame. Length--In an 802.3 Ethernet frame, a part of the frame is used for the Length field. The Length field is used to indicate the length of the Ethernet frame. The value can be from 46 to 1500 bytes. |
|
Data or 802.2 header and data |
Ethernet Type II--46 to 1500 bytes of data or 802.3/802.2--8 bytes of header and 38 to 1492 bytes of data. |
|
FCS (Frame Check Sequence) |
This field contains a 32-bit cyclic redundancy check (CRC) value, which is created by the sending station and is recalculated by the receiving station, to check for damaged frames. The FCS is generated for the destination address, source address, Type, and Data fields of the frame. The FCS does not include the data portion of the frame. |
|
Tag Protocol ID (TPID) |
This 16-bit field is set to a value of 0x8100 to identify the frame as an IEEE 802.1q tagged frame. |
|
Priority |
This 3-bit field refers to the 802.1p priority. It is also known as user priority. It indicates the frame priority level used for prioritizing traffic and can represent levels 0-7. |
|
Tag Control Information |
This 2-byte Tag Control Information field consists of the following two subfields:
|
Cisco ISL VLANs
ISL is a Cisco-proprietary protocol for encapsulating frames on a VLAN trunk. Devices that use ISL add an ISL header to the frame. This process is known as VLAN encapsulation. 802.1Q is the IEEE standard for tagging frames on a VLAN trunk. Figure 4 shows the format of a Cisco ISL-encapsulated Ethernet frame.
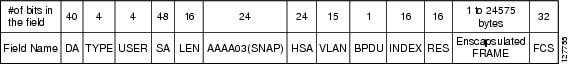
Table 3 describes the fields for 802.1q VLANs.
| Table 5 | ISL VLAN Encapsulation |
|
Field |
Description |
||
|---|---|---|---|
|
DA (destination address) |
This 40-bit field is a multicast address and is set at 0n01-00-0c-00-00 or 0n03-00-0c-00-00. The receiving host determines that the frame is encapsulated in ISL by reading the 40-bit DA field and matching it with one of the two ISL multicast addresses. |
||
|
TYPE |
This 4-bit field indicates the type of frame that is encapsulated and to indicate alternative encapsulations. TYPE codes: |
||
|
USER |
This 4-bit field is used to extend the meaning of the Frame TYPE field. The default USER field value is 0000. For Ethernet frames, the USER field bits 0 and 1 indicate the priority of the packet as it passes through the switch. Whenever traffic can be handled more quickly, the packets with this bit set should take advantage of the quicker path. However, such paths are not required. USER codes: |
||
|
SA |
This 48-bit field is the source address field of the ISL packet. It should be set to the 802.3 MAC address of the switch port transmitting the frame. The receiving device can ignore the SA field of the frame. |
||
|
LEN |
This 16-bit value field stores the actual packet size of the original packet. The LEN field represents the length of the packet in bytes, excluding the DA, TYPE, USER, SA, LEN, and FCS fields. The total length of the excluded fields is 18 bytes, so the LEN field represents the total length minus 18 bytes. |
||
|
AAAA03(SNAP) |
The AAAA03 Subnetwork Access Protocol (SNAP) field is a 24-bit constant value of 0xAAAA03. |
||
|
HSA |
This 24-bit field represents the upper three bytes (the manufacturer's ID portion) of the SA field. It must contain the value 0x00-00-0C. |
||
|
VLAN |
This 15-bit field is the virtual LAN ID of the packet. This value is used to mark frames on different VLANs. |
||
|
BPDU |
The bit in the bridge protocol data unit (BPDU) field is set for all BPDU packets that are encapsulated by the ISL frame. The BPDUs are used by the spanning tree algorithm to learn information about the topology of the network. This bit is also set for Cisco Discovery Protocol and VLAN Trunk Protocol (VTP) frames that are encapsulated. |
||
|
INDEX |
This 16-bit field indicates the port index of the source of the packet as it exits the switch. It is used for diagnostic purposes only, and may be set to any value by other devices. It is ignored in received packets. |
||
|
RES |
This 16-bit field is used when Token Ring or FDDI packets are encapsulated with an ISL frame. |
||
|
Encapsulated FRAME |
This field contains the encapsulated Layer 2 frame. |
||
|
FCS |
The FCS field consists of 4 bytes. It includes a 32-bit CRC value, which is created by the sending station and is recalculated by the receiving station, to check for damaged frames. The FCS covers the DA, SA, Length/Type, and Data fields. When an ISL header is attached to a Layer 2 frame, a new FCS is calculated over the entire ISL packet and added to the end of the frame.
|
NetFlow Top Talkers
The usual implementation of NetFlow exports NetFlow data to a collector. The NetFlow Top Talkers features can be used for security monitoring or accounting purposes for top talkers, and matching and identifying key traffic in your network. These features are also useful for a network location where a traditional NetFlow export operation is not possible. The NetFlow Top Talkers features do not require a collector to obtain information regarding flows. Instead, the NetFlow data is displayed on the router when the NetFlow Dynamic Top Talkers CLI show ip flow top command, or the NetFlow Top Talkers show ip flow top-talkersis used.
Comparison of the NetFlow Dynamic Top Talkers CLI and NetFlow Top Talkers Features
There are two very similar NetFlow features that can be used for monitoring the highest volume traffic in your network. The feature names are:
NetFlow Dynamic Top Talkers CLI
This feature was introduced in 12.4(4)T. The NetFlow Dynamic Top Talkers CLI feature is used to obtain an overview of the highest volume traffic (top talkers) in your network. It provides an overview of the traffic by aggregating the flows in the cache based on the aggregation field that you select when you use the NetFlow Dynamic Top Talkers CLI feature.
The NetFlow Dynamic Top Talkers CLI feature does not require modifications to the configuration of the router. The show ip flow top command is the only command that you need to use for the NetFlow Dynamic Top Talkers CLI feature. You can invoke any of the NetFlow Dynamic Top Talkers CLI options directly from the show ip flow top command whenever you need them.
Note | The information that you want to use the NetFlow Dynamic Top Talkers CLI feature to analyze must be available in the cache. For example, if you want to be able to identify the MAC address in the flows, you must configure the ip flow-capture mac-addresses command in order to capture the values from the MAC address fields in the traffic first. |
The NetFlow Dynamic Top Talkers CLI feature aggregates flows and allows them to be sorted so that they can be viewed. The flows can be aggregated on fields in the cache such as source or destination IP address, ICMP type and code values, and so forth. For a full list of the fields that you can aggregate the flows on, refer to the show ip flow topcommand in the Cisco IOS NetFlow command reference documentation.
The aggregated top talker flows can be sorted by any of the following criteria:
- The aggregated field in the display data
- The number of bytes in the display data
- The number of flows in the display data
- The by number of packets in the display data
- In ascending or descending order (to find the least used Top talker)
In addition to sorting top talkers, you can further organize your output by specifying criteria that the top talkers must match, such as source or destination IP address or port. The match keyword is used to specify this criterion. For a full list of the matching criterion that you can select, refer to the show ip flow topcommand in the Cisco IOS NetFlow command reference documentation.
The NetFlow Dynamic Top Talkers CLI feature can help you quickly identify traffic that is associated with security threats such as DoS attacks because it does not require configuration modifications. You can change the NetFlow Dynamic Top Talkers CLI options for identifying and analyzing network threats in the aggregated flows on-the-fly as you learn more about the traffic that is of interest. For example, after you have identified that there is a lot of ICMP traffic in your network by using the show ip flow top 10 aggregate icmp command you can learn what IP networks the traffic is being sent to by using the show ip flow top 10 aggregate icmp match destination-prefix 172.0.0.0/8 command.
Note | A high volume of ICMP traffic might indicate that an ICMP-based DoS attack is in progress. |
The show ip flow top command:
- Does not require additional NetFlow configuration commands to display top talkers. Therefore you do not need to supply the configuration mode password to the administrators who use the he show ip flow top command to monitor network traffic. The only prerequisite for using the show ip flow top command is that you have configured NetFlow on at least one interface on the router.
- Aggregates flows automatically based on the aggregation method that you select, and independently of any netflow aggregation cache(s).
- Allows you to change the parameters of the command, such as the number of flows to display, the display order, and match criterion, on-the-fly every time that you use the command without having to change the router's configuration.
-
Allows you to sort the display output in ascending or descending order based on:
- The aggregated field
- The number of bytes
- The number of flows,
- The number of packets
show ip flow top and show ip cache verbose flow
Many of the values shown in the display output of the show ip cache verbose flow command are in hexadecimal. If you want to match these values using the show ip flow top command with the match keyword, you must enter the field value that you want to match in hexadecimal. For example, to match on the destination port of 00DC in the following except from the show ip cache verbose flow command, you would use the match destination-port 0x00DC keywords and argument for the show ip flow top command.
SrcIf          SrcIPaddress    DstIf          DstIPaddress    Pr TOS Flgs  Pkts
Port Msk AS                    Port Msk AS    NextHop              B/Pk  Active
Et0/0.1        10.10.11.4      Et1/0.1        172.16.10.8     06 00  00     209
00DC /0  0                     00DC
 /0  0     0.0.0.0                40   281.4
MAC: (VLAN id) aaaa.bbbb.cc03  (005)          aaaa.bbbb.cc06  (006)
Min plen:       40                            Max plen:        40
Min TTL:        59                            Max TTL:         59
IP id:           0
Match Criteria with the show ip flow top command
You can limit the top talkers that are displayed by the show ip flow top command by using the match keyword and arguments. For example, you can display the IP destination address top talkers that have a prefix of 224.0.0.0 using the show ip flow top 10 aggregate destination-address match destination-prefix 224.0.0.0/3 command.
For a full list of the matching criterion that you can select, refer to the show ip flow topcommand in the Cisco IOS NetFlow Command Reference . If you do not configure match criteria all of the flows are considered as candidates for aggregation as top talkers based on the volume of traffic they represent.
The Order That Aggregation Occurs in
With the exception of the flows keyword, all matches are performed prior to aggregation, and only matching flows are aggregated. For example, the show ip flow top5aggregate destination-address match destination-prefix 172.16.0.0/16 command analyzes all of the available flows looking for any flows that have destination addresses that match the destination-prefix value of 172.16.0.0/16. If it finds any matches it aggregates them, and then displays the number of aggregated destination-address flows that is equal to the number of top talkers that were requested in the command-in this case five.
The flows keyword matches the number of aggregated flows post-aggregation. For example, the show ip flow top 2 aggregate destination-address match 6 command aggregates all of the flows on the values in their destination IP address field, and then displays the top talkers that have 6 aggregated flows.
Number of Flows Matched
If you do not specify match criteria and there is traffic in the flows that includes the field that you used to aggregate the flows on, all of the flows will match. For example, if your router has 20 flows with IP traffic and you enter the show ip flow top 10 aggregate destination-address command the display will indicate that 20 of 20 flows matched, and the 10 top talkers will be displayed.
If you use the match keyword to limit the flows that are aggregated to the flows with a destination prefix of 224.0.0.0/3, and only one flow matches this criterion the output will indicate that one out of six flows matched. For example, if your router has 6 flows with IP traffic, but only one of them has a destination prefix of 224.0.0.0/3, and you enter the show ip flow top 10 aggregate destination-address match destination-prefix 224.0.0.0/3 command, the display will indicate that 1 of 6 flows matched.
If the total number of top talkers is less than the number of top talkers that were requested in the command, the total number of top talkers is displayed. For example, if you enter a value of five for the number of top talkers to display and there are only three top talkers that match the criteria that you used, the display will only include three top talkers.
When a match criterion is included with the show ip flow top command, the display output will indicate "N of M flows matched" where N <= M, N = matched flows, and M = total flows seen. The numbers of flows seen could potentially be more than the total number of flows in the cache if some of the analyzed flows were removed from the cache and new flows were created ahead of the current point, as the top talkers feature sweeps through the cache. Therefore, M is NOT the total number of flows in the cache, but rather, the number of observed flows.
If you attempt to display the top talkers by aggregating them on a field that is not in the cache you will see the "% aggregation-field" is not available for this cache" message. For example, if you use the show ip flow top 5 aggregate s ource-vlan command, and you have not enabled the capture of VLAN IDs from the flows, you will see the "% VLAN id is not available for this cache" message.
NetFlow Top Talkers
This feature was introduced in 12.3(11)T. NetFlow Top Talkers is used to obtain information about individual flows in the cache. It does not aggregate the flows like the NetFlow Dynamic Top Talkers CLI feature.
The NetFlow Top Talkers feature compares all of the flows and displays information about each of the flows that have the heaviest traffic volumes (top talkers). The show ip flow top-talkerscommand requires you to pre-configure the router using the NetFlow Top Talkers configuration commands:
- ip flow-top-talkers --Enters the NetFlow Top Talkers configuration mode.
- sort-by --Selects the sort order for the flows in the display output.
- top --Specifies the number of top talkers to monitor.
- match (optional)--Specifies additional criteria, such as IP addresses, port numbers, and so forth, that must be matched in the flow to qualify as a candidate for top talker status.
For a full list of the matching criterion that you can select, refer to the ip flow top-talkerscommand in the Cisco IOS NetFlow Command Reference . If you do not configure match criteria all of the flows are considered as candidates as top talkers based on the volume of traffic they represent.
For more information on the NetFlow Top Talkers feature, refer to Configuring NetFlow Top Talkers using Cisco IOS CLI Commands or SNMP Commands.
Filtering and Sampling of NetFlow Traffic
NetFlow provides highly granular per-flow traffic statistics in a Cisco router. A flow is a unidirectional stream of packets that arrive at the router on the same subinterface, have the same source and destination IP addresses, Layer 4 protocol, TCP/UDP source and destination ports, and the same ToS (type of service) byte in the IP headers. The router accumulates NetFlow statistics in a NetFlow cache and can export them to an external device (such as the Cisco Networking Services (CNS) NetFlow Collection Engine) for further processing.
Full NetFlow accounts for all traffic entering the subinterface on which it is enabled. But in some cases, you might gather NetFlow data on only a subset of this traffic. The Random Sampled NetFlow feature and the NetFlow Input Filters feature each provide ways to limit incoming traffic to only traffic of interest for NetFlow processing. Random Sampled NetFlow provides NetFlow data for a subset of traffic in a Cisco router by processing only one randomly selected packet out of n sequential packets. The NetFlow Input Filters feature provides the capability to gather NetFlow data on only a specific user-defined subset of traffic.
Note | Random Sampled NetFlow is more statistically accurate than Sampled NetFlow. NetFlow's ability to sample packets was first provided by a feature named Sampled NetFlow. The methodology that the Sampled NetFlow feature uses is deterministic sampling, which selects every nth packet for NetFlow processing on a per-interface basis. For example, if you set the sampling rate to 1 out of 100 packets, then Sampled NetFlow samples the 1st, 101st, 201st, 301st, and so on packets. Sampled NetFlow does not allow random sampling and thus can make statistics inaccurate when traffic arrives in fixed patterns. |
Note | The Random Sampled NetFlow algorithms are applied after input filtering. |
The table below compares the NetFlow Input Filters feature and the NetFlow Random Sampled feature.
| Table 6 | Comparison of the NetFlow Input Filters Feature and the Random Sampled NetFlow Feature |
|
Comparison Category |
NetFlow Input Filters Feature |
Random Sampled NetFlow Feature |
|---|---|---|
|
Brief description |
This feature enables you to gather NetFlow data on only a specific subset of traffic. You do this by creating filters to select flows for NetFlow processing. For example, you can select flows from a specific group of hosts. This feature also lets you select various sampling rates for selected flows. |
This feature provides NetFlow data for a subset of traffic in a Cisco router by processing only one randomly selected packet out of n sequential packets (n is a user-configurable parameter). Packets are sampled as they arrive (before any NetFlow cache entries are made for those packets). |
|
Main uses |
You can use this feature for class-based traffic analysis and monitoring on-network or off-network traffic. This feature is also useful if you have too much traffic and you want to limit the traffic that is analyzed. |
You can use this feature for traffic engineering, capacity planning, and applications where full NetFlow is not needed for an accurate view of network traffic. This feature is also useful if you have too much traffic and you want to limit the traffic that is analyzed. |
|
Export format support |
This feature is supported in the Version 5 and Version 9 NetFlow export formats. |
This feature is supported in the Version 5 and Version 9 NetFlow export formats. |
|
Cisco IOS release support |
12.3(4)T. |
12.3(2)T, 12.2(18)S, and 12.0(26)S. |
|
Subinterface support |
You can configure NetFlow Input Filters per subinterface as well as per physical interface. You can select more than one filter per subinterface and have all of the filters run simultaneously. |
You can configure the Random Sampled NetFlow feature per subinterface as well as per physical interface. You can not run Full NetFlow and Random Sampled NetFlow concurrently on the same subinterface. You must disable full NetFlow on the subinterface before Random Sampled NetFlow will take effect. Traffic is collected only on the subinterfaces on which Random Sampled NetFlow is configured. As with full NetFlow, enabling Random Sampled NetFlow on a physical interface does not enable Random Sampled NetFlow on subinterfaces automatically--you must explicitly configure it on the subinterfaces. |
|
Memory impact |
This feature requires no additional memory. It allows you to use a smaller NetFlow cache than full NetFlow, because it significantly reduces the number of flows. This feature requires an insignificant amount of memory for each configured NetFlow filter. |
This feature can create a smaller NetFlow cache than full NetFlow if by reducing the number of packets being analyzed the numbers of flows in the cache is also reduced. This feature requires an insignificant amount of memory for each configured NetFlow sampler. |
|
Performance impact |
Accounting of classified traffic saves router resources by reducing the number of flows being processed and exported. The amount of bandwidth saved depends on the usage and the class-map criteria. However, performance might degrade depending on the number and complexity of class maps configured in a policy. |
Statistical traffic sampling substantially reduces consumption of router resources (especially CPU resources) while providing valuable NetFlow data. This feature substantially reduces the impact of NetFlow data export on interface traffic. For example, a sampling rate of 1 out of 100 packets reduces the export of NetFlow data by about 99% percent. |
- NetFlow Input Filters Flow Classification
- Random Sampled NetFlow Sampling Mode
- Random Sampled NetFlow The NetFlow Sampler Map
NetFlow Input Filters Flow Classification
For the NetFlow Input Filters feature, classification of packets can be based on any of the following: IP source and destination addresses, Layer 4 protocol and port numbers, incoming interface, MAC address, IP Precedence, DSCP value, Layer 2 information (such as Frame-Relay DE bits or Ethernet 802.1p bits), and Network-Based Application Recognition (NBAR) information. The packets are classified (filtered) on the above criteria, and flow accounting is applied to them on subinterfaces.
The filtering mechanism uses the Modular QoS Command-Line Interface (MQC) to classify flows. You can create multiple filters with matching samplers on a per-subinterface basis. For example, you can subdivide subinterface traffic into multiple classes based on type of service (ToS) values or destination prefixes (or both). For each class, you can also configure sampling at a different rate, using higher rates for higher-priority classes of traffic and lower rates for lower-priority ones.
MQC has many policies (actions) such as bandwidth rate and queuing management. These policies are applied only if a packet matches a criterion in a class map that is applied to the subinterface. A class map contains a set of match clauses and instructions on how to evaluate the clauses and acts as a filter for the policies, which are applied only if a packet's content satisfies the match clause. The NetFlow Input Filters feature adds NetFlow accounting to the MQC infrastructure, which means that flow accounting is done on a packet only if it satisfies the match clauses.
Two types of filter are available:
- ACL-based flow-mask filters
- Fields of filter (source IP address, destination IP address, source application port, destination application port, port protocol, ToS bits, and TCP flags)
For more information on Modular QoS Command-Line Interface (MQC) refer to the Cisco IOS Quality of Service Solutions Configuration Guide .
Random Sampled NetFlow Sampling Mode
Sampling mode makes use of an algorithm that selects a subset of traffic for NetFlow processing. In the random sampling mode that the Random Sampled NetFlow feature uses, incoming packets are randomly selected on average one out of each n sequential packets is selected for NetFlow processing. For example, if you set the sampling rate to 1 out of 100 packets, then NetFlow might sample the 5th packet and then the 120th, 230th, 302nd, and so on. This sample configuration provides NetFlow data on 1 percent of total traffic. The n value is a parameter that you can configure from 1 to 65535 packets.
Random Sampled NetFlow The NetFlow Sampler Map
Random Sampled NetFlow is useful if you have too much traffic and you want to limit the traffic that is analyzed. A NetFlow sampler map is created with the flow-sampler-map sampler-map-name command. The sampling mode for the sampler map is configured with the mode random one-out-of sampling-rate command. The range of values for the sampling-rate argument is 1 to 65535. Each NetFlow sampler map can be applied to one or many subinterfaces as well as physical interfaces. The sampler map is applied to an interface or subinterface with the flow-sampler sampler-map-name command. You can define up to eight NetFlow sampler maps.
How to Configure and Use NetFlow to Detect and Analyze Network Threats
Using NetFlow to detect and analyze network threats requires a combination of configuration commands and show commands. You start by configuring the NetFlow Layer 2 and Security Monitoring Exports feature to capture values of the additional non-key fields from the flows so that they can be displayed in the cache by the NetFlow show commands. Capturing the values in the additional non-key fields is required so that you can identify the path the traffic is taking through the network and other characteristics of the traffic such as TTL values and packet length values.
After you configure the NetFlow Layer 2 and Security Monitoring Exports feature, you use the NetFlow Dynamic Top Talkers CLI command to obtain an overview of the traffic flows the router is forwarding. The overview displays information such as the protocol distribution in the flows, the source ip addresses that are sending the flows, and the networks the flows are being sent to.
After you identify the type of flows that you want to focus, on such as ICMP traffic, and other characteristics such as source IP addresses and destination network prefixes, you use the NetFlow Top Talkers feature to obtain more focused and detailed information on the individual flows. The NetFlow Top Talkers feature is configured with match criteria that focuses it on the types of traffic that you have identified. If your router is keeping track of several flows and you are only interested in analyzing a subset of them you, can configure NetFlow Input Filters to limit the flows that NetFlow is tracking.
- Prerequisites
- Configuring NetFlow Layer 2 and Security Monitoring Exports
- Verifying NetFlow Layer 2 and Security Monitoring Exports
- Using NetFlow Dynamic Top Talkers CLI to Display the Protocol Distribution
- Using NetFlow Dynamic Top Talkers CLI to Display the Source IP Address Top Talkers Sending ICMP Traffic
- Using NetFlow Dynamic Top Talkers CLI to Display the Destination IP Address Top Talkers Receiving ICMP Traffic
- Configuring NetFlow Top Talkers to Monitor Network Threats
- Monitoring and Analyzing the NetFlow Top Talkers Flows
- Configuring NetFlow Filtering and Sampling
- Verify NetFlow Filtering and Sampling
- Monitoring and Analyzing the Sampled and Filtered NetFlow Top Talkers Flows
Prerequisites
CEF or dCEF must be configured globally, and on the interface that you want to run NetFlow on, before you configure NetFlow Layer 2 and Security Monitoring Exports.
You must have NetFlow enabled on at least one interface in the router before you configure NetFlow Layer 2 and Security Monitoring Exports.
If you want to capture the values of the Layer 3 IP fragment offset field from the IP headers in your IP traffic using the ip flow-capture fragment-offset command, your router must be running Cisco IOS 12.4(2)T or later.
This section contains the following procedures:
Configuring NetFlow Layer 2 and Security Monitoring Exports
Perform the following task to configure the NetFlow Layer 2 and Security Monitoring Exports feature.
To export the data captured with the NetFlow Layer 2 and Security Monitoring feature, you must configure NetFlow to use the NetFlow Version 9 data export format.
DETAILED STEPS
| Command or Action | Purpose | |
|---|---|---|
Step 1 |
enable
Example: Router> enable |
Enables privileged EXEC mode.
|
Step 2 |
configure
terminal
Example: Router# configure terminal |
Enters global configuration mode. |
Step 3 |
ip
flow-capture
fragment-offset
Example: Router(config)# ip flow-capture fragment-offset |
Enables capturing the value of the IP fragment offset field from the first fragmented IP datagram in a flow. |
Step 4 |
ip
flow-capture
icmp
Example: Router(config)# ip flow-capture icmp |
Enables you to capture the value of the ICMP type and code fields from the first ICMP datagram in a flow. |
Step 5 |
ip
flow-capture
ip-id
Example: Router(config)# ip flow-capture ip-id |
Enables you to capture the value of the IP-ID field from the first IP datagram in a flow. |
Step 6 |
ip
flow-capture
mac-addresses
Example: Router(config)# ip flow-capture mac-addresses |
Enables you to capture the values of the source and destination MAC addresses from the first Layer 2 frame in a flow. |
Step 7 |
ip flow-capture packet-length Example: Router(config)# ip flow-capture packet-length |
Enables you to capture the minimum and maximum values of the packet length field from IP datagrams in a flow. |
Step 8 |
ip
flow-capture
ttl
Example: Router(config)# ip flow-capture ttl |
Enables you to capture the minimum and maximum values of the Time-to-Live (TTL) field from IP datagrams in a flow. |
Step 9 |
ip
flow-capture
vlan-id
Example: Router(config)# ip flow-capture vlan-id |
Enables you to capture the 802.1q or ISL VLAN-ID field from first VLAN encapsulated Layer 2 frame in a flow that is received or transmitted on a trunk port. |
Step 10 |
interface
type
interface-type
interface-number
] Example: Router(config)# interface ethernet 0/0 |
Enters interface configuration mode for the type of interface specified in the command. |
Step 11 |
ip
flow
ingress
Example: and/or Example: ip flow egress Example: Router(config-if)# ip flow ingress Example: and/or Example: Router(config-if)# ip flow egress |
Enables ingress NetFlow data collection on the interface. and/or Enables egress NetFlow data collection on the interface. |
Step 12 |
end Example: Router(config)# end |
Returns to privileged EXEC mode. |
Verifying NetFlow Layer 2 and Security Monitoring Exports
This task verifies that NetFlow Layer 2 and Security Monitoring Exports is configured correctly. The show ip cache verbose flowcommand gives a detailed view of the status and statistics for flows in the NetFlow main cache. The values for the NetFlow non-key fields that you have configured with the NetFlow Layer 2 and Security Monitoring Exports feature are included for each flow.
To see the values of the fields that you have configured the NetFlow Layer 2 and Security Monitoring Exports feature to capture, your router must be forwarding IP traffic that meets the criteria for these fields. For example, if you configure the ip flow-capture vlan-id command, your router must be forwarding IP datagrams over interfaces that are configured as VLAN trunks to capture the VLAN-ID values from the layer-two frames carrying the IP datagrams in the flow.
Restrictions
Displaying Detailed NetFlow Cache Information on Platforms Running Distributed Cisco Express Forwarding
On platforms running dCEF, NetFlow cache information is maintained on each line card or Versatile Interface Processor. If you want to use the show ip cache verbose flow command to display this information on a distributed platform, you must enter the command at a line card prompt.
Cisco 7500 Series Platform
To display detailed NetFlow cache information on a Cisco 7500 series router that is running distributed dCEF, enter the following sequence of commands:
Router# if-con

slot-number
LC-
slot-number
# show ip cache verbose
 flow
For Cisco IOS Releases 12.3(4)T, 12.3(6), and 12.2(20)S and later, enter the following command to display detailed NetFlow cache information:
Router# execute-on
slot-number
show ip cache verbose
 flow
Cisco 12000 Series Platform
To display detailed NetFlow cache information on a Cisco 12000 Series Internet Router, enter the following sequence of commands:
Router# attach

slot-number
LC-
slot-number
# show ip cache verbose
 flow
For Cisco IOS Releases 12.3(4)T, 12.3(6), and 12.2(20)S and later, enter the following command to display detailed NetFlow cache information:
Router# execute-on slot-number show ip cache verbose flow
To verify the configuration of NetFlow Layer 2 and Security Monitoring Exports use the following step.
DETAILED STEPS
|
show
ip
cache
verbose
flow
This example shows that NetFlow Layer 2 and Security Monitoring Exports is working properly because the values have been captured from the non-key Layer 3 and Layer 2 fields in the flows. The values captured in the flows are shown in bold text. Example: Router# show ip cache verbose flow IP packet size distribution (33978 total packets): 1-32 64 96 128 160 192 224 256 288 320 352 384 416 448 480 .856 .143 .000 .000 .000 .000 .000 .000 .000 .000 .000 .000 .000 .000 .000 512 544 576 1024 1536 2048 2560 3072 3584 4096 4608 .000 .000 .000 .000 .000 .000 .000 .000 .000 .000 .000 IP Flow Switching Cache, 278544 bytes 14 active, 4082 inactive, 59 added 12452 ager polls, 0 flow alloc failures Active flows timeout in 10 minutes Inactive flows timeout in 15 seconds IP Sub Flow Cache, 25736 bytes 28 active, 996 inactive, 148 added, 59 added to flow 0 alloc failures, 0 force free 1 chunk, 1 chunk added last clearing of statistics never Protocol Total Flows Packets Bytes Packets Active(Sec) Idle(Sec) -------- Flows /Sec /Flow /Pkt /Sec /Flow /Flow TCP-SMTP 2 0.0 1730 40 3.6 600.7 0.2 UDP-other 31 0.0 1 54 0.0 3.6 16.8 ICMP 12 0.0 1728 28 22.0 600.1 0.1 Total: 45 0.0 538 29 25.7 189.2 11.6 SrcIf SrcIPaddress DstIf DstIPaddress Pr TOS Flgs Pkts Port Msk AS Port Msk AS NextHop B/Pk Active . . . Et0/0.1 10.71.200.138 Et1/0.1 172.16.10.2 01 00 10 696 0000 /0 0 0C01 /0 0 0.0.0.0 28 241.4 MAC: (VLAN id) aaaa.bbbb.cc03 (005) aaaa.bbbb.cc06 (006) Min plen: 28 Max plen: 28 Min TTL: 59 Max TTL: 59 ICMP type: 12 ICMP code: 1 IP id: 0 |
Using NetFlow Dynamic Top Talkers CLI to Display the Protocol Distribution
You can obtain a quick overview of the traffic in your network by viewing the protocol distribution. Use this task to display the top talkers (aggregated flows) for these three IPv4 protocol types:
DETAILED STEPS
|
show
ip
flow
top
number
aggregate
aggregate-field
sorted-by
packets
descending
The following example looks for up to three top talkers, aggregates them on the protocol field, sorts them by packets, and displays the output in descending order: Example:
Router# show ip flow top 3 aggregate protocol sorted-by packets descending

There are 3 top talkers:
IPV4 PROT       bytes        pkts       flows
=========  ==========  ==========  ==========
        1      406196       14507          12
        6       96560        2414           2
       17          52           1           1
15 of 15 flows matched.
The table below describes the significant fields shown in the display output.
All 15 flows in the router are aggregated into three top talkers. In this example all of the flow traffic is top talker traffic. The majority of the traffic is ICMP traffic (IP protocol type 1). This might indicate an ICMP DoS attack is in progress. |
Using NetFlow Dynamic Top Talkers CLI to Display the Source IP Address Top Talkers Sending ICMP Traffic
The display output from the show ip flow top 10 aggregate protocol sorted-by packets descending used in Using NetFlow Dynamic Top Talkers CLI to Display the Protocol Distribution section indicates that there is a possible ICMP-based DoS attack in progress. The next step to take is to identify the flows that are sending the ICMP traffic. In this case the flows will be aggregated on the source IP addresses.
DETAILED STEPS
|
show
ip
flow
top
number
aggregate
aggregate-field
sorted-by
packets
match
match-field
match-value
The following command looks for up to 20 top talkers, aggregates them on the source IP address, sorts them by packets, and matches on the protocol icmp: Example:
Router# show ip flow top 20 aggregate source-address sorted-by packets match protocol icmp
There are 6 top talkers:
IPV4 SRC-ADDR         bytes        pkts       flows
===============  ==========  ==========  ==========
10.132.221.111        90440        3230           1
10.10.12.1            90440        3230           1
10.251.138.218        90440        3230           1
10.71.200.138         90384        3228           1
10.231.185.254        90384        3228           1
10.106.1.1            90356        3227           1
6 of 15 flows matched.
Router
The table below describes the significant fields shown in the display.
The ICMP traffic is aggregated into six top talkers (source IP addresses). Each top talker has one flow. No aggregation is performed on this traffic because there is a 1-to-1 correlation of IP source addresses and flows. |
Using NetFlow Dynamic Top Talkers CLI to Display the Destination IP Address Top Talkers Receiving ICMP Traffic
The display output from the show ip flow top 5 aggregate source-address sorted-by packets match protocol icmp command used in Using NetFlow Dynamic Top Talkers CLI to Display the Source IP Address Top Talkers Sending ICMP Traffic section showed the six top talkers (IP source addresses) that are sending the 12 ICMP traffic flows. The next step to take is to identify the flows that are the target of the ICMP traffic. In this case the flows will be aggregated on the destination IP addresses.
DETAILED STEPS
|
show
ip
flow
top
number
aggregate
aggregate-field
sorted-by
packets
match
match-field
match-value
The following command looks for up to 20 top talkers, aggregates them on the destination IP address, sorts them by packets, and matches on the protocol icmp Example:
Router# show ip flow top 20 aggregate destination-address sorted-by packets match protocol icmp
There is 1 top talker:
IPV4 DST-ADDR         bytes        pkts       flows
===============  ==========  ==========  ==========
172.16.10.2          407456       14552           6
6 of 14 flows matched.
Router
The table below describes the significant fields shown in the display.
The previous task identified six ICMP top talkers based on source IP addresses that each had one flow. This task identified that there is one ICMP top talker based on destination IP addresses that is the target for 6 individual flows. There is a 1-to-1 correlation between the number of ICMP flows in the top talkers aggregated on the source IP address and the number of ICMP flows in the top talkers aggregated on the destination IP address. There is a high probability that an ICMP-based DoS attack on the host with the IP address of 172.16.10.2 is in progress. |
Configuring NetFlow Top Talkers to Monitor Network Threats
The previous task (Using NetFlow Dynamic Top Talkers CLI to Display the Destination IP Address Top Talkers Receiving ICMP Traffic) identified a probable ICMP-based DoS attack on the host with the IP address 172.16.10.2. This task uses the NetFlow Top Talkers feature to configure the router to monitor the DoS attack by tracking the individual ICMP flows. After you have configured the NetFlow Top Talkers feature to focus on the DoS attack traffic, you can use the show ip flow top-talkers verbose command to identify the path the DoS traffic is taking through the network.
Perform the following task to configure the NetFlow Top Talkers feature.
DETAILED STEPS
| Command or Action | Purpose | |
|---|---|---|
Step 1 |
enable
Example: Router> enable |
Enables privileged EXEC mode.
|
Step 2 |
configure
terminal
Example: Router# configure terminal |
Enters global configuration mode. |
Step 3 |
ip
flow-top-talkers
Example: Router(config)# ip flow-top-talkers |
Enters NetFlow top talkers configuration mode. |
Step 4 |
match
destination
address
ip-address
/prefix-mask Example: Router(config-flow-top-talkers) # match destination address 172.16.10.2/32 |
Specifies the destination IP addresses to match. |
Step 5 |
top
number
Example: Router(config-flow-top-talkers)# top 50 |
Specifies the maximum number of top talkers that will be retrieved by a NetFlow top talkers query. |
Step 6 |
sort-by
[bytes | packets Example: Router(config-flow-top-talkers)# sort-by packets |
Specifies the sort criterion for the top talkers.
|
Step 7 |
end
Example: Router(config-flow-top-talkers)# end |
Exits to privileged EXEC mode. |
Monitoring and Analyzing the NetFlow Top Talkers Flows
DETAILED STEPS
|
show
ip
flow
top-talkers
verbose
The following sample shows details for the six traffic flows that are being sent to the host with IP address 172.16.10.2. Example:
Router# show ip flow top-talkers verbose
SrcIf          SrcIPaddress    DstIf          DstIPaddress    Pr TOS Flgs Bytes
Port Msk AS                    Port Msk AS    NextHop              B/Pk  Active
Et0/0.1        10.106.1.1      Et1/0.1        172.16.10.2     01 00  10    9408
0000 /0  0                     0800 /0  0     0.0.0.0                28   116.3
MAC: (VLAN id) aaaa.bbbb.cc03  (005)          aaaa.bbbb.cc06  (006)
Min plen:       28                            Max plen:        28
Min TTL:        59                            Max TTL:         59
ICMP type:       8                            ICMP code:        0
IP id:           0
Et0/0.1        10.132.221.111  Et1/0.1        172.16.10.2     01 00  10    9408
0000 /0  0                     0800 /0  0     0.0.0.0                28   116.4
MAC: (VLAN id) aaaa.bbbb.cc03  (005)          aaaa.bbbb.cc06  (006)
Min plen:       28                            Max plen:        28
Min TTL:        59                            Max TTL:         59
ICMP type:       8                            ICMP code:        0
IP id:           0
Et0/0.1        10.10.12.1      Et1/0.1        172.16.10.2     01 00  10    9408
0000 /0  0                     0C01 /0  0     0.0.0.0                28   116.4
MAC: (VLAN id) aaaa.bbbb.cc03  (005)          aaaa.bbbb.cc06  (006)
Min plen:       28                            Max plen:        28
Min TTL:        59                            Max TTL:         59
ICMP type:      12                            ICMP code:        1
IP id:           0
Et0/0.1        10.251.138.218  Et1/0.1        172.16.10.2     01 00  10    9408
0000 /0  0                     0C01 /0  0     0.0.0.0                28   116.4
MAC: (VLAN id) aaaa.bbbb.cc03  (005)          aaaa.bbbb.cc06  (006)
Min plen:       28                            Max plen:        28
Min TTL:        59                            Max TTL:         59
ICMP type:      12                            ICMP code:        1
IP id:           0
Et0/0.1        10.71.200.138   Et1/0.1        172.16.10.2     01 00  10    9408
0000 /0  0                     0C01 /0  0     0.0.0.0                28   116.5
MAC: (VLAN id) aaaa.bbbb.cc03  (005)          aaaa.bbbb.cc06  (006)
Min plen:       28                            Max plen:        28
Min TTL:        59                            Max TTL:         59
ICMP type:      12                            ICMP code:        1
IP id:           0
Et0/0.1        10.231.185.254  Et1/0.1        172.16.10.2     01 00  10    9408
0000 /0  0                     0C01 /0  0     0.0.0.0                28   116.5
MAC: (VLAN id) aaaa.bbbb.cc03  (005)          aaaa.bbbb.cc06  (006)
Min plen:       28                            Max plen:        28
Min TTL:        59                            Max TTL:         59
ICMP type:      12                            ICMP code:        1
IP id:           0
6 of 50 top talkers shown. 6 of 8 flows matched.
This display output contains the information required for determining the path that the DoS attack traffic is taking through the network. This information will be used to react to the DoS attack by adding security measures such as access-lists to the affected interfaces. The table below describes the significant fields in the display from the show ip flow top-talkers verbose command for determining the network path the DoS traffic is taking.
The flows in this example show only the ICMP DoS attack traffic that is destined for the host with IP address 172.16.10.2. These flows were created specifically for documenting this task. In a real network, the host under attack might be communicating with other hosts that are using legitimate applications such as e-mail and web sites. In this case, the Top Talkers match filter on the destination IP address (match destination address 172.16.10.2/32) that was configured in the Configuring NetFlow Top Talkers to Monitor Network Threats will not limit the display of the show ip flow top-talkers command to the ICMP DoS attack traffic.
If you are using the Top Talkers feature to analyze a network threat and you are not able to use the basic match filters to limit the display of the show ip flow top-talkers command to the traffic that you are analyzing, you can use NetFlow filtering and sampling to limit the traffic that shows up in the display of the show ip flow top-talkers command. The process for configuring NetFlow filtering and sampling is explained in the Configuring NetFlow Filtering and Sampling. |
Configuring NetFlow Filtering and Sampling
If you use the show ip cache flow command or the show ip cache verbose flow command to display the flows in the cache, you will see the ICMP flows that are selected by NetFlow filtering and sampling on interface Ethernet0/0.1, and flows for all NetFlow supported traffic types on any other interfaces that NetFlow is running on. The show ip flow top-talkers [verbose] command is used to display the flow status and statistics for the traffic type you configured with the match criteria over interfaces to which you applied the service policy. For example, in this case you configured top talkers to match on ICMP traffic sent from any host that is arriving on Ethernet0/0.1 and destined for 172.16.10.2.
In this task the Top Talkers feature is being used more as a flow filter to separate flows of interest from all of the flows the router is seeing, rather than a filter to display the flows with the highest traffic volumes. Top talkers is used in this manner because in this example all of the ICMP DoS attack flows are of interest, not just the flows with the highest volumes. This is why a large value is assigned to the top keyword in the top talkers configuration. Setting the value for the top keyword to 50 when the largest number of ICMP DoS attack flows tracked by the router is 12 ensures that all of the ICMP DoS attack flows will be tracked.
If your router sees a significant number of flows involved in a DoS attack, you might want to set the value for the top keyword to a number that is less than the total number of flows to limit the number of flows that you see in the display when you use the show ip flow top-talkerscommand. This will ensure that you are seeing the flows that have the highest volume of DoS attack traffic. However, if all of the flows have the same traffic volume, the show ip flow top-talkerscommand will not be able to differentiate between them. It displays the number of flows that you set the value of the top keyword to, starting from the first flow in the cache.
Perform the following task to configure NetFlow Filtering and sampling.
Note | Restrictions for NetFlow Input Filters On Cisco 7500 platforms, the NetFlow Input Filters feature is supported only in distributed mode. Restrictions for Random Sampled NetFlow If full NetFlow is enabled on an interface, it takes precedence over Random Sampled NetFlow (which will thus have no effect). Disable full NetFlow on an interface before enabling Random Sampled NetFlow on that interface. Enabling Random Sampled NetFlow on a physical interface does not automatically enable Random Sampled NetFlow on subinterfaces; you must explicitly configure it on subinterfaces. Also, disabling Random Sampled NetFlow on a physical interface (or a subinterface) does not enable full NetFlow. This restriction prevents the transition to full NetFlow from overwhelming the physical interface (or subinterface). If you want full NetFlow, you must explicitly enable it. You must use NetFlow Version 9 if you want to use sampler option templates or view NetFlow sampler IDs. |
DETAILED STEPS
| Command or Action | Purpose | |||
|---|---|---|---|---|
Step 1 |
enable
Example: Router> enable |
Enables privileged EXEC mode. | ||
Step 2 |
configure
terminal
Example: Router# configure terminal |
Enters global configuration mode. | ||
Step 3 |
flow-sampler-map
sampler-map-name
Example: Router(config)# flow-sampler-map icmp-dos-fs-map |
Defines a statistical sampling NetFlow export flow sampler map. Entering the flow-sampler-map command enables the flow sampler configuration mode. | ||
Step 4 |
mode
random
one-out-of
packet-interval
Example: Router(config-sampler-map)# mode random one-out-of 2 |
Specifies a statistical sampling NetFlow export random sampling mode and a packet interval. | ||
Step 5 |
exit
Example: Router(config-sampler-map)# exit |
Exits back to global configuration mode. | ||
Step 6 |
class-map
class-map-name
[match-all |
match-any]
Example: Router(config)# class-map match-any icmp-dos-class-map |
Creates a class map to be used for matching packets to a specified class.
Entering the class-mapcommand enables class-map configuration mode, in which you can enter one of the match commands to configure the match criteria for this class. | ||
Step 7 |
match
access-group
access-group
Example: Router(config-cmap)# match access-group 101 |
Configures the match criteria for a class map on the basis of the specified access control list (ACL). | ||
Step 8 |
exit
Example: Router(config-cmap)# exit |
Exits back to global configuration mode. | ||
Step 9 |
policy-map
policy-map-name
Example: Router(config)# policy-map icmp-dos-policy-map |
Creates or modifies a policy map that can be attached to one or more interfaces to specify a service policy.
Entering the policy-mapcommand enables quality of service (QoS) policy-map configuration mode, in which you can configure or modify the class policies for that policy map | ||
Step 10 |
class
{
class-name
|
class-default}
Example: Router(config-pmap)# class icmp-dos-class-map |
Specifies the name of the class whose policy you want to create or change or specifies the default class (commonly known as the class-default class) before you configure its policy.
Entering the class command enables QoS policy-map class configuration mode. | ||
Step 11 |
netflow-sampler
sampler-map-name
Example: Router(config-pmap-c)# netflow-sampler icmp-dos-fs-map |
Enables a NetFlow input filter sampler. You can assign only one NetFlow input filter sampler to a class. Assigning another NetFlow input filter sampler to a class overwrites the previous one. | ||
Step 12 |
exit
Example: Router(config-pmap-c)# exit |
Exits back to policy-map configuration mode. | ||
Step 13 |
exit
Example: Router(config-pmap# exit |
Exits back to global configuration mode. | ||
Step 14 |
interface
interface-type
interface-number
[.subinterface number]
Example: Router(config)# interface Ethernet0/0.1 |
Specifies the interface and enters subinterface configuration mode. | ||
Step 15 |
no
[ip route-cache flow |
ip flow ingress]
Example: Router(config-subif)# no ip flow ingress |
Removes the existing NetFlow command from the interface.
| ||
Step 16 |
service-policy
{input |
output} policy-map-name Example: Router(config-subif)# service-policy input icmp-dos-policy-map |
Attaches a policy map to an input interface or virtual circuit (VC), or an output interface or VC, to be used as the service policy for that interface or VC.
| ||
Step 17 |
exit
Example: Router(config-subif)# exit |
Exits back to global configuration mode. | ||
Step 18 |
ip
flow-top-talkers
Example: Router(config)# ip flow-top-talkers |
Enters NetFlow top talkers configuration mode. | ||
Step 19 |
top
number
Example: Router(config-flow-top-talkers)# top 50 |
Specifies the maximum number of top talkers that will be retrieved by a NetFlow top talkers query. | ||
Step 20 |
sort-by
packets
Example: Router(config-flow-top-talkers)# sort-by packets |
Specifies the sort criterion for the top talkers. | ||
Step 21 |
match class-map
claas-name
Example: Router(config-flow-top-talkers)# match class-map icmp-dos-class-map |
Specifies that the match criteria should be obtained from the class-map. | ||
Step 22 |
no
match
destination
address
ip-address
/prefix-mask Example: Router(config-flow-top-talkers)# no match destination address 172.16.10.2/32 |
(Optional) If you still have a match entry for the destination address you should remove it so that only the class-name match criteria is used. | ||
Step 23 |
exit
Example: Router(config-sampler-map)# exit |
Exits back to global configuration mode. | ||
Step 24 |
access-list
access-list-number
permit
icmp
source
destination
Example: Router(config)# access-list 101 permit icmp any host 172.16.10.2 |
Creates an extended access list that is used to track any host that is sending ICMP traffic to 172.16.10.2. | ||
Step 25 |
end
Example: Router(config)# end |
Exits to privileged EXEC mode. |
Verify NetFlow Filtering and Sampling
DETAILED STEPS
|
show
flow-sampler
Any non-zero value in the display output below indicates that Filtering and sampling is active. Example:
Router# show flow-sampler

Sampler : icmp-dos-fs-map, id : 1, packets matched : 63226, mode : random sampling mode
  sampling interval is : 2
Router
|
Monitoring and Analyzing the Sampled and Filtered NetFlow Top Talkers Flows
DETAILED STEPS
| Step 1 |
show
ip
flow
top-talkers
The following sample output shows the six traffic flows that are being sent to the host with IP address 172.16.10.2. Example:
Router# show ip flow top-talkers
SrcIf         SrcIPaddress    DstIf         DstIPaddress    Pr SrcP DstP Bytes
Et0/0.1       10.231.185.254  Et1/0.1       172.16.10.2     01 0000 0C01  5460
Et0/0.1       10.106.1.1      Et1/0.1       172.16.10.2     01 0000 0800  5124
Et0/0.1       10.132.221.111  Et1/0.1       172.16.10.2     01 0000 0800  5012
Et0/0.1       10.251.138.218  Et1/0.1       172.16.10.2     01 0000 0C01  4844
Et0/0.1       10.10.12.1      Et1/0.1       172.16.10.2     01 0000 0C01  4704
Et0/0.1       10.71.200.138   Et1/0.1       172.16.10.2     01 0000 0C01  4396
6 of 50 top talkers shown. 6 of 7 flows matched.
|
| Step 2 |
show
ip
flow
top-talkers
verbose
The following sample output below shows the details for the six traffic flows that are being sent to the host with IP address 172.16.10.2. Example:
Router# show ip flow top-talkers verbose

SrcIf          SrcIPaddress    DstIf          DstIPaddress    Pr TOS Flgs Bytes
Port Msk AS                    Port Msk AS    NextHop              B/Pk  Active
Et0/0.1        10.106.1.1      Et1/0.1        172.16.10.2     01 00  10    2884
0000 /0  0                     0800 /0  0     0.0.0.0                28    64.6
Sampler: 1  Class: 1
MAC: (VLAN id) aaaa.bbbb.cc03  (005)          aaaa.bbbb.cc06  (006)
Min plen:       28                            Max plen:        28
Min TTL:        59                            Max TTL:         59
ICMP type:       8                            ICMP code:        0
IP id:           0
Et0/0.1        10.132.221.111  Et1/0.1        172.16.10.2     01 00  10    2828
0000 /0  0                     0800 /0  0     0.0.0.0                28    64.6
Sampler: 1  Class: 1
MAC: (VLAN id) aaaa.bbbb.cc03  (005)          aaaa.bbbb.cc06  (006)
Min plen:       28                            Max plen:        28
Min TTL:        59                            Max TTL:         59
ICMP type:       8                            ICMP code:        0
IP id:           0
Et0/0.1        10.231.185.254  Et1/0.1        172.16.10.2     01 00  10    2716
0000 /0  0                     0C01 /0  0     0.0.0.0                28    64.6
Sampler: 1  Class: 1
MAC: (VLAN id) aaaa.bbbb.cc03  (005)          aaaa.bbbb.cc06  (006)
Min plen:       28                            Max plen:        28
Min TTL:        59                            Max TTL:         59
ICMP type:      12                            ICMP code:        1
IP id:           0
Et0/0.1        10.71.200.138   Et1/0.1        172.16.10.2     01 00  10    2548
0000 /0  0                     0C01 /0  0     0.0.0.0                28    58.0
Sampler: 1  Class: 1
MAC: (VLAN id) aaaa.bbbb.cc03  (005)          aaaa.bbbb.cc06  (006)
Min plen:       28                            Max plen:        28
Min TTL:        59                            Max TTL:         59
ICMP type:      12                            ICMP code:        1
IP id:           0
Et0/0.1        10.251.138.218  Et1/0.1        172.16.10.2     01 00  10    2436
0000 /0  0                     0C01 /0  0     0.0.0.0                28    64.6
Sampler: 1  Class: 1
MAC: (VLAN id) aaaa.bbbb.cc03  (005)          aaaa.bbbb.cc06  (006)
Min plen:       28                            Max plen:        28
Min TTL:        59                            Max TTL:         59
ICMP type:      12                            ICMP code:        1
IP id:           0
Et0/0.1        10.10.12.1      Et1/0.1        172.16.10.2     01 00  10    2352
0000 /0  0                     0C01 /0  0     0.0.0.0                28    57.7
Sampler: 1  Class: 1
MAC: (VLAN id) aaaa.bbbb.cc03  (005)          aaaa.bbbb.cc06  (006)
Min plen:       28                            Max plen:        28
Min TTL:        59                            Max TTL:         59
ICMP type:      12                            ICMP code:        1
IP id:           0
6 of 50 top talkers shown. 6 of 7 flows matched.
|
Configuration Examples for Detecting and Analyzing Network Threats With NetFlow
- Configuring NetFlow Layer 2 and Sec Mon Exports to Capture Traffic From a Simulated FTP Attack Example
- Analyze an FTP DoS Attack Using the show ip cache verbose flow command Example
- Analyze an FTP DoS Attack Using NetFlow Dynamic Top Talkers CLI Example
- Configuring NetFlow Layer 2 and Sec Mon Exports to Capture Traffic From a Simulated ICMP Attack Example
- Analyze an ICMP Ping DoS Attack Using the show ip cache verbose flow command Example
- Analyze an ICMP Ping DoS Attack Using NetFlow Dynamic Top Talkers CLI Example
- Configure NetFlow Filtering and Sampling Example
Configuring NetFlow Layer 2 and Sec Mon Exports to Capture Traffic From a Simulated FTP Attack Example
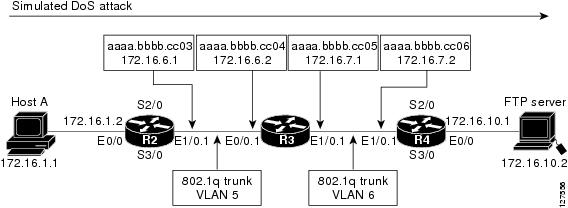
The following example shows how to use the NetFlow Layer 2 and Security Monitoring Exports feature to find out whether your network is being attacked by a host that is sending fake FTP traffic in an attempt to overwhelm the FTP server. This attack might cause end users to see a degradation in the ability of the FTP server to accept new connections or to service existing connections.
This example uses the network shown in the figure below. Host A is sending fake FTP packets to the FTP server.
This example also shows you how to use the Layer 2 data captured by the NetFlow Layer 2 and Security Monitoring Exports feature to learn where the traffic is originating and what path it is taking through the network.
 Tip | Keep track of the MAC addresses and IP addresses of the devices in your network. You can use them to analyze attacks and to resolve problems. |
Note | This example does not include the ip flow-capture icmpcommand that captures the value of the ICMP type and code fields. The use of the ip flow-capture icmp command is described in "Configuring NetFlow Layer 2 and Sec Mon Exports to Capture Traffic From a Simulated ICMP Attack Example." |
R2
!
hostname R2
!
interface Ethernet0/0
 mac-address aaaa.bbbb.cc02
 ip address 172.16.1.2 255.255.255.0
!
interface Ethernet1/0
 mac-address aaaa.bbbb.cc03
 no ip address
!
interface Ethernet1/0.1
 encapsulation dot1Q 5
 ip address 172.16.6.1 255.255.255.0
!
!
router rip
 version 2
 network 172.16.0.0
 no auto-summary
!
R3
!
hostname R3
!
ip flow-capture fragment-offset
ip flow-capture packet-length
ip flow-capture ttl
ip flow-capture vlan-id
ip flow-capture ip-id
ip flow-capture mac-addresses
!
interface Ethernet0/0
 mac-address aaaa.bbbb.cc04
 no ip address
!
interface Ethernet0/0.1
 encapsulation dot1Q 5
 ip address 172.16.6.2 255.255.255.0
 ip accounting output-packets
 ip flow ingress
!
interface Ethernet1/0
 mac-address aaaa.bbbb.cc05
 no ip address
!
interface Ethernet1/0.1
 encapsulation dot1Q 6
 ip address 172.16.7.1 255.255.255.0
 ip accounting output-packets
 ip flow egress
!
router rip
 version 2
 network 172.16.0.0
 no auto-summary
!
R4
!
hostname R4
!
interface Ethernet0/0
 mac-address aaaa.bbbb.cc07
 ip address 172.16.10.1 255.255.255.0
!
interface Ethernet1/0
 mac-address aaaa.bbbb.cc06
 no ip address
!
interface Ethernet1/0.1
 encapsulation dot1Q 6
 ip address 172.16.7.2 255.255.255.0
!
router rip
 version 2
 network 172.16.0.0
 no auto-summary
!
Analyze an FTP DoS Attack Using the show ip cache verbose flow command Example
The show ip cache verbose flow command displays the NetFlow flows. You can use this display output to identify the path that the FTP traffic from Host A is taking as it is received and transmitted by R3.
Note | To reduce the space required to display the output from the show ip flow cache verbose flowcommand only the FTP flows are shown. |
Tip | Look for the flows that have FTP in them and make a note of the interfaces, MAC addresses, and VLANs (if applicable) for the flows. |
R3# show ip cache verbose flow

IP packet size distribution (189118 total packets):
   1-32   64   96  128  160  192  224  256  288  320  352  384  416  448  480
   .043 .610 .000 .000 .000 .000 .000 .000 .000 .000 .000 .000 .000 .000 .000
    512  544  576 1024 1536 2048 2560 3072 3584 4096 4608
   .000 .000 .173 .000 .173 .000 .000 .000 .000 .000 .000
IP Flow Switching Cache, 278544 bytes
  25 active, 4071 inactive, 615 added
  263794 ager polls, 0 flow alloc failures
  Active flows timeout in 30 minutes
  Inactive flows timeout in 15 seconds
IP Sub Flow Cache, 25736 bytes
  50 active, 974 inactive, 1648 added, 615 added to flow
  0 alloc failures, 0 force free
  1 chunk, 1 chunk added
  last clearing of statistics never
Protocol         Total    Flows   Packets Bytes  Packets Active(Sec) Idle(Sec)
--------         Flows     /Sec     /Flow  /Pkt     /Sec     /Flow     /Flow
TCP-FTP             12      0.0       895    40      0.9    1363.8       5.5
TCP-FTPD            12      0.0       895    40      0.9    1363.8       5.6
Total:             590      0.0       317   383     16.1     430.1      12.4
Et0/0.1        192.168.87.200  Et1/0.1        172.16.10.2     06 00  00      63
0015 /0  0                     0015
 /0  0     0.0.0.0                40    94.5
MAC: (VLAN id) aaaa.bbbb.cc03  (005)          aaaa.bbbb.cc06  (006)
Min plen:       40                            Max plen:        40
Min TTL:        59                            Max TTL:         59
IP id:           0
Et0/0.1        192.168.87.200  Et1/0.1        172.16.10.2     06 00  00      63
0014 /0  0                     0014
 /0  0     0.0.0.0                40    94.5
MAC: (VLAN id) aaaa.bbbb.cc03  (005)          aaaa.bbbb.cc06  (006)
Min plen:       40                            Max plen:        40
Min TTL:        59                            Max TTL:         59
IP id:           0
Et0/0.1        10.10.10.2      Et1/0.1        172.16.10.2     06 00  00      64
0015 /0  0                     0015
 /0  0     0.0.0.0                40    96.0
MAC: (VLAN id) aaaa.bbbb.cc03  (005)          aaaa.bbbb.cc06  (006)
Min plen:       40                            Max plen:        40
Min TTL:        59                            Max TTL:         59
IP id:           0
Et0/0.1        10.10.10.2      Et1/0.1        172.16.10.2     06 00  00      64
0014 /0  0                     0014
 /0  0     0.0.0.0                40    96.0
MAC: (VLAN id) aaaa.bbbb.cc03  (005)          aaaa.bbbb.cc06  (006)
Min plen:       40                            Max plen:        40
Min TTL:        59                            Max TTL:         59
IP id:           0
Et0/0.1        10.234.53.1     Et1/0.1        172.16.10.2     06 00  00      63
0015 /0  0                     0015
 /0  0     0.0.0.0                40    94.5
MAC: (VLAN id) aaaa.bbbb.cc03  (005)          aaaa.bbbb.cc06  (006)
Min plen:       40                            Max plen:        40
Min TTL:        59                            Max TTL:         59
IP id:           0
Et0/0.1        10.234.53.1     Et1/0.1        172.16.10.2     06 00  00      63
0014 /0  0                     0014
 /0  0     0.0.0.0                40    94.5
MAC: (VLAN id) aaaa.bbbb.cc03  (005)          aaaa.bbbb.cc06  (006)
Min plen:       40                            Max plen:        40
Min TTL:        59                            Max TTL:         59
IP id:           0
Et0/0.1        172.30.231.193  Et1/0.1        172.16.10.2     06 00  00      63
0015 /0  0                     0015
 /0  0     0.0.0.0                40    94.5
MAC: (VLAN id) aaaa.bbbb.cc03  (005)          aaaa.bbbb.cc06  (006)
Min plen:       40                            Max plen:        40
Min TTL:        59                            Max TTL:         59
IP id:           0
Et0/0.1        172.30.231.193  Et1/0.1        172.16.10.2     06 00  00      63
0014 /0  0                     0014
 /0  0     0.0.0.0                40    94.5
MAC: (VLAN id) aaaa.bbbb.cc03  (005)          aaaa.bbbb.cc06  (006)
Min plen:       40                            Max plen:        40
Min TTL:        59                            Max TTL:         59
IP id:           0
There are 8 FTP flows shown in the output. You can use the Layer 2 information in the flows that is captured by the ip flow-capture command to identify the path the traffic is taking through the network. In this example, the traffic is being sent to R3 on VLAN 5 by R2. You can demonstrate that R2 is transmitting the traffic over interface 1/0.1 because the source MAC address (aaaa.bbb.cc03) belongs to 1/0.1 on R2. You can demonstrate that R3 is transmitting the traffic using VLAN 6 on interface 1/0.1 to interface 1/0.1 on R4, because the destination MAC address (aaaa.bbbb.cc06) belongs to interface 1/0.1 on R4.
Note | For more information on the ip flow-capture command, and the fields in the display output of the show ip cache verbose flow command, refer to the Cisco IOS NetFlow Command Reference . |
You can use this information to mitigate this attack. One possible way to mitigate this attack is by configuring an extended IP access list that blocks all FTP traffic from the source IP addresses that Host A is spoofing and applying it Ethernet 0/0 on R2.
Analyze an FTP DoS Attack Using NetFlow Dynamic Top Talkers CLI Example
You can use the NetFlow Dynamic Top Talkers CLI feature to quickly identify the FTP top talkers in the network traffic that might be sending the traffic. This will show you the IP source addresses that Host A is using as it sends the DoS attack traffic.
R3# show ip flow top 50 aggregate source-address sorted-by bytes descending match destination-port min 20 max 21
There are 5 top talkers:
IPV4 SRC-ADDR         bytes        pkts       flows
===============  ==========  ==========  ==========
10.231.185.254         5640         141           2
10.132.221.111         3680          92           2
10.10.12.1             3640          91           2
10.251.138.218         3600          90           2
10.71.200.138          1880          47           1
9 of 34 flows matched.
Note | Only source IP addresses from FTP traffic are shown because of the match destination-port min 20 max 21 criteria. The source addresses are aggregated together so only the most relevant sources are shown. |
Note | Only nine of the 34 flows matched because the rest of the flows are not FTP flows, therefore they do not meet the match criteria (match destination-port min 20 max 21). |
Tip | The top talkers are displayed in descending order of the aggregated field by default. |
Tip | You can enter the port numbers in their decimal values as shown, or in their hexadecimal equivalents of 0x14 and 0x15. |
After you have identified FTP top talkers traffic you need to identify the source IP addresses of IP traffic that is being sent to the host that you believe is under attack.
R3# show ip flow top 50 aggregate source-address match destination-prefix 172.16.10.2/32
There are 6 top talkers:
IPV4 SRC-ADDR         bytes        pkts       flows
===============  ==========  ==========  ==========
10.251.138.218         6642          18           4
10.231.185.254         5068          28           4
10.132.221.111        14818          25           4
10.106.1.1            12324          12           2
10.71.200.138         12564          18           3
10.10.12.1              560          14           2
19 of 33 flows matched.
Tip | You can specify the host that you believe is under attack by using a prefix value of 32 with the match destination-prefix command. |
Note | Only 19 of the 33 flows matched because the rest of the flows do not contain traffic that is destined for the host with the IP address of 172.16.10.2, therefore they do not meet the match criteria (match destination-prefix 172.16.10.2/32). |
The final step is to cross reference the source IP addresses of any hosts that are sending any IP traffic to the host under attack with the list of source IP addresses from the FTP top talkers. This is required because the show ip flow top command does not support multiple match criteria. Therefore you cannot limit the top talkers to FTP traffic being sent to a specific host with a single show ip flow top command (match destination-port min 20 max 21 <and> match destination-prefix 172.16.10.2/32).
The host with the IP address of 10.106.1.1 is apparently not involved in this DoS attack because it is not in the display output from the show ip flow top 50 aggregate source-address sorted-by bytes descending match destination-port min 20 max 21 command. This means that it is not sending FTP traffic to the host that is under attack.
Therefore the host IP addressees involved in this FTP DoS attack are likely to be:
- 10.231.185.254
- 10.132.221.111
- 10.10.12.1
- 10.251.138.218
- 10.71.200.138
Now that you know the source addresses of the FTP traffic you can configure an extended access list that blocks FTP traffic from these address, and apply it to the interface that is closest to the point the traffic is entering your network.
Note | Unless you recognize that some of the source IP addresses are not legitimate IP addresses for your network it might not be possible to identify legitimate FTP traffic from FTP DoS attack traffic. |
Configuring NetFlow Layer 2 and Sec Mon Exports to Capture Traffic From a Simulated ICMP Attack Example
The following example shows how to use the NetFlow Layer 2 and Security Monitoring Exports feature to find out that your network is being attacked by ICMP traffic. It uses the network shown in the figure below. Host A is sending ICMP ping packets to the FTP server.
Tip | Keep track of the MAC addresses and IP addresses of the devices in your network. You can use them to analyze attacks and to resolve problems. |
R2
!
hostname R2
!
interface Ethernet0/0
 mac-address aaaa.bbbb.cc02
 ip address 172.16.1.2 255.255.255.0
!
interface Ethernet1/0
 mac-address aaaa.bbbb.cc03
 no ip address
!
interface Ethernet1/0.1
 encapsulation dot1Q 5
 ip address 172.16.6.1 255.255.255.0
!
!
router rip
 version 2
 network 172.16.0.0
 no auto-summary
!
R3
!
hostname R3
!
ip flow-capture fragment-offset
ip flow-capture packet-length
ip flow-capture ttl
ip flow-capture vlan-id
ip flow-capture icmp
ip flow-capture ip-id
ip flow-capture mac-addresses
!
interface Ethernet0/0
 mac-address aaaa.bbbb.cc04
 no ip address
!
interface Ethernet0/0.1
 encapsulation dot1Q 5
 ip address 172.16.6.2 255.255.255.0
 ip accounting output-packets
 ip flow ingress
!
interface Ethernet1/0
 mac-address aaaa.bbbb.cc05
 no ip address
!
interface Ethernet1/0.1
 encapsulation dot1Q 6
 ip address 172.16.7.1 255.255.255.0
 ip accounting output-packets
 ip flow egress
!
router rip
 version 2
 network 172.16.0.0
 no auto-summary
!
R4
!
hostname R4
!
interface Ethernet0/0
 mac-address aaaa.bbbb.cc07
 ip address 172.16.10.1 255.255.255.0
!
interface Ethernet1/0
 mac-address aaaa.bbbb.cc06
 no ip address
!
interface Ethernet1/0.1
 encapsulation dot1Q 6
 ip address 172.16.7.2 255.255.255.0
!
router rip
 version 2
 network 172.16.0.0
 no auto-summary
!
Analyze an ICMP Ping DoS Attack Using the show ip cache verbose flow command Example
The show ip cache verbose flow command displays the NetFlow flows. You can use this display output to identify the path that the ICMP traffic from Host A is taking as it is received and transmitted by R3.
Note | To reduce the space required to display the output from the show ip flow cache verbose flowcommand only the ICMP flows are shown. |
Tip | Look for the flows that have ICMP in them and make a note of the interfaces, MAC addresses, and VLANs (if applicable) for the flows. |
R3# show ip cache verbose flow
IP packet size distribution (122369 total packets):
   1-32   64   96  128  160  192  224  256  288  320  352  384  416  448  480
   .065 .665 .000 .000 .000 .000 .000 .000 .000 .000 .000 .000 .000 .000 .000
    512  544  576 1024 1536 2048 2560 3072 3584 4096 4608
   .000 .000 .134 .000 .134 .000 .000 .000 .000 .000 .000
IP Flow Switching Cache, 278544 bytes
  24 active, 4072 inactive, 404 added
  176657 ager polls, 0 flow alloc failures
  Active flows timeout in 30 minutes
  Inactive flows timeout in 15 seconds
IP Sub Flow Cache, 25736 bytes
  48 active, 976 inactive, 1088 added, 404 added to flow
  0 alloc failures, 0 force free
  1 chunk, 1 chunk added
  last clearing of statistics never
Protocol         Total    Flows   Packets Bytes  Packets Active(Sec) Idle(Sec)
--------         Flows     /Sec     /Flow  /Pkt     /Sec     /Flow     /Flow
ICMP                27      0.0      1131   763      3.9    1557.4       3.6
Total:             380      0.0       267   257     13.0     382.8      12.6
SrcIf          SrcIPaddress    DstIf          DstIPaddress    Pr TOS Flgs  Pkts
Port Msk AS                    Port Msk AS    NextHop              B/Pk  Active
Et0/0.1        10.106.1.1      Et1/0.1        172.16.10.2     01 00  10     864
0000 /0  0                     0800 /0  0     0.0.0.0              1500  1089.9
MAC: (VLAN id) aaaa.bbbb.cc03  (005)          aaaa.bbbb.cc06  (006)
Min plen:      1500                            Max plen:       1500
Min TTL:        59                            Max TTL:         59
ICMP type:       8                            ICMP code:        0
IP id:           0
Et0/0.1        10.71.200.138   Et1/0.1        172.16.10.2     01 00  00     864
0000 /0  0                     0000 /0  0     0.0.0.0               554  1090.0
MAC: (VLAN id) aaaa.bbbb.cc03  (005)          aaaa.bbbb.cc06  (006)
Min plen:      554                            Max plen:       554
Min TTL:        59                            Max TTL:         59
ICMP type:       0                            ICMP code:        0
IP id:           0                            FO:            185
Et0/0.1        10.231.185.254  Et1/0.1        172.16.10.2     01 00  00     864
0000 /0  0                     0000 /0  0     0.0.0.0               554  1090.0
MAC: (VLAN id) aaaa.bbbb.cc03  (005)          aaaa.bbbb.cc06  (006)
Min plen:      554                            Max plen:       554
Min TTL:        59                            Max TTL:         59
ICMP type:       0                            ICMP code:        0
IP id:           0                            FO:            185
Et0/0.1        10.10.12.1      Et1/0.1        172.16.10.200   01 00  00     864
0000 /0  0                     0000 /0  0     0.0.0.0               554  1090.0
MAC: (VLAN id) aaaa.bbbb.cc03  (005)          aaaa.bbbb.cc06  (006)
Min plen:      554                            Max plen:       554
Min TTL:        59                            Max TTL:         59
ICMP type:       0                            ICMP code:        0
IP id:           0                            FO:            185
Et0/0.1        10.132.221.111  Et1/0.1        172.16.10.2     01 00  10     864
0000 /0  0                     0800 /0  0     0.0.0.0              1500  1089.9
MAC: (VLAN id) aaaa.bbbb.cc03  (005)          aaaa.bbbb.cc06  (006)
Min plen:      1500                            Max plen:       1500
Min TTL:        59                            Max TTL:         59
ICMP type:       8                            ICMP code:        0
IP id:           0
Et0/0.1        10.251.138.218  Et1/0.1        172.16.10.2     01 00  00     864
0000 /0  0                     0000 /0  0     0.0.0.0               554  1089.9
MAC: (VLAN id) aaaa.bbbb.cc03  (005)          aaaa.bbbb.cc06  (006)
Min plen:      554                            Max plen:       554
Min TTL:        59                            Max TTL:         59
ICMP type:       0                            ICMP code:        0
IP id:           0                            FO:            185
Et0/0.1        10.10.12.1      Et1/0.1        172.16.10.200   01 00  10     864
0000 /0  0                     0C01 /0  0     0.0.0.0              1500  1090.0
MAC: (VLAN id) aaaa.bbbb.cc03  (005)          aaaa.bbbb.cc06  (006)
Min plen:      1500                            Max plen:       1500
Min TTL:        59                            Max TTL:         59
ICMP type:      12                            ICMP code:        1
IP id:           0
Et0/0.1        10.106.1.1      Et1/0.1        172.16.10.2     01 00  00     864
0000 /0  0                     0000 /0  0     0.0.0.0               554  1089.9
MAC: (VLAN id) aaaa.bbbb.cc03  (005)          aaaa.bbbb.cc06  (006)
Min plen:      554                            Max plen:       554
Min TTL:        59                            Max TTL:         59
ICMP type:       0                            ICMP code:        0
IP id:           0                            FO:            185
Et0/0.1        10.251.138.218  Et1/0.1        172.16.10.2     01 00  10     864
0000 /0  0                     0C01 /0  0     0.0.0.0              1500  1089.9
MAC: (VLAN id) aaaa.bbbb.cc03  (005)          aaaa.bbbb.cc06  (006)
Min plen:      1500                            Max plen:       1500
Min TTL:        59                            Max TTL:         59
ICMP type:      12                            ICMP code:        1
IP id:           0
Et0/0.1        10.71.200.138   Et1/0.1        172.16.10.2     01 00  10     864
0000 /0  0                     0C01 /0  0     0.0.0.0              1500  1090.0
MAC: (VLAN id) aaaa.bbbb.cc03  (005)          aaaa.bbbb.cc06  (006)
Min plen:      1500                            Max plen:       1500
Min TTL:        59                            Max TTL:         59
ICMP type:      12                            ICMP code:        1
IP id:           0
Et0/0.1        10.132.221.111  Et1/0.1        172.16.10.2     01 00  00     864
0000 /0  0                     0000 /0  0     0.0.0.0               554  1089.9
MAC: (VLAN id) aaaa.bbbb.cc03  (005)          aaaa.bbbb.cc06  (006)
Min plen:      554                            Max plen:       554
Min TTL:        59                            Max TTL:         59
ICMP type:       0                            ICMP code:        0
IP id:           0                            FO:            185
Et0/0.1        10.231.185.254  Et1/0.1        172.16.10.2     01 00  10     864
0000 /0  0                     0C01 /0  0     0.0.0.0              1500  1090.0
MAC: (VLAN id) aaaa.bbbb.cc03  (005)          aaaa.bbbb.cc06  (006)
Min plen:      1500                            Max plen:       1500
Min TTL:        59                            Max TTL:         59
ICMP type:      12                            ICMP code:        1
IP id:           0
There are 12 ICMP flows shown in the output. You can use the Layer 2 information in the flows that is captured by the ip flow-capture command to identify the path the traffic is taking through the network. In this example, the traffic is being sent to R3 on VLAN 5 by R2. You can demonstrate that R2 is transmitting the traffic over interface 1/0.1 because the source MAC address (aaaa.bbb.cc03) belongs to 1/0.1 on R2. You can demonstrate that R3 is transmitting the traffic using VLAN 6 on interface 1/0.1 to interface 1/0.1 on R4, because the destination MAC address (aaaa.bbbb.cc06) belongs to interface 1/0.1 on R4.
Note | For more information on the ip flow-capture command, and the fields in the display output of the show ip cache verbose flow command, refer to the Cisco IOS NetFlow Command Reference . |
You can use this information to mitigate this attack. One possible way to mitigate this attack is by configuring an extended IP access list that blocks all ICMP traffic from the source IP addresses that Host A is spoofing and applying it Ethernet 0/0 on R2.
Analyze an ICMP Ping DoS Attack Using NetFlow Dynamic Top Talkers CLI Example
You can use the NetFlow Dynamic Top Talkers CLI feature to quickly identify the ICMP top talkers in the network traffic that might be sending the traffic. This will show you the IP source addresses that Host A is using as it sends the DoS attack traffic.
R3# show ip flow top 50 aggregate icmp
There are 3 top talkers:
ICMP TYPE  ICMP CODE       bytes        pkts       flows
=========  =========  ==========  ==========  ==========
       12          1     2466000        1644           4
        8          0     1233000         822           2
        0          0     1366164        2466           6
12 of 25 flows matched.
Note | Only 12 of the 25 flows matched because the rest of the flows are not ICMP flows. |
Tip | The top talkers are displayed in descending order of the aggregated field by default. |
After you have identified the ICMP types and code values in the network traffic, you need to determine the source IP addresses for the ICMP traffic that being sent to the FTP server.
R3# show ip flow top 50 aggregate source-address match icmp type 12 code 1
There are 4 top talkers:
IPV4 SRC-ADDR         bytes        pkts       flows
===============  ==========  ==========  ==========
10.251.138.218       867000         578           1
10.231.185.254       865500         577           1
10.71.200.138        865500         577           1
10.10.12.1           867000         578           1
4 of 24 flows matched.
Note | Only source IP addresses from ICMP traffic are shown because of the match icmp type 12 code 1 criteria. No aggregation is performed on the source IP addresses because there is only one flow for IP each address. |
Note | Only four of the 24 flows matched because the rest of the flows did not meet the match criteria (match icmp type 12 code 1). |
R3# show ip flow top 50 aggregate source-address match icmp type 8 code 0

There are 2 top talkers:
IPV4 SRC-ADDR         bytes        pkts       flows
===============  ==========  ==========  ==========
10.132.221.111      1095000         730           1
10.106.1.1          1095000         730           1
2 of 24 flows matched.
Note | Only source IP addresses from ICMP traffic are shown because of the match icmp type 8 code 0 criteria. No aggregation is performed on the source IP addresses because there is only one flow for IP each address. |
Note | Only two of the 24 flows matched because the rest of the flows did not meet the match criteria (match icmp type 8 code 0). |
R3# show ip flow top 50 aggregate source-address match icmp type 0 code 0
There are 6 top talkers:
IPV4 SRC-ADDR         bytes        pkts       flows
===============  ==========  ==========  ==========
10.251.138.218       416608         752           1
10.231.185.254       416608         752           1
10.132.221.111       416608         752           1
10.106.1.1           416608         752           1
10.71.200.138        416608         752           1
10.10.12.1           416608         752           1
6 of 24 flows matched.
Note | Only source IP addresses from ICMP traffic are shown because of the match icmp type 0 code 0 criteria. No aggregation is performed on the source IP addresses because there is only one flow for IP each address. |
Note | Only six of the 24 flows matched because the rest of the flows did not meet the match criteria (match icmp type 0 code 0). |
The next step is to create a list of the source IP addresses that Host A is using.
- 10.251.138.218
- 10.231.185.254
- 10.71.200.138
- 10.10.12.1
- 10.132.221.111
- 10.106.1.1.
Now that you know the source addresses of the ICMP DoS attack traffic, you can mitigate this attack by configuring an extended access list that blocks ICMP traffic from these address and applying it to the interface that is closest to the point that the traffic is entering your network.
Configure NetFlow Filtering and Sampling Example
This example configuration contains the configuration commands required to use NetFlow filtering and sampling on the NetFlow router.
!
hostname Router
!
ip cef
!
flow-sampler-map icmp-dos-fs-map
 mode random one-out-of 2
!
!
class-map match-any icmp-dos-class-map
 match access-group 101
!
!
policy-map icmp-dos-policy-map
  class icmp-dos-class-map
   netflow-sampler icmp-dos-fs-map
!
interface Ethernet0/0
 mac-address aaaa.bbbb.cc04
 no ip address
!
interface Ethernet0/0.1
 encapsulation dot1Q 5
 ip address 172.16.6.2 255.255.255.0
 service-policy input icmp-dos-policy-map
!
interface Ethernet1/0.1
 encapsulation dot1Q 6
 ip address 172.16.7.1 255.255.255.0
 ip flow egress
!
ip flow-capture fragment-offset
ip flow-capture packet-length
ip flow-capture ttl
ip flow-capture vlan-id
ip flow-capture icmp
ip flow-capture ip-id
ip flow-capture mac-addresses
!
ip flow-top-talkers
 top 5
 sort-by bytes
 match class-map icmp-dos-class-map
!
access-list 101 permit icmp any host 172.16.10.2
!
end
Where to Go Next
See the "Additional References" section for links to configuration information about additional NetFlow features and services.
Additional References
Related Documents
|
Related Topic |
Document Title |
|---|---|
|
Overview of Cisco IOS NetFlow |
"Cisco IOS NetFlow Overview" |
|
The minimum information about and tasks required for configuring NetFlow and NetFlow Data Export |
"Getting Started with Configuring NetFlow and NetFlow Data Export" |
|
Tasks for configuring NetFlow to capture and export network traffic data |
"Configuring NetFlow and NetFlow Data Export" |
|
Tasks for configuring Configuring MPLS Aware NetFlow |
Configuring MPLS Aware NetFlow |
|
Tasks for configuring MPLS egress NetFlow accounting |
Configuring MPLS Egress NetFlow Accounting and Analysis |
|
Tasks for configuring NetFlow input filters |
"Using NetFlow Filtering or Sampling to Select the Network Traffic to Track" |
|
Tasks for configuring Random Sampled NetFlow |
"Using NetFlow Filtering or Sampling to Select the Network Traffic to Track" |
|
Tasks for configuring NetFlow aggregation caches |
"Configuring NetFlow Aggregation Caches" |
|
Tasks for configuring NetFlow BGP next hop support |
"Configuring NetFlow BGP Next Hop Support for Accounting and Analysis" |
|
Tasks for configuring NetFlow multicast support |
"Configuring NetFlow Multicast Accounting" |
|
Tasks for configuring NetFlow Reliable Export With SCTP |
NetFlow Reliable Export With SCTP |
|
Tasks for configuring NetFlow Layer 2 and Security Monitoring Exports |
"NetFlow Layer 2 and Security Monitoring Exports" |
|
Tasks for configuring the SNMP NetFlow MIB |
"Configuring SNMP and using the NetFlow MIB to Monitor NetFlow Data" |
|
Tasks for configuring the NetFlow MIB and Top Talkers feature |
"Configuring NetFlow Top Talkers using Cisco IOS CLI Commands or SNMP Commands" |
|
Information for installing, starting, and configuring the CNS NetFlow Collection Engine |
MIBs
Feature Information for Detecting and Analyzing Network Threats With NetFlow
The following table provides release information about the feature or features described in this module. This table lists only the software release that introduced support for a given feature in a given software release train. Unless noted otherwise, subsequent releases of that software release train also support that feature.
Use Cisco Feature Navigator to find information about platform support and Cisco software image support. To access Cisco Feature Navigator, go to www.cisco.com/go/cfn. An account on Cisco.com is not required.
| Table 11 | Feature Information for NetFlow Layer 2 and Security Monitoring Exports |
|
Feature Name |
Releases |
Feature Configuration Information |
|---|---|---|
|
NetFlow Layer 2 and Security Monitoring Exports |
12.3(14)T |
The NetFlow Layer 2 and Security Monitoring Exports feature enables the capture of values from fields in Layer 3 and Layer 2 of IP traffic for accounting and security analysis. The following commands were modified by this feature: ip flow-capture, ip flow-export and show ip cache verbose flow. |
|
Support for capturing the value from the fragment offset field of IP headers added to NetFlow Layer 2 and Security Monitoring Exports1 |
12.4(2)T |
The fragment-offset keyword for the ip flow-capture command enables capturing the value of the IP fragment offset field from the first fragmented IP datagram in a flow. |
|
NetFlow Top Talkers |
12.3(11)T, 12.2(25)S |
This document references the Top Talkers feature from the NetFlow MIB and Top Talkers feature documentation. Top Talkers uses NetFlow functionality to obtain information regarding heaviest traffic patterns and most-used applications in the network. The following commands were introduced by this feature: cache-timeout, ip flow-top-talkers, match, show ip flow top-talkers, sort-by, and top. |
|
NetFlow Dynamic Top Talkers CLI |
12.4(4)T |
The NetFlow Dynamic Top Talkers CLI allows you to se an overview of the traffic characteristics on your router by aggregating flows based on the fields such as source IP address, destination prefix, and so forth. |
|
NetFlow Input Filters |
12.3(4)T, 12.2(25)S |
This document references the NetFlow Input Filters feature from the NetFlow Filtering and Sampling feature documentation. |
|
Random Sampled NetFlow |
12.3(4)T, 12.2(18)S, 12.0(26)S |
This document references the Random Sampled NetFlow feature from the NetFlow Filtering and Sampling feature documentation. |
Glossary
data flowset --A collection of data records that are grouped in an export packet.
export packet --A type of packet built by a device (for example, a router) with NetFlow services enabled. The packet is addressed to another device (for example, the NetFlow Collection Engine). The packet contains NetFlow statistics. The other device processes the packet (parses, aggregates, and stores information about IP flows).
flow --A set of packets with the same source IP address, destination IP address, protocol, source/destination ports, and type-of-service, and the same interface on which flow is monitored. Ingress flows are associated with the input interface, and egress flows are associated with the output interface.
flowset --A collection of flow records that follow the packet header in an export packet. A flowset contains information that must be parsed and interpreted by the NetFlow Collection Engine. There are two types of flowsets: template flowsets and data flowsets. An export packet contains one or more flowsets, and both template and data flowsets can be mixed in the same export packet.
NetFlow --Cisco IOS accounting feature that maintains per-flow information.
NetFlow Aggregation --A NetFlow feature that lets you summarize NetFlow export data on an IOS router before the data is exported to a NetFlow data collection system such as the NetFlow Collection Engine. This feature lowers bandwidth requirements for NetFlow export data and reduces platform requirements for NetFlow data collection devices.
NetFlow Collection Engine (formerly NetFlow FlowCollector)--Cisco application that is used with NetFlow on Cisco routers and Catalyst series switches. The NetFlow Collection Engine collects packets from the router that is running NetFlow and decodes, aggregates, and stores them. You can generate reports on various aggregations that can be set up on the NetFlow Collection Engine.
NetFlow v9 --NetFlow export format Version 9. A flexible and extensible means of carrying NetFlow records from a network node to a collector. NetFlow Version 9 has definable record types and is self-describing for easier NetFlow Collection Engine configuration.
template --Describes the layout of a data flowset.
template flowset --A collection of template records that are grouped in an export packet.
Cisco and the Cisco logo are trademarks or registered trademarks of Cisco and/or its affiliates in the U.S. and other countries. To view a list of Cisco trademarks, go to this URL: www.cisco.com/go/trademarks. Third-party trademarks mentioned are the property of their respective owners. The use of the word partner does not imply a partnership relationship between Cisco and any other company. (1110R)
Any Internet Protocol (IP) addresses and phone numbers used in this document are not intended to be actual addresses and phone numbers. Any examples, command display output, network topology diagrams, and other figures included in the document are shown for illustrative purposes only. Any use of actual IP addresses or phone numbers in illustrative content is unintentional and coincidental.