
 Feedback
Contents
- Configuring Cisco Performance Monitor
- Finding Feature Information
- Information About Cisco Performance Monitor
- Overview of Cisco Performance Monitor
- Prerequisites for Configuring Cisco Performance Monitor
- Configuration Components of Cisco Performance Monitor
- Data That You Can Monitor Using Cisco Performance Monitor
- SNMP MIB Support for Cisco Performance Monitor
- Limitations for the Catalyst 6500 Platform
- How to Configure Troubleshoot and Maintain Cisco Performance Monitor
- Configuring a Flow Exporter for Cisco Performance Monitor
- Troubleshooting Tips
- Configuring a Flow Record for Cisco Performance Monitor
- Troubleshooting Tips
- Configuring a Flow Monitor for Cisco Performance Monitor
- Troubleshooting Tips
- Configuring a Flow Class for Cisco Performance Monitor
- Troubleshooting Tips
- Configuring a Flow Policy for Cisco Performance Monitor Using an Existing Flow Monitor
- Troubleshooting Tips
- Configuring a Flow Policy for Cisco Performance Monitor Without Using an Existing Flow Monitor
- Troubleshooting Tips
- Applying a Cisco Performance Monitor Policy to an Interface Using an Existing Flow Policy
- Troubleshooting Tips
- Applying a Cisco Performance Monitor Policy to an Interface Without Using an Existing Flow Policy
- Verifying That Cisco Performance Monitor Is Collecting Data
- Displaying Information Specific to the Catalyst 6500 Platform
- Displaying the Performance Monitor Cache and Clients
- Displaying the Clock Rate for Cisco Performance Monitor Classes
- Displaying the Current Status of a Flow Monitor
- Verifying the Flow Monitor Configuration
- Verifying That Cisco IOS Flexible NetFlow and Cisco Performance Monitor Is Enabled on an Interface
- Displaying the Flow Monitor Cache
- Displaying the Current Status of a Flow Exporter
- Verifying the Flow Exporter Configuration
- Enabling Debugging
- Configuration Example for Cisco Performance Monitor
- Example Monitor for Lost RTP Packets and RTP Jitter
- Where to Go Next
- Additional References
- Feature Information for Cisco Performance Monitor
Configuring Cisco Performance Monitor
This document contains information about and instructions for configuring Cisco Performance Monitor.
Finding Feature Information
Your software release may not support all the features documented in this module. For the latest feature information and caveats, see the release notes for your platform and software release. To find information about the features documented in this module, and to see a list of the releases in which each feature is supported, see the Feature Information Table at the end of this document.
Use Cisco Feature Navigator to find information about platform support and Cisco software image support. To access Cisco Feature Navigator, go to www.cisco.com/go/cfn. An account on Cisco.com is not required.
Information About Cisco Performance Monitor
- Overview of Cisco Performance Monitor
- Prerequisites for Configuring Cisco Performance Monitor
- Configuration Components of Cisco Performance Monitor
- Data That You Can Monitor Using Cisco Performance Monitor
- SNMP MIB Support for Cisco Performance Monitor
- Limitations for the Catalyst 6500 Platform
Overview of Cisco Performance Monitor
Cisco Performance Monitor enables you to monitor the flow of packets in your network and become aware of any issues that might impact the flow before it starts to significantly impact the performance of the application in question. Performance monitoring is especially important for video traffic because high quality interactive video traffic is highly sensitive to network issues. Even minor issues that may not affect other applications can have dramatic effects on video quality.
Because Cisco Performance Monitor uses similar software components and commands as Cisco NetFlow and Cisco Flexible NetFlow, familiarity with these products will help you to understand how to configure Cisco Performance Monitor. These products provide statistics on packets flowing through a router and are the standard for acquiring IP operational data from IP networks. They provide data to support network and security monitoring, network planning, traffic analysis, and IP accounting. For more information about Cisco NetFlow and Cisco Flexible NetFlow, see the documents listed in the Additional References section.
For more information about the design, configuration, and troubleshooting of Performance Monitor and other Cisco Medianet products, including a Quick Start Guide and Deployment Guide, see the Cisco Medianet Knowledge Base Portal, located at http://www.cisco.com/web/solutions/medianet/knowledgebase/index.html.
Prerequisites for Configuring Cisco Performance Monitor
The following prerequisites must be met before you can configure Cisco Performance Monitor:
Configuration Components of Cisco Performance Monitor
To configure Cisco Performance Monitor, configure many of the same basic elements that you normally configure for Flexible NetFlow:
The figure below shows how these elements are related to each other. The elements at the bottom of the figure are configured first.
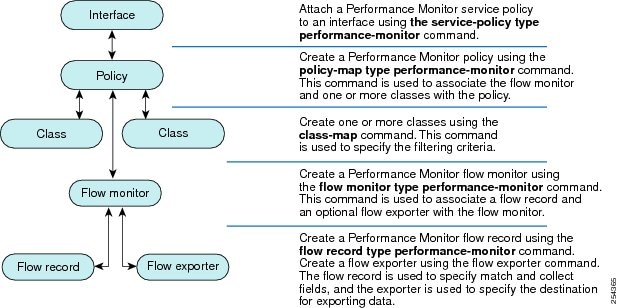
As shown above, a policy includes one or more classes. Each class has a flow monitor associated with it, and each flow monitor has a flow record and an optional flow exporter associated with it. These elements are configured in the following order:
- Configure a flow record to specify the key and non-key fields that you want to monitor. This is configured using match and collect commands. You can also optimally configure a flow exporter to specify the export destination. For Cisco Performance Monitor, you must configure a performance-monitortype flow record.
- Configure a flow monitor that includes the flow record and flow exporter. For Cisco Performance Monitor, you must configure a performance-monitortype flow monitor.
- Configure a class to specify the filtering criteria using the class-map command.
- Configure a policy to include one or more classes and one or more performance-monitortype flow monitors using the policy-map command. For Cisco Performance Monitor, you must configure performance-monitortype policies.
- Associate a performance-monitortype policy to the appropriate interface using the service-policy type performance-monitorcommand.
Data That You Can Monitor Using Cisco Performance Monitor
You can monitor the following information by configuring a flow record with collect or match commands for the corresponding non-key fields:
 Tip | For more information about these statistics, see the show performance monitor statuscommand in theCisco Media Monitoring Command Reference. |
- IP Packet Count
- IP TTL
- IP TTL minimum
- IP TTL maximum
- Flow to Interface Mapping
- IP Flow destination address and port, source address and port, and protocol
- RTP Synchronization Source (SSRC)
- IP Octets Count
- Media Stream Packet Count
- Media Stream Octect Count
- Media Byte Rate
- Media Byte Count
- Media Packet Rate
- Media Packet Loss Count
- Media Packet Loss Rate
- Packets Expected Count
- Measured Rate
- Media Loss Event Count
- Round Trip Time (RTT)
- Interarrival Jitter (RFC3550) max
- Interarrival Jitter (RFC3550) min 2
- Interarrival Jitter (RFC3550) mean
- Media Rate Variation
- Monitor Event
- Media Error
- Media Stop
- IP Byte Count
- IP Byte Rate
- IP Source Mask
- IP Destination Mask
- Epoch of A Monitoring Interval
- Packet Forwarding Status
- Packet Drops
- DSCP and IPv6 Traffic Class
SNMP MIB Support for Cisco Performance Monitor
Cisco Performance Monitor provides support for the use of the industry-standard Simple Network Management Protocol (SNMP) to monitor media streams. This support is implemented with the addition of the following Cisco proprietary SNMP Management Information Base (MIB) modules:
- CISCO-FLOW-MONITOR-TC-MIB--Defines the textual conventions common to the following MIB modules.
- CISCO-FLOW-MONITOR-MIB--Defines the framework that describes the flow monitors supported by a system, the flows that it has learned, and the flow metrics collected for those flows.
- CISCO-RTP-METRICS-MIB--Defines objects that describe the quality metrics collected for RTP streams, similar to those described by an RTCP Receiver Report packet (RFC 3550).
- CISCO-IP-CBR-METRICS-MIB--Defines objects that describe the quality metrics collected for IP streams that have a Constant Bit Rate (CBR).
For detailed information about these MIBs, and to locate and download MIBs for selected platforms, Cisco IOS releases, and feature sets, use Cisco MIB Locator found at http://www.cisco.com/go/mibs .
This feature also includes two new command-line interface (CLI) commands and one modified CLI command. The commands are as follows:
- snmp-server host --Enables the delivery of flow monitoring SNMP notifications to a recipient.
- snmp-server enable traps flowmon --Enables flow monitoring SNMP notifications. By default, flow monitoring SNMP notifications are disabled.
- snmp mib flowmon alarm history --Sets the maximum number of entries maintained by the flow monitor alarm history log.
For more information about these commands, see the Cisco IOS Master Command List .
Limitations for the Catalyst 6500 Platform
Cisco Performance Monitor has the following limitations on the Catalyst 6000 platform:
- There are some limitations on which types of interfaces can be monitored. The next two tables list which types of interfaces are supported for ingress and egress monitoring on the Catalyst 6500 platform.
| Table 1 | Support for Ingress Interfaces |
|
Interface Type |
Support |
|---|---|
|
Layer 3 Routed Port |
Yes |
|
Layer 3 Sub-interface (a) |
No |
|
Layer 3 port channels |
Yes |
|
Layer 3 port-channel sub-interface (a) |
No |
|
Layer 3 SVI (b) |
Partial (see the third bullet below) |
|
L3 Tunnels |
No |
|
Layer 2 Physical (Switched) Ports |
Yes |
|
Layer 2 Port-channels |
Yes |
|
Layer 2 Vlans |
Yes |
| Table 2 | Support for Egress Interfaces |
|
Interface Type |
Support |
|---|---|
|
Layer 3 Routed Port |
Yes |
|
Layer 3 Sub-interface (a) |
Yes |
|
Layer 3 port channels |
Yes |
|
Layer 3 port-channel sub-interface (a) |
Yes |
|
Layer 3 SVI (b) |
Yes |
|
L3 Tunnels |
No |
|
Layer 2 Physical (Switched) Ports |
No |
|
Layer 2 Port-channels |
No |
|
Layer 2 Vlans |
Yes |
- Performance monitoring on VRFs is not supported.
- Performance Monitoring of multicast flows is not supported.
-
Routed traffic from a trunk port on a VLAN interface cannot not be monitored because it is not possible to identify the source VLAN interface for the traffic. You will see the following syslog message: "Routed traffic from trunk ports will not be monitored by ingress policy on VLAN interface."
For a workaround, you can configure a performance monitoring policy on a trunk interface. This monitoring will result in additional CPU usage.
- You cannot use match all type Class maps. Only match any type of lookups are supported. If you configure performance monitoring to use match-all type class maps, it will result in the cloning of packet to the CPU. Packets will then again be classified in the CPU when match-all classes are properly applied and packet are dropped if required. This causes higher than expected CPU usage.
- Performance monitoring policy on the egress of a VLAN interface will not monitor traffic getting bridged within the VLAN. This is due to hardware limitation. Workaround is to apply the policy at the ingress of VLAN interface as well as egress. Policy on the ingress of the VLAN interface will monitor bridged packets.
- Cloned packets from Egress policies can only be software rate-limited. No hardware-based protection is available for these packets. Therefore, you might see high interrupt CPU usage during scenarios when many flows are being monitored.
- Egress performance monitoring makes use of a recirculation mechanism on the Catalyst 6500 platform. This introduces several microseconds of additional latency to the frame switching.
- Performance monitoring is not supported for the packets switched using the Fast (CEF) Path.
- Lawful intercept and performance monitoring makes use of the same mechanism for cloning the packets. The Lawful Intercept feature takes precedence over performance monitoring. Therefore, performance monitoring does not function when the Lawful Intercept feature is enabled. When this occurs, a syslog message is created.
- Performance monitoring makes use of same mechanism as other features, such as Optimized ACL logging, VACL Capture, IPv6 Copy, and so on. The feature that is enabled first takes precedence. The other features are blocked from being configured and a syslog message is created.
How to Configure Troubleshoot and Maintain Cisco Performance Monitor
- Configuring a Flow Exporter for Cisco Performance Monitor
- Configuring a Flow Record for Cisco Performance Monitor
- Configuring a Flow Monitor for Cisco Performance Monitor
- Configuring a Flow Class for Cisco Performance Monitor
- Configuring a Flow Policy for Cisco Performance Monitor Using an Existing Flow Monitor
- Configuring a Flow Policy for Cisco Performance Monitor Without Using an Existing Flow Monitor
- Applying a Cisco Performance Monitor Policy to an Interface Using an Existing Flow Policy
- Applying a Cisco Performance Monitor Policy to an Interface Without Using an Existing Flow Policy
- Verifying That Cisco Performance Monitor Is Collecting Data
- Displaying Information Specific to the Catalyst 6500 Platform
- Displaying the Performance Monitor Cache and Clients
- Displaying the Clock Rate for Cisco Performance Monitor Classes
- Displaying the Current Status of a Flow Monitor
- Verifying the Flow Monitor Configuration
- Verifying That Cisco IOS Flexible NetFlow and Cisco Performance Monitor Is Enabled on an Interface
- Displaying the Flow Monitor Cache
- Displaying the Current Status of a Flow Exporter
- Verifying the Flow Exporter Configuration
- Enabling Debugging
Configuring a Flow Exporter for Cisco Performance Monitor
Flow exporters are used to send the data that you collect with Cisco Performance Monitor to a remote system such as a NetFlow Collection Engine. Flow exporters use user datagram protocol (UDP) as the transport protocol and use the Version 9 export format.
To configure a flow exporter for the flow monitor, in order to export the data that is collected by Cisco Performance Monitor to a remote system for further analysis and storage, perform the following optional task. For Cisco Performance Monitor, flow exporters are configured the same way as they are configured for Cisco IOS Flexible NetFlow. For more information. see Configuring Data Export for Cisco IOS Flexible NetFlow with Flow Exporters.
 Note | Each flow exporter supports only one destination. If you want to export the data to multiple destinations, you must configure multiple flow exporters and assign them to the flow monitor. |
DETAILED STEPS
Configuring a Flow Record for Cisco Performance Monitor
The basic concepts and techniques for configuring a flow record for Cisco Performance Monitor are the same as flow records for Flexible NetFlow. The flow record specifies how the data collected data is aggregated and presented. The only significant difference is that, for Cisco Performance Monitor, the command includes type performance-monitor.
DETAILED STEPS
Configuring a Flow Monitor for Cisco Performance Monitor
The basic concepts for configuring a flow monitor for Cisco Performance Monitor are the same as flow monitors for Flexible NetFlow. Each flow monitor has a separate cache assigned to it and requires a record to define the contents and layout of its cache entries.
When you configure a flow monitor, you must use either:
- An existing flow record that you configured
-
One of the following default predefined records:
- The default RTP record (default-rtp)
- The default TCP record (default-tcp)
- Flexible NetFlow's "NetFlow IPv4 original input"
Note | To modify a flow record, you must remove it from all flow monitors it is associated with. > |
DETAILED STEPS
Configuring a Flow Class for Cisco Performance Monitor
The basic concepts and techniques for configuring a class for Cisco Performance Monitor are the same as for any other type of class. The class specifies the filter that determines which flow traffic to monitor. The filter is configured using various match commands in class-map mode.
If you do not already have a flow monitor configured, you can either:
Note | Nested class maps are not supported. In other words, you cannot use the class-map command while in class-map configuration mode (config-cmap). |
DETAILED STEPS
Configuring a Flow Policy for Cisco Performance Monitor Using an Existing Flow Monitor
The basic concepts and techniques for configuring a class for Cisco Performance Monitor are the same as for any other type of class. The class specifies which flow monitor is included. The only significant difference is that, for Cisco Performance Monitor, the policy-mapcommand includes type performance-monitor.
If you do not already have a flow monitor configured or do not want to use any of your existing flow monitors for a new class, you can configure it using the flow monitor inline option and specifying which flow record and flow exporter are included.
DETAILED STEPS
| Command or Action | Purpose | |
|---|---|---|
Step 1 |
enable
Example: Router> enable |
Enables privileged EXEC mode.
|
Step 2 |
configure
terminal
Example: Router# configure terminal |
Enters global configuration mode. |
Step 3 |
policy-map
type
performance-monitor
policy-name
Example: Router(config)# policy-map type preformance-monitor FLOW-MONITOR-4 |
Creates a policy and enters policy configuration mode.
|
Step 4 |
class
{class-name |
class-default}
Example: Router(config-pmap)# class class-4 |
Specifies a class to include in the policy. Repeat this command for each class that you want to include in the policy. |
Step 5 |
flow
monitor
monitor-name
Example: Router(config-pmap-c)# flow monitor FLOW-MONITOR-4 |
Enters flow monitor configuration mode. If you do not want to use an existing flow monitor, you can use the inline option to configure a new one, as described in the Configuring a Flow Policy for Cisco Performance Monitor Without Using an Existing Flow Monitor. |
Step 6 | monitor metric ip-cbr
Example: Router(config-pmap-c)# monitor metric ip-cbr |
(Optional) Enters IP-CBR monitor metric configuration mode. |
Step 7 |
rate
layer3
{byte-rate {bps |
kbps |
mbps |
gbps} |
packet}
Example: Router(config-pmap-c-mipcbr)# rate layer3 248 mbps |
(Optional) Specifies the rate for monitoring the metrics.
|
Step 8 |
exit
Example: Router(config-pmap-c-mipcbr)# exit |
Returns to policy class configuration mode. |
Step 9 |
monitor
metric
rtp
Example: Router(config-pmap-c)# monitor metric rtp |
Enters RTP monitor metric configuration mode. |
Step 10 |
clock-rate
{type-number|
type-name |
default}
rate
Example: Router(config-pmap-c-mrtp)# clock-rate 8 9600 |
Specifies the clock rate used to sample RTP video-monitoring metrics. For more information about the clock-type numbers and names, see the Cisco Media Monitoring Command Reference. The range for rate is 1 kHz to 192 kHz. |
Step 11 |
max-dropout
number
Example: Router(config-pmap-c-mrtp)# max-dropout 2 |
Specifies the maximum number of dropouts allowed when sampling RTP video-monitoring metrics. |
Step 12 |
max-reorder
number
Example: Router(config-pmap-c-mrtp)# max-reorder 4 |
Specifies the maximum number of reorders allowed when sampling RTP video-monitoring metrics. |
Step 13 |
min-sequential
number
Example: Router(config-pmap-c-mrtp)# min-sequential 2 |
Specifies the minimum number of sequental packets required to identify a stream as being an RTP flow. |
Step 14 |
ssrc
maximum
number
Example: Router(config-pmap-c-mrtp)# ssrc maximum 20 |
Specifies the maximum number of SSRCs that can be monitored within the same flow. A flow is defined by the protocol, source/destination address, and source/destination port). |
Step 15 | exit
Example: Router(config-pmap-c-mrtp)# exit |
Returns to policy class configuration mode. |
Step 16 |
monitor
parameters
Example: Router(config-pmap-c)# monitor parameters |
Enters monitor parameters configuration mode. |
Step 17 |
flows
number
Example: Router(config-pmap-c-mparam)# flows 40 |
Specifies the maximum number of flows for each monitor cache. |
Step 18 |
interval
duration
number
Example: Router(config-pmap-c-mparam)# interval duration 40 |
Specifies the interval, in seconds, between samples taken of video-monitoring metrics. |
Step 19 |
history
number
Example: Router(config-pmap-c-mparam)# history 4 |
Specifies the number of historical buckets of collected video-monitoring metrics. |
Step 20 |
timeout
number
Example: Router(config-pmap-c-mparam)# timeout 20 |
Specifies the number of intervals before a stopped flow is removed from the database. |
Step 21 |
exit
Example: Router(config-pmap-c-mparam)# exit |
Returns to policy class configuration mode. |
Step 22 |
react
ID
{media-stop |
mrv |
rtp-jitter-average |
transport-packets-lost-rate}
Example: Router(config-pmap-c)# react 41 rtp-jitter-average |
Enters a mode where you can specify what reaction occurs when a threshold is violated for the following metrics:
|
Step 23 |
action
{snmp |
syslog}
Example: Router(config-pmap-c-react)# action syslog |
Specifies how violations of the thresholds with be reported. |
Step 24 |
alarm
severity
{alert|
critical|
emergency|
error |
info}
Example: Router(config-pmap-c-react)# alarm severity critical |
Specifies which level of alarm will be reported.The default setting is info. |
Step 25 |
alarm
type
{discrete|
grouped
{count
number |
percent
number}
Example: Router(config-pmap-c-react)# alarm type discrete |
Specifies which types of levels are considered alarms that require reporting. The default setting is discrete. |
Step 26 |
threshold
value
{ge
number |
gt
number |
le
number |
lt
number |
range
rng-start
rng-end}
Example: Router(config-pmap-c-react)# threshold value ge 20 |
Specifies which types of levels values are considered alarms that require reporting. |
Step 27 |
description
description
Example: Router(config-cmap-c-react)# description rtp-jitter-average above 40 |
(Optional) Creates a description for the reaction. |
Step 28 |
end
Example: Router(config-pmap-c-react)# end |
Exits the current configuration mode and returns to privileged EXEC mode. |
Configuring a Flow Policy for Cisco Performance Monitor Without Using an Existing Flow Monitor
The basic concepts and techniques for configuring a class for Cisco Performance Monitor are the same as for any other type of class. The class specifies which flow monitor is included. The only significant difference is that, for Cisco Performance Monitor, the policy-mapcommand includes type performance-monitor.
If you do not already have a flow monitor configured or do not want to use any of your existing flow monitors for a new class, you can configure it under the class configuration mode, by specifying which flow record and flow exporter are included.
DETAILED STEPS
Applying a Cisco Performance Monitor Policy to an Interface Using an Existing Flow Policy
Before it can be activated, a Cisco Performance Monitor policy must be applied to at least one interface. To activate a Cisco Performance Monitor policy, perform the following required task.
DETAILED STEPS
Applying a Cisco Performance Monitor Policy to an Interface Without Using an Existing Flow Policy
Before it can be activated, a Cisco Performance Monitor policy must be applied to at least one interface. To activate a Cisco Performance Monitor policy, perform the following required task.
DETAILED STEPS
To check the configuration and status of your service policy, use the show performance monitor statuscommand and show performance monitor historycommand.
Verifying That Cisco Performance Monitor Is Collecting Data
To verify that Cisco Performance Monitor is collecting data, perform the following optional task.
If no data is being collected, complete the remaining tasks in this section.
The interface to which you applied the input flow monitor must be receiving traffic that meets the criteria defined by the original flow record before you can display the flows in the flow monitor cache.
where filter = {ip {source-addr source-prefix | any} {dst-addr dst-prefix | any} | {tcp | udp} {source-addr source-prefix | any} {[eq| lt| gt number| range min max| ssrc {ssrc-number | any} | {{dst-addr dst-prefix | any} eq| lt| gt number| range min max| ssrc {ssrc-number | any}}
DETAILED STEPS
Displaying Information Specific to the Catalyst 6500 Platform
To display or clear information for the Feature Manager and other functionality specific to the Catalyst 6500 platform, perform the following optional task.
DETAILED STEPS
| Step 1 |
enable
The enable command enters privileged EXEC mode (enter the password if prompted). Example:
Router> enable
Router#
|
| Step 2 |
clear
fm
performance-monitor
counters
The clearfm performance-monitor counters command clears counters for the Performance Monitor component of Feature Monitor. Example:
Router# clear fm performance-monitor counters
Router#
|
| Step 3 |
debug
fm
performance-monitor {all |
dynamic
|
event |
unusual |
verbose |
vmr}
This command enables all levels of debugging for the Performance Monitor component of Feature Manager. Example:
Router# debug fm performance-monitor all
Router#
|
| Step 4 |
platform
performance-monitor
rate-limit
pps
number
This command sets the rate limit for the Performance Monitor component of Feature Monitor. Example:
Router# platform performance-monitor rate-limit pps 2000
Router#
|
| Step 5 |
show
platform
software
feature-manager
performance-monitor {all |
counters
|
interface
interface-type interface-number |
rdt-indices }
This command displays information about the Performance Monitor component of Feature Manager. Example:
Router# show platform software feature-manager performance-monitor all
Router#
Interface: FastEthernet2/3
Policy: video-flow-test Group ID: A0000001
-----------------------------------------------------------------------------
Feature: VM Ingress L3
=============================================================================
DPort - Destination Port SPort - Source Port Pro - Protocol
RFTCM - R-Recirc. Flag MRLCS - M-Multicast Flag Res - VMR Result
- F-Fragment flag - R-Reflexive flag Prec - Drop Precedence
- T-Trailing Fragments - L-Layer 3 only GrpId - Qos Group Id
- C-From CPU - C-Capture Flag Adj. - Adj. Index
- M-L2 Lookup Miss - S-RPF suppress Pid - NF Profile Index
+-----+--+-----------------+-------------------+-------+-------+----+---------+------+---------+-----+--------+
| Indx | T | Dest Ip Addr | Source Ip Addr | DPort | SPort | Pro | RFTCM | Prec | MRLCS | Pid | Stats Id|
+-----+--+-----------------+-------------------+-------+-------+----+---------+------+---------+-----+--------+
1 V 224.0.0.0 0.0.0.0 0 0 0 ----- 0 -----
M 240.0.0.0 0.0.0.0 0 0 0 00000 0 0
PERMIT_RESULT
2 V 0.0.0.0 0.0.0.0 0 0 0 ----- 0 -----
M 0.0.0.0 0.0.0.0 0 0 0 00000 0 0
L3_DENY_RESULT
+-----+--+-----------------+-------------------+-------+-------+----+---------+------+---------+-----+--------+
| Indx | T | Dest Ip Addr | Source Ip Addr | DPort | SPort | Pro | RFTCM | Prec | MRLCS | Pid | Stats Id|
+-----+--+-----------------+-------------------+-------+-------+----+---------+------+---------+-----+--------+
1 V 0.0.0.0 10.10.10.0 0 0 17 ----- 0 ---C-
M 0.0.0.0 255.255.255 0 0 0 255 00000 0 0
PERMIT_RESULT
2 V 0.0.0.0 10.10.20.0 0 0 17 ----- 0 ---C-
M 0.0.0.0 255.255.255 0 0 0 255 00000 0 0
PERMIT_RESULT
3 V 0.0.0.0 0.0.0.0 0 0 0 ----- 0 -----
M 0.0.0.0 0.0.0.0 0 0 0 00000 0 0
L3_DENY_RESULT
+-----+--+-----------------+-------------------+-------+-------+----+---------+------+---------+-----+--------+
| Indx | T | Dest Ip Addr | Source Ip Addr | DPort | SPort | Pro | RFTCM | Prec | MRLCS | Pid | Stats Id|
+-----+--+-----------------+-------------------+-------+-------+----+---------+------+---------+-----+--------+
1 V 0.0.0.0 0.0.0.0 0 0 0 ----- 0 -----
M 0.0.0.0 0.0.0.0 0 0 0 00000 0 0
PERMIT_RESULT
Interface: FastEthernet2/3
Policy: video-flow-test Group ID: A0000001
-----------------------------------------------------------------------------
Feature: VM Egress L3
=============================================================================
+-----+--+-----------------+-------------------+-------+-------+----+---------+------+---------+-----+--------+
| Indx | T | Dest Ip Addr | Source Ip Addr | DPort | SPort | Pro | RFTCM | Prec | MRLCS | Pid | Stats Id|
+-----+--+-----------------+-------------------+-------+-------+----+---------+------+---------+-----+--------+
1 V 0.0.0.0 0.0.0.0 0 0 0 ----- 0 -----
M 0.0.0.0 0.0.0.0 0 0 0 00000 0 0
PERMIT_RESULT
2 V 0.0.0.0 0.0.0.0 0 0 0 ----- 0 -----
M 0.0.0.0 0.0.0.0 0 0 0 00000 0 0
L3_DENY_RESULT
+-----+--+-----------------+-------------------+-------+-------+----+---------+------+---------+-----+--------+
| Indx | T | Dest Ip Addr | Source Ip Addr | DPort | SPort | Pro | RFTCM | Prec | MRLCS | Pid | Stats Id|
+-----+--+-----------------+-------------------+-------+-------+----+---------+------+---------+-----+--------+
1 V 0.0.0.0 10.10.10.0 0 0 17 ----- 0 -----
M 0.0.0.0 255.255.255 0 0 0 255 00000 0 0
PERMIT_RESULT Adjacency: 0x5512D8F4
2 V 0.0.0.0 10.10.20.0 0 0 17 ----- 0 -----
M 0.0.0.0 255.255.255 0 0 0 255 00000 0 0
PERMIT_RESULT Adjacency: 0x5512D8F4
3 V 0.0.0.0 0.0.0.0 0 0 0 ----- 0 -----
M 0.0.0.0 0.0.0.0 0 0 0 00000 0 0
L3_DENY_RESULT
+-----+--+-----------------+-------------------+-------+-------+----+---------+------+---------+-----+--------+
| Indx | T | Dest Ip Addr | Source Ip Addr | DPort | SPort | Pro | RFTCM | Prec | MRLCS | Pid | Stats Id|
+-----+--+-----------------+-------------------+-------+-------+----+---------+------+---------+-----+--------+
3 V 0.0.0.0 0.0.0.0 0 0 0 ----- 0 -----
M 0.0.0.0 0.0.0.0 0 0 0 00000 0 0
PERMIT_RESULT Adjacency: 0x5512D8F4
Adjacency: 0x5512D8F4
FeatureId: 0x84 AdjId: 0xFFFFFFFF Flags: RecirculationAdj|
Cause: 0x0 Priority: 0xC Router#
Interface: FastEthernet2/3
Policy: video-flow-test Group ID: A0000001
-----------------------------------------------------------------------------
Feature: VM Ingress L3
=============================================================================
DPort - Destination Port SPort - Source Port Pro - Protocol
RFTCM - R-Recirc. Flag MRLCS - M-Multicast Flag Res - VMR Result
- F-Fragment flag - R-Reflexive flag Prec - Drop Precedence
- T-Trailing Fragments - L-Layer 3 only GrpId - Qos Group Id
- C-From CPU - C-Capture Flag Adj. - Adj. Index
- M-L2 Lookup Miss - S-RPF suppress Pid - NF Profile Index
+-----+--+-----------------+-------------------+-------+-------+----+---------+------+---------+-----+--------+
| Indx | T | Dest Ip Addr | Source Ip Addr | DPort | SPort | Pro | RFTCM | Prec | MRLCS | Pid | Stats Id|
+-----+--+-----------------+-------------------+-------+-------+----+---------+------+---------+-----+--------+
1 V 224.0.0.0 0.0.0.0 0 0 0 ----- 0 -----
M 240.0.0.0 0.0.0.0 0 0 0 00000 0 0
PERMIT_RESULT
2 V 0.0.0.0 0.0.0.0 0 0 0 ----- 0 -----
M 0.0.0.0 0.0.0.0 0 0 0 00000 0 0
L3_DENY_RESULT
+-----+--+-----------------+-------------------+-------+-------+----+---------+------+---------+-----+--------+
| Indx | T | Dest Ip Addr | Source Ip Addr | DPort | SPort | Pro | RFTCM | Prec | MRLCS | Pid | Stats Id|
+-----+--+-----------------+-------------------+-------+-------+----+---------+------+---------+-----+--------+
1 V 0.0.0.0 10.10.10.0 0 0 17 ----- 0 ---C-
M 0.0.0.0 255.255.255 0 0 0 255 00000 0 0
PERMIT_RESULT
2 V 0.0.0.0 10.10.20.0 0 0 17 ----- 0 ---C-
M 0.0.0.0 255.255.255 0 0 0 255 00000 0 0
PERMIT_RESULT
3 V 0.0.0.0 0.0.0.0 0 0 0 ----- 0 -----
M 0.0.0.0 0.0.0.0 0 0 0 00000 0 0
L3_DENY_RESULT
+-----+--+-----------------+-------------------+-------+-------+----+---------+------+---------+-----+--------+
| Indx | T | Dest Ip Addr | Source Ip Addr | DPort | SPort | Pro | RFTCM | Prec | MRLCS | Pid | Stats Id|
+-----+--+-----------------+-------------------+-------+-------+----+---------+------+---------+-----+--------+
1 V 0.0.0.0 0.0.0.0 0 0 0 ----- 0 -----
M 0.0.0.0 0.0.0.0 0 0 0 00000 0 0
PERMIT_RESULT
Interface: FastEthernet2/3
Policy: video-flow-test Group ID: A0000001
-----------------------------------------------------------------------------
Feature: VM Egress L3
=============================================================================
+-----+--+-----------------+-------------------+-------+-------+----+---------+------+---------+-----+--------+
| Indx | T | Dest Ip Addr | Source Ip Addr | DPort | SPort | Pro | RFTCM | Prec | MRLCS | Pid | Stats Id|
+-----+--+-----------------+-------------------+-------+-------+----+---------+------+---------+-----+--------+
1 V 0.0.0.0 0.0.0.0 0 0 0 ----- 0 -----
M 0.0.0.0 0.0.0.0 0 0 0 00000 0 0
PERMIT_RESULT
2 V 0.0.0.0 0.0.0.0 0 0 0 ----- 0 -----
M 0.0.0.0 0.0.0.0 0 0 0 00000 0 0
L3_DENY_RESULT
+-----+--+-----------------+-------------------+-------+-------+----+---------+------+---------+-----+--------+
| Indx | T | Dest Ip Addr | Source Ip Addr | DPort | SPort | Pro | RFTCM | Prec | MRLCS | Pid | Stats Id|
+-----+--+-----------------+-------------------+-------+-------+----+---------+------+---------+-----+--------+
1 V 0.0.0.0 10.10.10.0 0 0 17 ----- 0 -----
M 0.0.0.0 255.255.255 0 0 0 255 00000 0 0
PERMIT_RESULT Adjacency: 0x5512D8F4
2 V 0.0.0.0 10.10.20.0 0 0 17 ----- 0 -----
M 0.0.0.0 255.255.255 0 0 0 255 00000 0 0
PERMIT_RESULT Adjacency: 0x5512D8F4
3 V 0.0.0.0 0.0.0.0 0 0 0 ----- 0 -----
M 0.0.0.0 0.0.0.0 0 0 0 00000 0 0
L3_DENY_RESULT
+-----+--+-----------------+-------------------+-------+-------+----+---------+------+---------+-----+--------+
| Indx | T | Dest Ip Addr | Source Ip Addr | DPort | SPort | Pro | RFTCM | Prec | MRLCS | Pid | Stats Id|
+-----+--+-----------------+-------------------+-------+-------+----+---------+------+---------+-----+--------+
3 V 0.0.0.0 0.0.0.0 0 0 0 ----- 0 -----
M 0.0.0.0 0.0.0.0 0 0 0 00000 0 0
PERMIT_RESULT Adjacency: 0x5512D8F4
Adjacency: 0x5512D8F4
FeatureId: 0x84 AdjId: 0xFFFFFFFF Flags: RecirculationAdj|
Cause: 0x0 Priority: 0xC
|
| Step 6 |
show
platform
software
feature-manager
tcam
dynamic
performance-monitor
{handle ip
ip-address
|
interface
interface-type interface-number }
This command displays information about dynamic and static policies for a specific host. Example:
Router# show platform software feature-manager tcam dynamic performance-monitor handle ip 10.1.1.0
-----------------------------------------------------------------------------
HANDLE Feature ID No of entries MD5
-----------------------------------------------------------------------------
10.1.1.0 VM Ingress L3 2
|
| Step 7 |
show
platform
hardware
acl
entry
interface
interface-type interface-number
security {in
|
out } {ip
|
ipv6 } [
detail ]
This command displays inbound access control list (ACL) entries for IP on an interface. Example:
Router# show platform hardware acl entry interface fastEthernet 1/1 security in ip detail
mls_if_index:2000400A dir:0 feature:0 proto:0
pass#0 features
UAPRSF: U-urg, A-ack, P-psh, R-rst, S-syn, F-fin
MLGFI: M-mpls_plus_ip_pkt, L-L4_hdr_vld, G-gpid_present,F-global_fmt_match, I-ife/ofe
's' means set; 'u' means unset; '-' means don't care
---------------------------------------------------------------------------------------------------------------------------------------------------
INDEX LABEL FS ACOS AS IP_SA SRC_PORT IP_DA DST_PORT F FF L4PROT
TCP-F:UAPRSF MLGFI OtherL4OPs RSLT CNT
--------------------------------------------------------------------------------------------------------------------------------------------------
fno:0
tcam:B, bank:0, prot:0 Aces
I V 16375 2049 0 0 0 0.0.0.0 - 0.0.0.0 - 0 0 0 - ----- -
0x0000000800000038 10331192<-
I M 16375 0x1FFF 0 0x00 0x000 0.0.0.0 - 0.0.0.0 - 0 0 0x0
|
| Step 8 |
show
platform
software
ccm
interface
interface-type interface-number
security {interface
interface-type interface-number |
class-group
class-group-ID
}
This command displays information about ternary content addressable memory (TCAM) Cisco CallManager (CCM) entries on an interface. Example:
Router# show platform software ccm interface fastEthernet 2/3 in
Target-Class : id 0xA0000000, dir CCM_INPUT, if_type 1, if_info 0x14823998
Class-Group List: 0xA0000001
b1-cs217#
b1-cs217#sh platform software ccm interface fastEthernet 2/3 out
Target-Class : id 0xA0000002, dir CCM_OUTPUT, if_type 1, if_info 0x14823998
Class-Group List: 0xA0000001
This command displays information about ternary content addressable memory (TCAM) Cisco CallManager (CCM) entries for a class group Example:
Router# show platform software ccm class-group A0000001
Class-group : video-flow-test, id 0xA0000001
Target input : 0xA0000000
Target Output : 0xA0000002
Class : video-flow, id 0xA98681, type 1
Filter : type MATCH_NUMBERED_ACCESS_GROUP, id 0xF0000002
Filter params : ACL Index: 101 Linktype: 7
Feature : PERFORMANCE_MONITOR
Params :
Feature Object : 0x54224218
Name :
Meter context : 0x54264440
Sibling : 0x0
Dynamic : FALSE
Feature Object : 0x54221170
Name :
Meter context : 0x54263858
Sibling : 0x0
Dynamic : FALSE
Intf List : 0xA0000000 0xA0000002
Class : class-default, id 0xADA3F1, type 39
Filter : type MATCH_ANY, id 0xF0000003
Filter params : any
Feature : FEATURE_EMPTY
Params :
Feature Object : 0x1741629C
Name :
Meter context : 0x0
Sibling : 0x0
Dynamic : FALSE
Intf List : 0xA0000000 0xA0000002
|
Displaying the Performance Monitor Cache and Clients
To display the cache and the clients for Cisco Performance Monitor, perform the following optional task.
DETAILED STEPS
| Step 1 |
enable
The enable command enters privileged EXEC mode (enter the password if prompted). Example:
Router> enable
Router#
|
| Step 2 |
show
performance
monitor
cache
[policy
policy-map-name
class
class-map-name][interface
interface
name]
Example: MMON Metering Layer Stats: static pkt cnt: 3049 static cce sb cnt: 57 dynamic pkt cnt: 0 Cache type: Permanent Cache size: 2000 Current entries: 8 High Watermark: 9 Flows added: 9 Updates sent ( 1800 secs) 0 IPV4 SRC ADDR IPV4 DST ADDR IP PROT TRNS SRC PORT TRNS DST PORT ipv4 ttl ipv4 ttl min ipv4 ttl max ipv4 dscp bytes long perm pktslong perm user space vm ========================================================================================== 10.1.1.1 10.1.2.3 17 4000 1967 0 0 0 0x00 80 1 0x00000000 0x00000000 0x00000000 0x00000000 0x00000000 0x00000000 0x00000000 0x00000000 0x00000000 0x00000000 0x00000000 0x00000000 0x00000000 0x00000000 0x00000000 0x00000000 0x00000000 0x00000000 0x00000000 0x00000000 0x00000000 0x00000000 0x00000000 0x00000000 0x00000000 0x00000000 0x00000000 0x00000000 0x00000000 0x00000000 0x00000000 0x00000000 0x00000000 0x00000000 0x00000000 0x00000000 0x00000000 0x00000000 0x00000000 0x00000000 0x00000000 0x00000000 10.1.1.1 10.1.2.3 17 6000 1967 0 0 0 0x00 80 1 0x00000000 0x00000000 0x00000000 0x00000000 0x00000000 0x00000000 0x00000000 0x00000000 0x00000000 0x00000000 0x00000000 0x00000000 0x00000000 0x00000000 0x00000000 0x00000000 0x00000000 0x00000000 0x00000000 0x00000000 0x00000000 0x00000000 0x00000000 0x00000000 0x00000000 0x00000000 0x00000000 0x00000000 0x00000000 0x00000000 0x00000000 0x00000000 0x00000000 0x00000000 0x00000000 0x00000000 0x00000000 0x00000000 0x00000000 0x00000000 0x00000000 0x00000000 10.1.1.1 10.1.2.3 17 4000 2000 0 0 0 0x00 44 1 0x00000000 0x00000000 0x00000000 0x00000000 0x00000000 0x00000000 0x00000000 0x00000000 0x00000000 0x00000000 0x00000000 0x00000000 0x00000000 0x00000000 0x00000000 0x00000000 0x00000000 0x00000000 0x00000000 0x00000000 0x00000000 0x00000000 0x00000000 0x00000000 0x00000000 0x00000000 0x00000000 0x00000000 0x00000000 0x00000000 0x00000000 0x00000000 0x00000000 0x00000000 0x00000000 0x00000000 0x00000000 0x00000000 0x00000000 0x00000000 0x00000000 0x00000000 10.1.1.1 10.1.2.3 6 6000 3000 0 0 0 0x00 84 2 0x00000000 0x00000000 0x00000000 0x00000000 0x00000000 0x00000000 0x00000000 0x00000000 0x00000000 0x00000000 0x00000000 0x00000000 0x00000000 0x00000000 0x00000000 0x00000000 0x00000000 0x00000000 0x00000000 0x00000000 0x00000000 0x00000000 0x00000000 0x00000000 0x00000000 0x00000000 0x00000000 0x00000000 0x00000000 0x00000000 0x00000000 0x00000000 0x00000000 0x00000000 0x00000000 0x00000000 0x00000000 0x00000000 0x00000000 0x00000000 0x00000000 0x00000000 10.1.1.1 10.1.2.3 17 1967 6001 0 0 0 0x00 36 1 0x00000000 0x00000000 0x00000000 0x00000000 0x00000000 0x00000000 0x00000000 0x00000000 0x00000000 0x00000000 0x00000000 0x00000000 0x00000000 0x00000000 0x00000000 0x00000000 0x00000000 0x00000000 0x00000000 0x00000000 0x00000000 0x00000000 0x00000000 0x00000000 0x00000000 0x00000000 0x00000000 0x00000000 0x00000000 0x00000000 0x00000000 0x00000000 0x00000000 0x00000000 0x00000000 0x00000000 0x00000000 0x00000000 0x00000000 0x00000000 0x00000000 0x00000000 10.1.1.1 10.1.2.3 17 1967 4001 0 0 0 0x00 36 1 0x00000000 0x00000000 0x00000000 0x00000000 0x00000000 0x00000000 0x00000000 0x00000000 0x00000000 0x00000000 0x00000000 0x00000000 0x00000000 0x00000000 0x00000000 0x00000000 0x00000000 0x00000000 0x00000000 0x00000000 0x00000000 0x00000000 0x00000000 0x00000000 0x00000000 0x00000000 0x00000000 0x00000000 0x00000000 0x00000000 0x00000000 0x00000000 0x00000000 0x00000000 0x00000000 0x00000000 0x00000000 0x00000000 0x00000000 0x00000000 0x00000000 0x00000000 10.1.1.1 10.1.2.3 6 3001 6001 0 0 0 0x00 124 3 0x00000000 0x00000000 0x00000000 0x00000000 0x00000000 0x00000000 0x00000000 0x00000000 0x00000000 0x00000000 0x00000000 0x00000000 0x00000000 0x00000000 0x00000000 0x00000000 0x00000000 0x00000000 0x00000000 0x00000000 0x00000000 0x00000000 0x00000000 0x00000000 0x00000000 0x00000000 0x00000000 0x00000000 0x00000000 0x00000000 0x00000000 0x00000000 0x00000000 0x00000000 0x00000000 0x00000000 0x00000000 0x00000000 0x00000000 0x00000000 0x00000000 0x00000000 10.1.1.1 10.1.2.3 17 2001 4001 0 0 0 0x00 44 1 0x00000000 0x00000000 0x00000000 0x00000000 0x00000000 0x00000000 0x00000000 0x00000000 0x00000000 0x00000000 0x00000000 0x00000000 0x00000000 0x00000000 0x00000000 0x00000000 0x00000000 0x00000000 0x00000000 0x00000000 0x00000000 0x00000000 0x00000000 0x00000000 0x00000000 0x00000000 0x00000000 0x00000000 0x00000000 0x00000000 0x00000000 0x00000000 0x00000000 0x00000000 0x00000000 0x00000000 0x00000000 0x00000000 0x00000000 0x00000000 0x00000000 0x00000000 |
| Step 3 |
show
performance
monitor
clients
detail
all
Example:
Client name for ID 1 : Mediatrace-131419052
Type: Mediatrace
Age: 443 seconds
Monitor Object: _MMON_DYN_-class-map-69
Flow spec: (dvmc-acl#47) 10.10.130.2 1000 10.10.132.2 2000 17
monitor parameters
interval duration 60
timeout 2
history 1
flows 100
monitor metric rtp
min-sequential 10
max-dropout 5
max-reorder 5
clock-rate 112 90000
clock-rate default 90000
ssrc maximum 20
monitor metric ip-cbr
rate layer3 packet 20
Flow record: dvmc_fnf_fdef_47
Key fields:
ipv4 source address
ipv4 destination address
transport source-port
transport destination-port
ip protocol
Non-key fields:
monitor event
application media event
routing forwarding-status
ip dscp
ip ttl
counter bytes rate
application media bytes rate
transport rtp jitter mean
transport packets lost counter
transport packets expected counter
transport event packet-loss counter
transport packets lost rate
timestamp interval
counter packets dropped
counter bytes
counter packets
application media bytes counter
application media packets counter
Monitor point: _MMON_DYN_-policy-map-70 GigabitEthernet0/3 output
Classification Statistic:
matched packet: 545790
matched byte: 64403220
|
Displaying the Clock Rate for Cisco Performance Monitor Classes
DETAILED STEPS
| Step 1 |
enable
The enable command enters privileged EXEC mode (enter the password if prompted). Example:
Router> enable
Router#
|
| Step 2 |
show
performance
monitor
clock
rate
[policy policy-map-name class class-map-name] If no class name is specified, information for all classes are displayed. Example:
Router# show performance monitor clock rate policy all-apps class telepresence-CS4
Load for five secs: 6%/2%; one minute: 5%; five minutes: 5% Time source is NTP, 17:41:35.508 EST Wed Feb 16 2011
RTP clock rate for Policy: all-apps, Class: telepresence-CS4
Payload type Clock rate(Hz)
pcmu (0 ) 8000
gsm (3 ) 8000
g723 (4 ) 8000
dvi4 (5 ) 8000
dvi4-2 (6 ) 16000
lpc (7 ) 8000
pcma (8 ) 8000
g722 (9 ) 8000
l16-2 (10 ) 44100
l16 (11 ) 44100
qcelp (12 ) 8000
cn (13 ) 8000
mpa (14 ) 90000
g728 (15 ) 8000
dvi4-3 (16 ) 11025
dvi4-4 (17 ) 22050
g729 (18 ) 8000
celb (25 ) 90000
jpeg (26 ) 90000
nv (28 ) 90000
h261 (31 ) 90000
mpv (32 ) 90000
mp2t (33 ) 90000
h263 (34 ) 90000
(96 ) 48000
(112) 90000
default 90000
|
Displaying the Current Status of a Flow Monitor
The interface to which you applied the input flow monitor must be receiving traffic that meets the criteria defined by the original flow record before you can display the flows in the flow monitor cache.
DETAILED STEPS
| Step 1 |
enable
The enable command enters privileged EXEC mode (enter the password if prompted). Example:
Router> enable
Router#
|
| Step 2 |
show
flow
monitor
type
performance-monitor
The show flow monitor type performance-monitorcommand shows the current status of the flow monitor that you specify. Example: Router# show flow mon itor type performance-monitor Flow Monitor type performance-monitor monitor-4: Description: User defined Flow Record: record-4 Flow Exporter: exporter-4 No. of Inactive Users: 0 No. of Active Users: 0 |
Verifying the Flow Monitor Configuration
The interface to which you applied the input flow monitor must be receiving traffic that meets the criteria defined by the original flow record before you can display the flows in the flow monitor cache.
DETAILED STEPS
| Step 1 |
enable
The enable command enters privileged EXEC mode (enter the password if prompted). Example:
Router> enable
Router#
|
| Step 2 |
show
running-config
flow
monitor
The show running-config flow monitor command shows the configuration commands of the flow monitor that you specify. Example:
Router# show running-config flow monitor
Current configuration:
!
flow monitor FLOW-MONITOR-1
description Used for basic IPv4 traffic analysis
record netflow ipv4 original-input
!
!
flow monitor FLOW-MONITOR-2
description Used for basic IPv6 traffic analysis
record netflow ipv6 original-input
!
|
Verifying That Cisco IOS Flexible NetFlow and Cisco Performance Monitor Is Enabled on an Interface
To verify that Flexible NetFlow and Cisco Performance Monitor is enabled on an interface, perform the following optional task.
DETAILED STEPS
| Step 1 |
enable
The enable command enters privileged EXEC mode (enter the password if prompted). Example:
Router> enable
Router#
|
| Step 2 |
show
flow
interface
type
number
The show flow interfacecommand verifies that Flexible NetFlow and Cisco Performance Monitor is enabled on an interface. Example:
Router# show flow interface ethernet 0/0
Interface Ethernet0/0
FNF: monitor: FLOW-MONITOR-1
direction: Input
traffic(ip): on
FNF: monitor: FLOW-MONITOR-2
direction: Input
traffic(ipv6): on
|
Displaying the Flow Monitor Cache
The interface to which you applied the input flow monitor must be receiving traffic that meets the criteria defined by the original flow record before you can display the flow data in the flow monitor cache.
DETAILED STEPS
| Step 1 |
enable
The enable command enters privileged EXEC mode (enter the password if prompted). Example:
Router> enable
Router#
|
| Step 2 |
show
flow
monitor
name
monitor-name
cache
format
record
The show flow monitor name monitor-name cache format record command string displays the status, statistics, and the flow data in the cache for a flow monitor. Example: Router# show flow monitor name FLOW-MONITOR-1 cache format record Cache type: Normal Cache size: 4096 Current entries: 8 High Watermark: 8 Flows added: 24 Flows aged: 16 - Active timeout ( 1800 secs) 0 - Inactive timeout ( 15 secs) 16 - Event aged 0 - Watermark aged 0 - Emergency aged 0 IPV4 SOURCE ADDRESS: 10.251.10.1 IPV4 DESTINATION ADDRESS: 172.16.10.2 TRNS SOURCE PORT: 0 TRNS DESTINATION PORT: 2048 INTERFACE INPUT: Et0/0 FLOW SAMPLER ID: 0 IP TOS: 0x00 IP PROTOCOL: 1 ip source as: 0 ip destination as: 0 ipv4 next hop address: 172.16.7.2 ipv4 source mask: /0 ipv4 destination mask: /24 tcp flags: 0x00 interface output: Et1/0 counter bytes: 733500 counter packets: 489 timestamp first: 720892 timestamp last: 975032 . . . IPV4 SOURCE ADDRESS: 172.16.6.1 IPV4 DESTINATION ADDRESS: 224.0.0.9 TRNS SOURCE PORT: 520 TRNS DESTINATION PORT: 520 INTERFACE INPUT: Et0/0 FLOW SAMPLER ID: 0 IP TOS: 0xC0 IP PROTOCOL: 17 ip source as: 0 ip destination as: 0 ipv4 next hop address: 0.0.0.0 ipv4 source mask: /24 ipv4 destination mask: /0 tcp flags: 0x00 interface output: Null counter bytes: 52 counter packets: 1 timestamp first: 973804 timestamp last: 973804 Router# show flow monitor name FLOW-MONITOR-2 cache format record Cache type: Normal Cache size: 4096 Current entries: 6 High Watermark: 8 Flows added: 1048 Flows aged: 1042 - Active timeout ( 1800 secs) 11 - Inactive timeout ( 15 secs) 1031 - Event aged 0 - Watermark aged 0 - Emergency aged 0 IPV6 FLOW LABEL: 0 IPV6 EXTENSION MAP: 0x00000040 IPV6 SOURCE ADDRESS: 2001:DB8:1:ABCD::1 IPV6 DESTINATION ADDRESS: 2001:DB8:4:ABCD::2 TRNS SOURCE PORT: 3000 TRNS DESTINATION PORT: 55 INTERFACE INPUT: Et0/0 FLOW DIRECTION: Input FLOW SAMPLER ID: 0 IP PROTOCOL: 17 IP TOS: 0x00 ip source as: 0 ip destination as: 0 ipv6 next hop address: :: ipv6 source mask: /48 ipv6 destination mask: /0 tcp flags: 0x00 interface output: Null counter bytes: 521192 counter packets: 9307 timestamp first: 9899684 timestamp last: 11660744 . . . IPV6 FLOW LABEL: 0 IPV6 EXTENSION MAP: 0x00000000 IPV6 SOURCE ADDRESS: FE80::A8AA:BBFF:FEBB:CC03 IPV6 DESTINATION ADDRESS: FF02::9 TRNS SOURCE PORT: 521 TRNS DESTINATION PORT: 521 INTERFACE INPUT: Et0/0 FLOW DIRECTION: Input FLOW SAMPLER ID: 0 IP PROTOCOL: 17 IP TOS: 0xE0 ip source as: 0 ip destination as: 0 ipv6 next hop address: :: ipv6 source mask: /10 ipv6 destination mask: /0 tcp flags: 0x00 interface output: Null counter bytes: 92 counter packets: 1 timestamp first: 11653832 timestamp last: 11653832 |
Displaying the Current Status of a Flow Exporter
DETAILED STEPS
| Step 1 |
enable
The enable command enters privileged EXEC mode (enter the password if prompted). Example:
Router> enable
Router#
|
| Step 2 |
show
flow
exporter
[exporter-name] The show flow exporter command shows the current status of the flow exporter that you specify. Example:
Router# show flow exporter EXPORTER-1
Flow Exporter EXPORTER-1:
Description: Exports to Chicago datacenter
Transport Configuration:
Destination IP address: 172.16.10.2
Source IP address: 172.16.7.1
Transport Protocol: UDP
Destination Port: 65
Source Port: 56041
DSCP: 0x0
TTL: 255
|
Verifying the Flow Exporter Configuration
To verify the configuration commands that you entered to configure the flow exporter, perform the following optional task.
DETAILED STEPS
| Step 1 |
enable
The enable command enters privileged EXEC mode (enter the password if prompted). Example:
Router> enable
Router#
|
| Step 2 |
show
running-config
flow
exporter
exporter-name
The show running-config flow exporter command shows the configuration commands of the flow exporter that you specify. Example:
Router# show running-config flow exporter EXPORTER-1
Building configuration...
!
flow exporter EXPORTER-1
 description Exports to datacenter
 destination 172.16.10.2
 transport udp 65
!
|
Enabling Debugging
To enable debugging for Cisco Performance Monitor, perform the following optional task in privileged EXEC mode.
DETAILED STEPS
|
debug
performance
monitor
{database | dynamic | event | export | flow-monitor | metering | provision | sibling | snmp | tca | timer}
The debug performance monitorcommand enables debugging for the following performance monitor components:
The following example shows how to enable debugging for dynamic monitoring: Example:
Router# debug performance monitor dynamic
|
Configuration Example for Cisco Performance Monitor
Example Monitor for Lost RTP Packets and RTP Jitter
This example show a configuration that monitors the number of lost RTP packets, the amount of RTP jitter, and other basic statistics for the gig1 interface. In this example, Cisco Performance Monitor is also configured to make an entry in the sylog when the any of the following events occur on the interface:
- The percentage of lost RTP packets is between 5 percent and 9 percent.
- The percentage of lost RTP packets is greater than 10 percent.
- A media stop event has occurred.
! Set the filter spec for the flows to monitor.
access-list 101 ip permit host 10.10.2.20 any
! Use the flow record to define the flow keys and metric to collect.
flow record type performance-monitor video-monitor-record
 match ipv4 source
 match ipv4 destination
 match transport source-port
 match transport destination-port
 match rtp ssrc
 collect timestamp
 collect counter byte
 collect counter packet
 collect mse
 collect media-error
 collect counter rtp interval-jitter
 collect counter rtp packet lost
 collect counter rtp lost event
! Set the exporting server. The export message format is based on FNFv.9.
flow export video-nms-server
 export-protocol netflow-v9
 destination cisco-video-management
 transport udp 32001
! Set the flow filter in the class-map.
class-map match-all video-class
 access-group  ipv4 101
! Set the policy map with the type performance-monitor for video monitor.
policy-map type performance-monitor video-monitor
 ! Set the video monitor actions.
 class video-class
  ! Specify where the metric data is being exported to.
  export  flow video-nms-server
  flow monitor inline
   record video-monitor-record
! Set the monitoring modeling parameters.
monitor parameters
 ! Set the measurement timeout to 10 secs.
 interval duration 10
 ! Set the timeout to 10 minutes.
 timeout 10
 ! Specify that 30 flow intervals can be kept in performance database.
 history 30
 priority 7
 ! Set rtp flow verification criteria.
 monitor metric rtp
 ! Configure a RTP flow criteria: at least 10 packets in sequence.
 min-sequential   10
 ! Ignore packets that are more than 5 packet ahead in terms of seq  number.  max-dropout  5
 ! Ignore packets that are more than 5 packets behind in terms of seq  number.
 max-reorder 5
 ! Set the clock rate frequency for rtp packet timestamp clock.
 clock-rate 89000
 ! Set the maximum number of ssrc sllowed within this class.
 ssrc maximum  100
 ! Set TCA for alarm.
 react 100 transport-packets-lost-rate
  description critical  TCA
  ! Set the threshold to greater than 10%.
  threshold gt 10
  ! Set the threshold to the average number based on the last five intervals.
  threshold type average 5
  action  syslog
  alarm severity critical
 react 110 transport-packets-lost-rate
  description medium TCA
  ! Set the threshold to between 5% and 9% of packet lost.
  threshold range gt 5 le 9
  threshold type average 10
  action  syslog
  alarm type grouped percent 30
 react 3000 media-stop
  action syslog
  alarm severity critical
  alarm type grouped percent 30

interface gig1
 service-policy type performance-monitor video-mon in
Where to Go Next
For more information about configuring the products in the Medianet product family, see the other chapter in this guide or see the Cisco Media Monitoring Configuration Guide.
Additional References
Related Documents
|
Related Topic |
Document Title |
|---|---|
|
Design, configuration, and troubleshooting resources for Performance Monitor and other Cisco Medianet products, including a Quick Start Guide and Deployment Guide. |
See the Cisco Medianet Knowledge Base Portal, located at http://www.cisco.com/web/solutions/medianet/knowledgebase/index.html |
|
IP addressing commands: complete command syntax, command mode, command history, defaults, usage guidelines, and examples |
Cisco Media Monitoring Command Reference |
|
Cisco IOS commands |
|
|
Configuration commands for Flexible NetFlow |
Cisco IOS Flexible NetFlow Command Reference |
|
Overview of Flexible NetFlow |
"Cisco IOS Flexible NetFlow Overview" |
|
Flexible NetFlow Feature Roadmap |
"Cisco IOS Flexible NetFlow Features Roadmap" |
|
Configuring flow exporters to export Flexible NetFlow data. |
"Configuring Data Export for Cisco IOS Flexible NetFlow with Flow Exporters" |
|
Customizing Flexible NetFlow |
"Customizing Cisco IOS Flexible NetFlow Flow Records and Flow Monitors" |
|
Configuring flow sampling to reduce the overhead of monitoring traffic with Flexible NetFlow |
"Using Cisco IOS Flexible NetFlow Flow Sampling to Reduce the CPU Overhead of Analyzing Traffic" |
|
Configuring Flexible NetFlow using predefined records |
"Configuring Cisco IOS Flexible NetFlow with Predefined Records" |
|
Using Flexible NetFlow Top N Talkers to analyze network traffic |
"Using Cisco IOS Flexible NetFlow Top N Talkers to Analyze Network Traffic" |
|
Configuring IPv4 multicast statistics support for Flexible NetFlow |
"Configuring IPv4 Multicast Statistics Support for Cisco IOS Flexible NetFlow" |
MIBs
RFCs
Technical Assistance
|
Description |
Link |
|---|---|
|
The Cisco Support and Documentation website provides online resources to download documentation, software, and tools. Use these resources to install and configure the software and to troubleshoot and resolve technical issues with Cisco products and technologies. Access to most tools on the Cisco Support and Documentation website requires a Cisco.com user ID and password. |
Feature Information for Cisco Performance Monitor
The following table provides release information about the feature or features described in this module. This table lists only the software release that introduced support for a given feature in a given software release train. Unless noted otherwise, subsequent releases of that software release train also support that feature.
Use Cisco Feature Navigator to find information about platform support and Cisco software image support. To access Cisco Feature Navigator, go to www.cisco.com/go/cfn. An account on Cisco.com is not required.
| Table 5 | Feature Information for Cisco Performance Monitor |
|
Feature Name |
Releases |
Feature Information |
|---|---|---|
|
Cisco Performance Monitor 1.0 |
15.1(3)T 12.2(58)SE 15.1(4)M1 15.0(1)SY |
This feature enables you to monitor the flow of packets in your network and become aware of any issues that might impact the flow before it starts to significantly impact your applications' performance. The following commands were introduced or modified by this feature: action(policy react and policy inline react), alarm severity (policy react and policy inline react), alarm type(policy react and policy inline react), class-map, clock-rate(policy RTP), collect application media,clear fm performance-monitor counters, collect counter, collect flow direction, collect interface, collect ipv4, collect ipv4 destination, collect ipv4 source, collect ipv4 ttl, collect monitor event, collect routing, collect timestamp interval, collect transport event packet-loss counter, collect transport packets, collect transport rtp jitter,debug fm performance-monitor counters, debug performance-monitor counters, description (Performance Monitor), destination, dscp (Flexible NetFlow), export-protocol, exporter, flow monitor type performance-monitor, flow record type performance-monitor, flows, history (monitor parameters), interval duration, match access-group, match any, match class-map, match cos, match destination-address mac, match discard-class, match dscp, match flow, match fr-de, match fr-dlci, match input-interface, match ip dscp, match ip precedence, match ip rtp, match ipv4, match ipv4 destination, match ipv4 source, match mpls experimental topmost, match not, match packet length (class-map), match precedence, match protocol, match qos-group, match source-address mac, match transport destination-port, match transport rtp ssrc, match transport source-port, match vlan, max-dropout (policy RTP), max-reorder (policy RTP), min-sequential (policy RTP), monitor metric ip-cbr, monitor metric rtp, monitor parameters, option (Flexible NetFlow), output-features,platform performance-monitor rate-limit, policy-map type performance-monitor, rate layer3, react (policy), record (Performance Monitor), rename (policy), service-policy type performance-monitor, show performance monitor history, show performance monitor status,show platform hardware acl entry interface,show platform software ccm,show platform software feature-manager performance-monitor,show platform software feature-manager tcam, show policy-map type performance-monitor, snmp-server host, snmp-server enable traps flowmon, snmp mib flowmon alarm history, source (Flexible NetFlow), ssrc maximum, template data timeout, threshold value (policy react and policy inline react), timeout (monitor parameters), transport (Flexible NetFlow), and ttl (Flexible NetFlow). |
Cisco and the Cisco Logo are trademarks of Cisco Systems, Inc. and/or its affiliates in the U.S. and other countries. A listing of Cisco's trademarks can be found at www.cisco.com/go/trademarks. Third party trademarks mentioned are the property of their respective owners. The use of the word partner does not imply a partnership relationship between Cisco and any other company. (1005R)
Any Internet Protocol (IP) addresses and phone numbers used in this document are not intended to be actual addresses and phone numbers. Any examples, command display output, network topology diagrams, and other figures included in the document are shown for illustrative purposes only. Any use of actual IP addresses or phone numbers in illustrative content is unintentional and coincidental.