The documentation set for this product strives to use bias-free language. For the purposes of this documentation set, bias-free is defined as language that does not imply discrimination based on age, disability, gender, racial identity, ethnic identity, sexual orientation, socioeconomic status, and intersectionality. Exceptions may be present in the documentation due to language that is hardcoded in the user interfaces of the product software, language used based on RFP documentation, or language that is used by a referenced third-party product. Learn more about how Cisco is using Inclusive Language.
You can now upgrade software images on edge devices using the Workflows menu in Cisco vManage.
Schedule the Software Upgrade Workflow
Cisco IOS XE Release 17.9.1a
Cisco vManage Release 20.9.1
Cisco SD-WAN Release 20.9.1
Upgrade the software of Cisco edge devices using a scheduler which helps in scheduling the upgrade process at your convenience.
Software Upgrade Workflow Support for Additional Platforms
Cisco vManage Release 20.9.1
Added support for Cisco Enterprise NFV Infrastructure Software (NFVIS) and Cisco Catalyst Cellular Gateways.
Before You Begin
To check if there is an in-progress software upgrade workflow:
From the Cisco vManage toolbar, click the Task-list icon. Cisco vManage displays a list of all running tasks along with the total number of successes and failures.
Access the Software Upgrade Workflow
In the Cisco vManage menu, click Workflows > Workflow Library.
Note
In the Cisco vManage Release 20.8.1, the Workflow Library is titled Launch Workflows.
Start a new software upgrade workflow: Library > Software Upgrade.
Follow the on-screen instructions to start a new software upgrade workflow.
Note
Click Exit to exit from an in-progress software upgrade workflow. You can resume the in-progress workflow at your convenience.
Note
In a multi-node cluster setup, if the control connection switches to a different node during a device upgrade from Cisco vManage, the upgrade may be impacted due to NetConf session timeout. The device then establishes control connection to a different
node. You need to re-trigger the upgrade activity.
Verify the Status of the Software Upgrade Workflow
To check the software upgrade workflow status:
From the Cisco vManage toolbar, click the Task-list icon.
Cisco vManage displays a list of all running tasks along with the total number of successes and failures.
Click the + icon to view the details of a task.
Cisco vManage opens a pane displaying the status of the task and details of the device on which the task was performed.
ACL Log
Use the ACL Log screen to view logs for access lists (ACLs) configured on a router. Routers collect ACL logs every 10 minutes.
Set ACL Log Filters
From the Cisco vManage menu, choose Monitor > Logs > ACL Log.
Cisco vManage Release 20.6.x and earlier: From the Cisco vManage menu, choose Monitor > ACL Log.
Click the Filter.
In the VPN field, choose the entity, for which you are collecting ACL logs, from the drop-down list. You can choose only one
VPN.
Click Search to search for logs that match the filter criteria.
Cisco vManage displays a log of activities in table format.
Change the Device Rollback Timer
By default, when you attach a Cisco vEdge device to a configuration template, if the router is unable to successfully start after 5 minutes, it returns to, or rolls back
to, the previous configuration. For a configuration that you have created from the CLI, you can change the device's rollback
timer:
From the Cisco vManage menu, choose Configuration > Templates.
Click Device Templates, and choose a device template.
Note
In Cisco vManage Release 20.7.x and earlier releases, Device Templates is titled Device.
Click …, and click Change Device Values.
The right pane displays the device's configuration, and the Config Preview tab is selected.
In the left pane, click the name of a device.
Click Configure Device Rollback Timer. The Configure Device Rollback Time pop up page is displayed.
From the Devices drop-down list, select a device.
To enable the rollback timer, in the Set Rollback slider drag the slider to the left to enable the rollback timer. When you do this, the slider changes in color from gray to green.
To disable the rollback timer, click Enable Rollback slider. When you disable the timer, the Password field dialog box appears. Enter the password that you used to log in to the vManage NMS.
In the Device Rollback Time slider, drag the slider to the desired value. The default time is 5 minutes. You can configure a time from 6 to 15 minutes.
To exclude a device from the rollback timer setting, click Add Exception and select the devices to exclude.
The table of the Configure Device Rollback Time dialog box lists all the devices to which you are attaching the template and their rollback time. To delete a configured
rollback time, click the Trash icon of the device name.
Click Save.
Click Configure Devices to push the configuration to the devices. The Status column displays whether the configuration was successfully pushed. Click (+) to display details of the push operation.
Run Site-to-Site Speed Test
Before You Begin
Ensure that Data Stream is enabled under Administration > Settings in Cisco vManage.
From the Cisco vManage menu, choose Monitor > Devices.
Cisco vManage Release 20.6.x and earlier: From the Cisco vManage menu, choose Monitor > Network.
To choose a device, click the device name in the Hostname column.
Click Troubleshooting in the left pane.
In the Connectivity area, click Speed Test.
Specify the following:
Source Circuit: From the drop-down list, choose the color of the tunnel interface on the local device.
Destination Device: From the drop-down list, choose the remote device by its device name and system IP address.
Destination Circuit: From the drop-down list, choose the color of the tunnel interface on the remote device.
Click Start Test.
The speed test sends a single packet from the source to the destination and receives the acknowledgment from the destination.
The right pane shows the results of the speed test—circuit speed, download speed, and upload speed between the source and
destination. The download speed shows the speed from the destination to the source, and the upload speed shows the speed from
the source to the destination in Mbps. The configured downstream and upstream bandwidths for the circuit are also displayed.
When a speed test completes, the test results are added to the table in the lower part of the right pane.
Cluster Management
Table 2. Feature History
Feature Name
Release Information
Description
Cisco vManage Persona-based Cluster Configuration
Cisco IOS XE Release 17.6.1a
Cisco SD-WAN Release 20.6.1
Cisco vManage Release 20.6.1
You can add Cisco vManage servers to a cluster by identifying servers based on personas. A persona defines what services run on a server.
A Cisco vManage cluster consists of at least three Cisco vManage servers. These servers manage the Cisco SD-WAN edge devices in a network. Cisco vManage servers in a cluster perform specific functions based on the services that are running on them. In this way, a cluster distributes
the workload among Cisco vManage servers while sharing information between these servers. For scaling recommendations, see Server Recommendations for your release in Cisco SD-WAN Controller Compatibility Matrix and Server Recommendations.
Use the Administration > Cluster Management window to create a Cisco vManage cluster and perform related tasks.
From Cisco vManage Release 20.6.1, each Cisco vManage server has a persona. The persona is determined when the Cisco vManageserver first boots up after Cisco vManage is installed and defines which services run on the server. The persona of a server lasts for the lifetime of the server and
cannot be changed. A server must have a persona before it can be added to a cluster. For more information on personas, see
Cisco vManage Persona and Storage Device.
The role that a server has in a cluster depends on its persona. A Cisco vManage server can have any of the following personas:
Compute+Data: Includes all services that are required for Cisco vManage, including services that are used for the application,
statistics, configuration, messaging, and coordination
Compute: Includes services that are used for the application, configuration, messaging, and coordination
Data: Includes services that are used for the application and statistics
Collect Device Statistics
Enable or disable the collection of statistics for devices in the overlay network. By
default, the collection of statistics is enabled for all the devices in the overlay
network.
From the Cisco vManage menu, choose Administration > Settings.
To modify the settings for collecting device statistics, click Statistics Setting, and click Edit.
Tip
To view the configured settings, click View.
By default, for every group of statistics (such as Aggregated
DPI and AppHosting), collection of
statistics is enabled for all devices.
To enable the collection of a group of statistics for all devices, click
Enable All for the particular group.
To disable the collection of a group of statistics for all devices, click
Disable All for the particular group.
To enable the collection of a group of statistics for all devices only for
consumption by Cisco vAnalytics, click vAnalytics
only for the particular group.
To enable or disable the collection of a group of statistics for specific
devices in the overlay network, click Custom for the
particular group.
In the Select Devices dialog box, depending on whether
statistics collection is enabled or disabled for a device, the device is
listed among Enabled Devices or Disabled
Devices respectively.
To enable statistics collection for one or more devices, choose the
devices from Disabled Devices and move them
to Enabled Devices.
Tip
To choose all Disabled Devices, click
Select All.
To disable statistics collection for one or more devices, choose the
devices from Enabled Devices and move them to
Disabled Devices.
Tip
To choose all Enabled Devices, click
Select All.
To save your selections, click Done.
To discard your selections, click Cancel.
To apply the modified settings, click Save.
To discard your changes, click Cancel.
To revert to the default settings, click Restore Factory
Default.
Configure the Time Interval to Collect Device Statistics
From the Cisco vManage menu, choose Administration > Settings.
To modify the time interval at which device statistics are collected, find
Statistics Configuration and click
Edit.
Tip
To view the configured time interval, click
View.
Enter the desired Collection Interval in minutes.
Default value: 30 minutes
Minimum value: 5 minutes
Maximum value: 180 minutes
To apply the modified settings, click Save.
To discard your changes, click Cancel.
To revert to the default settings, click Restore Factory
Default.
Create a Custom Banner
To create a custom banner that is displayed after you log in to the Cisco vManage:
From Banner, click Edit.
In Enable Banner, click Enabled.
In Banner Info, enter the text string for the login banner or click Select a File to download a file that contains the text string.
Click Save.
Create Customized VNF Image
Before you begin
You can upload one or more qcow2 images in addition to a root disk image as an input file along with VM-specific properties,
bootstrap configuration files (if any), and generate a compressed TAR file. Through custom packaging, you can:
Create a custom VM package along with image properties and bootstrap files (if needed) into a TAR archive file.
Tokenize custom variables and apply system variables that are passed with the bootstrap configuration files.
Ensure that the following custom packaging requirements are met:
Root disk image for a VNF–qcow2
Day-0 configuration files–system and tokenized custom variables
VM configuration–CPU, memory, disk, NICs
HA mode–If a VNF supports HA, specify Day-0 primary and secondary files, NICs for a HA link.
Additional Storage–If more storage is required, specify predefined disks (qcow2), storage volumes (NFVIS layer)
Procedure
Step 1
From the Cisco vManage menu, choose Maintenance > Software Repository .
Step 2
Click Virtual Images > Add Custom VNF Package.
Step 3
Configure the VNF with the following VNF package properties and click Save.
Table 3. VNF Package Properties
Field
Mandatory or Optional
Description
Package Name
Mandatory
The filename of the target VNF package. It’s the Cisco NFVIS image name with .tar or .gz extensions.
App Vendor
Mandatory
Cisco VNFs or third-party VNFs.
Name
Mandatory
Name of the VNF image.
Version
Optional
Version number of a program.
Type
Mandatory
Type of VNF to choose.
Supported VNF types are: Router, Firewall, Load Balancer, and Other.
Step 4
To package a VM qcow2 image, click File Upload, and browse to choose a qcow2 image file.
Step 5
To choose a bootstrap configuration file for VNF, if any, click Day 0 Configuration and click File Upload to browse and choose the file.
Include the following Day-0 configuration properties:
Table 4. Day-0 Configuration
Field
Mandatory or Optional
Description
Mount
Mandatory
The path where the bootstrap file gets mounted.
Parseable
Mandatory
A Day-0 configuration file can be parsed or not.
Options are: Enable or Disable. By default, Enable is chosen.
High Availability
Mandatory
High availability for a Day-0 configuration file to choose.
Supported values are: Standalone, HA Primary, HA Secondary.
Note
If any bootstrap configuration is required for a VNF, create a bootstrap-config or a day0-config file.
Step 6
To add a Day-0 configuration, click Add, and then click Save. The Day-0 configuration appears in the Day 0 Config File table. You can tokenize the bootstrap configuration variables with system and custom variables. To tokenize variables of
a Day-0 configuration file, click View Configuration File next to the desired Day-0 configuration file. In the Day 0 configuration file dialog box, perform the following tasks:
Note
The bootstrap configuration file is an XML or a text file, and contains properties specific to a VNF and the environment.
For a shared VNF, see
the topic, Additional References in Cisco SD-WAN Cloud OnRamp for Colocation Solution Guide for the list of system variables that must be added for different VNF types..
To add a system variable, in the CLI configuration dialog box, select, and highlight a property from the text fields. Click System Variable. The Create System Variable dialog box appears.
Choose a system variable from the Variable Name drop-down list, and click Done. The highlighted property is replaced by the system variable name.
To add a custom variable, in the CLI configuration dialog box, choose and highlight a custom variable attribute from the text fields. Click Custom Variable. The Create Custom Variable dialog box appears.
Enter the custom variable name and choose a type from Type drop-down list.
To set the custom variable attribute, do the following:
To ensure that the custom variable is mandatory when creating a service chain, click Type next to Mandatory.
To ensure that a VNF includes both primary and secondary day-0 files, click Type next to Common.
Click Done, and then click Save. The highlighted custom variable attribute is replaced by the custom variable name.
Step 7
To upload extra VM images, expand Advance Options, click Upload Image, and then browse to choose an extra qcow2 image file. Choose the root disk, Ephemeral disk 1, or Ephemeral disk 2, and click
Add. The newly added VM image appears in the Upload Image table.
Note
Ensure that you don’t combine ephemeral disks and storage volumes when uploading extra VM images.
Step 8
To add the storage information, expand Add Storage, and click Add volume. Provide the following storage information and click Add. The added storage details appear in the Add Storage table.
Table 5. Storage Properties
Field
Mandatory or Optional
Description
Size
Mandatory
The disk size that is required for the VM operation. If the size unit is GiB, the maximum disk size can be 256 GiB.
Size Unit
Mandatory
Choose size unit.
The supported units are: MIB, GiB, TiB.
Device Type
Optional
Choose a disk or CD-ROM. By default, disk is chosen.
Location
Optional
The location of the disk or CD-ROM. By default, it’s local.
Format
Optional
Choose a disk image format.
The supported formats are: qcow2, raw, and vmdk. By default, it’s raw.
Bus
Optional
Choose a value from the drop-down list.
The supported values for a bus are: virtio, scsi, and ide. By default, it’s virtio.
Step 9
To add VNF image properties, expand Image Properties and enter the following image information.
Table 6. VNF Image Properties
Field
Mandatory or Optional
Description
SR-IOV Mode
Mandatory
Enable or disable SR-IOV support. By default, it’s enabled.
Monitored
Mandatory
VM health monitoring for those VMs that you can bootstrap.
The options are: enable or disable. By default, it’s enabled.
Bootup Time
Mandatory
The monitoring timeout period for a monitored VM. By default, it’s 600 seconds.
Serial Console
Optional
The serial console that is supported or not.
The options are: enable or disable. By default, it’s disabled.
Privileged Mode
Optional
Allows special features like promiscuous mode and snooping.
The options are: enable or disable. By default, it’s disabled.
Dedicate Cores
Mandatory
Facilitates allocation of a dedicated resource (CPU) to supplement a VM's low latency (for example, router and firewall).
Otherwise, shared resources are used.
The options are: enable or disable. By default, it’s enabled.
Step 10
To add VM resource requirements, expand Resource Requirements and enter the following information.
Table 7. VM Resource Requirements
Field
Mandatory or Optional
Description
Default CPU
Mandatory
The CPUs supported by a VM. The maximum numbers of CPUs supported are 8.
Default RAM
Mandatory
The RAM supported by a VM. The RAM can range 2–32.
Disk Size
Mandatory
The disk size in GB supported by a VM. The disk size can range 4–256.
Max number of VNICs
Optional
The maximum number of VNICs allowed for a VM. The number of VNICs can from range 8–32 and by default, the value is 8.
Management VNIC ID
Mandatory
The management VNIC ID corresponding to the management interface. The valid range is from 0 to maximum number of VNICs.
Number of Management VNICs ID
Mandatory
The number of VNICs.
High Availability VNIC ID
Mandatory
The VNIC IDs where high availability is enabled. The valid range is from 0–maximum number of VNICs. It shouldn’t conflict
with management VNIC Id. By default, the value is 1.
Number of High Availability VNICs ID
Mandatory
The maximum number of VNIC IDs where high availability is enabled. The valid range is 0–(maximum number of VNICs-number of
management VNICs-2) and by default, the value is 1.
Step 11
To add day-0 configuration drive options, expand Day 0 Configuration Drive options and enter the following information.
Table 8. Day-0 Configuration Drive Options
Field
Mandatory or Optional
Description
Volume Label
Mandatory
The volume label of the Day-0 configuration drive.
The options are: V1 or V2. By default, the option is V2. V2 is the config-drive label config-2. V1 is config-drive label cidata.
Init Drive
Optional
The Day-0 configuration file as a disk when mounted. The default drive is CD-ROM.
Init Bus
Optional
Choose an init bus.
The supported values for a bus are: virtio, scsi, and ide. By default, it’s ide.
The Software Repository table displays the customized VNF image, and image is available for choosing when creating a custom
service chain.
Customize the Monitor Overview Dashboard
Table 9. Feature History
Feature Name
Release Information
Description
Customizable Monitor Overview Dashboard in Cisco vManage
Cisco vManage Release 20.9.1
You can customize the Monitor Overview dashboard. You can specify which dashlets to view and sort them based on your personal preferences.
Add a Dashlet
From the Cisco vManage menu, choose Monitor > Overview.
From the Actions drop-down list, choose Edit Dashboard.
Click Add Dashlet.
Note
The Add Dashlet option is available only if additional dashlets are available to be added. It is not available on the default dashboard.
Choose the dashlets that you want to add.
Click Add.
Click Save.
Delete a Dashlet
From the Cisco vManage menu, choose Monitor > Overview.
From the Actions drop-down list, choose Edit Dashboard.
Click the Delete icon adjacent to the corresponding dashlet name.
To confirm the deletion of the dashlet, click Yes.
Click Save.
Rearrange Dashlets
From the Cisco vManage menu, choose Monitor > Overview.
From the Actions drop-down list, choose Edit Dashboard.
Drag and drop the dashlets according to your requirements.
Click Save.
Restore Default Settings
From the Cisco vManage menu, choose Monitor > Overview.
From the Actions drop-down list, choose Reset to Default View.
Click Apply.
Decommission a Cloud Router
Decommissioning a cloud router (such as a vEdge Cloud router
) removes the device's serial number from Cisco vManage and generates a new token for the device. To do so:
From the Cisco vManage menu, choose Configuration > Devices.
Click WAN Edge List, and select a cloud router.
Click …, and click Decommission WAN Edge.
To confirm the decommissioning of the router, click OK.
Delete a Software Image from the Repository
To delete a software image from the Cisco vManage software repository:
Procedure
Step 1
From the Cisco vManage menu, choose Maintenance > Software Repository.
Step 2
For the desired software image, click ... and choose Delete.
If a software image is being downloaded to a router, you cannot delete the image until the download process completes.
Determine the Status of Network Sites
A site is a particular physical location within the Cisco SD-WAN overlay network, such as a branch office, a data center, or a campus. Each site is identified by a unique integer, called
a site ID. Each device at a site is identified by the same site ID.
To determine the status of network sites:
From the Cisco vManage menu, choose Monitor > Overview.
Cisco vManage Release 20.6.x and earlier: From the Cisco vManage menu, choose Dashboard > Main Dashboard.
Locate the Site BFD Connectivity dashlet, which displays the state of data connections of a site. When a site has multiple edge devices, this dashlet displays
the state of the entire site and not for individual devices. The Site BFD Connectivity dashlet displays three states:
Full WAN Connectivity: Total number of sites where all BFD sessions on all devices are in the up state.
Partial WAN Connectivity: Total number of sites where a TLOC or a tunnel is in the down state. These sites still have limited
data plane connectivity.
No WAN Connectivity: Total number of sites where all BFD sessions on all devices are in the down state. These sites have no
data plane connectivity.
Click any of these to view more details. The details are displayed in a pop-up window.
For the desired row, click ... and choose Device Dashboard, SSH Terminal, or Real Time. You will be redirected to the appropriate window based on your selection.
Enable Reverse Proxy
Table 10. Feature History
Feature Name
Release Information
Description
Support for Reverse Proxy with Cisco IOS XE SD-WAN Devices and
Cisco SD-WAN Multitenancy
Cisco IOS XE Release 17.6.1a
Cisco SD-WAN Release 20.6.1
Cisco vManage Release 20.6.1
With this feature, you can deploy a reverse proxy in your overlay network between Cisco IOS XE SD-WAN devices and Cisco vManage and Cisco vSmart Controllers. Also, this feature enables you to deploy a reverse proxy in both single-tenant and multitenant deployments that include
Cisco vEdge devices or Cisco IOS XE SD-WAN devices. In a multitenant deployment, the Service Provider manages reverse proxy and the associated configuration.
In a standard overlay network, Cisco SD-WAN edge devices initiate direct connections
to the Cisco SD-WAN controllers (Cisco vManage and Cisco vSmart Controllers) and
exchange control plane information over these connections. The WAN edge devices are
typically located in branch sites and connect to the Cisco SD-WAN controllers over
the internet. As a result, Cisco vManage and Cisco vSmart Controllers are also
connected directly to the internet.
For security, or other reasons, you may not want the Cisco SD-WAN controllers to have direct internet connections. In such
a scenario, you can deploy a reverse proxy between the Cisco SD-WAN controllers and the WAN edge devices. The reverse proxy
acts as an intermediary to pass control traffic between the Cisco SD-WAN controllers and the WAN edge devices. Instead of
communicating directly with Cisco vManage and the Cisco vSmart Controllers, the WAN edge devices communicate with the reverse
proxy, and the reverse proxy relays the traffic to and from Cisco vManage and Cisco vSmart Controllers.
The following figure illustrates a reverse proxy deployed between a WAN edge device and Cisco vManage and the Cisco vSmart
Controllers.
You can deploy a reverse proxy in both single-tenant and multi-tenant Cisco SD-WAN deployments.
Restrictions for Enabling Reverse Proxy Support
In a multitenant Cisco SD-WAN overlay network, you can deploy a reverse proxy device with only a three-node Cisco vManage cluster. Deployment of the reverse proxy is only supported with a TLS-based control plane for Cisco vManage and Cisco vSmart Controllers.
You cannot deploy a reverse proxy with a Cisco vEdge 5000 router.
You cannot deploy a reverse proxy with IPv6 control connections.
Provision Certificates on the Reverse Proxy
Before exchanging traffic, the reverse proxy and the WAN edge devices must authenticate each other.
On the reverse proxy you must provision a certificate that is signed by the CA that has signed the certificate of the Cisco
SD-WAN controllers. This certificate is used by the reverse proxy to verify the WAN edge devices.
To generate a Certificate Signing Request (CSR) for the reverse proxy and have it signed by Cisco, do as follows:
When prompted, enter values as suggested in the following table:
Property
Description
Country Name (2 letter code)
Any country code.
Example: US
State or Province Name
Any state or province.
Example: CA
Locality Name
Any locality.
Example: San Jose
Organization Name
Use either "vIPtela Inc" or "Viptela LLC".
Example: Viptela LLC
Organizational Unit Name
Use the “organization” name configured on the
overlay.
Example: cisco-sdwan-12345
Common Name
Host name ending with “.viptela.com”.
Example: proxy.viptela.com
Email Address
Use any valid email address.
Example: someone@example.com
Get the CSR signed by Cisco.
If you use Symantec/Digicert as the CA for the Cisco SD-WAN
controllers, open a case with Cisco TAC to sign the CSR.
If you use Cisco Public Key Infrastructure (PKI) as the CA for the
Cisco SD-WAN controllers, submit the CSR on the Cisco Network Plug
and Play (PnP) application and retrieve the signed certificate.
Enable Reverse Proxy
From the Cisco vManage menu, choose Administration > Settings.
For the Reverse Proxy setting, click
Edit.
For Enable Reverse Proxy, click
Enabled.
Click Save.
Configure Reverse Proxy Settings on Cisco SD-WAN Controllers
From the Cisco vManage menu, choose Configure > Devices.
Click Controllers.
For the desired Cisco vManage instance or Cisco vSmart Controller, click … and click Add Reverse Proxy.
The Add Reverse Proxy dialog box appears.
To map a private IP address and port number to a proxy IP address and port
number, do as follows:
Click Add Reverse Proxy.
Enter the following details:
Private IP
The private IP address is the IP address of the
transport interface in VPN 0.
Private Port
This is the port used to establish the
connections that handle control and traffic in the
overlay network. The default port number is
12346.
Proxy IP
Proxy IP address to which private IP address must
be mapped.
Proxy Port
Proxy port to which the private port must be
mapped.
If the Cisco vManage instance or Cisco vSmart Controller has multiple cores, repeat Step 4 a and Step 4 b for each core.
To delete a private IP address-port number to proxy IP address-port number
mapping, find the mapping and click the trash icon.
To save the reverse proxy settings, click Add.
To discard the settings, click Cancel.
In the Security feature template attached to the Cisco vManage instance or Cisco vSmart Controller, choose TLS as the transport protocol.
After you configure reverse proxy settings on a Cisco vManage instance or a Cisco vSmart Controller, WAN edge devices in the overlay network are provisioned with a certificate for authentication with the reverse proxy.
When a reverse proxy is deployed, Cisco vBond Orchestrator shares the details of the reverse proxy with the WAN edge devices.
On learning about the reverse proxy, a WAN edge device initiates the installation of a signed certificate from Cisco vManage.
After the certificate is installed, the WAN edge device uses the certificate for authentication with the reverse proxy and
connects to the reverse proxy.
Disable Reverse Proxy
Note
Before you disable reverse proxy, delete any private IP address-port number to proxy IP address-port number mappings that
you have configured for Cisco vManage instances and Cisco vSmart Controller. See Configure Reverse Proxy Settings on Cisco SD-WAN Controllers for information on deleting the mappings.
From the Cisco vManage menu, choose Administration > Settings.
For the Reverse Proxy setting, click
Edit.
For Enable Reverse Proxy, click
Disabled.
Click Save.
Monitor Private and Proxy IP Addresses of Cisco SD-WAN Controllers and WAN Edge
Devices
From the Cisco vManage menu, choose Monitor > Devices.
Cisco vManage Release 20.6.x and earlier: From the Cisco vManage menu, choose Monitor > Network.
Click on the hostname of a Cisco vManage instance, Cisco vSmart Controller, or a WAN edge device.
In the left pane, click Real Time.
From the Device Options drop-down list, choose
Control Connections.
In the table that appears, the entries in the Private IP and Private Port
columns are the private IP address and port number of the transport
interface in VPN 0. The entries in the Public IP and Public Port columns are
the proxy IP address and port number.
Monitor Reverse Proxy Using CLI
Example: Monitor Private and Proxy IP Address and Port Numbers of WAN Edge Devices on Cisco SD-WAN Controllers
The following is a sample output from the execution of the show control connections command on a Cisco vSmart Controller. In the command output, for a WAN edge device, the entries in the PEER PRIVATE IP and PEER PRIV PORT columns are the configured
TLOC IP address and port number of the WAN edge interface. The entries in the PEER PUBLIC IP and PEER PUB PORT columns are
the corresponding IP address and port number of the reverse proxy interface. The same command can also be executed on a Cisco vManage instance to obtain a similar output.
vsmart1# show control connections
                                                                  PEER                PEER
      PEER    PEER PEER            SITE       DOMAIN PEER         PRIV    PEER        PUB
INDEX TYPE    PROT SYSTEM IP       ID         ID     PRIVATE IP   PORT    PUBLIC IP   PORT    ORGANIZATION   REMOTE COLOR     STATE UPTIME
-------------------------------------------------------------------------------------------------------------------------------------------------
0     vbond   dtls 172.16.1.2         0          0      10.1.1.2     12346   10.1.1.2    12346   EXAMPLE-ORG    default         up     53:08:18:50
0     vmanage tls  172.16.1.6         1          0      10.2.100.6   45689   10.2.100.6  45689   EXAMPLE-ORG    default         up     53:08:18:32
1     vedge   tls  1.1.100.1       100        1      10.3.1.2     57853   10.2.100.1  53624   EXAMPLE-ORG    biz-internet    up     53:08:18:44
1     vedge   tls  1.1.101.1       101        1      10.4.1.2     55411   10.2.100.1  53622   EXAMPLE-ORG    biz-internet    up     53:08:18:48
1     vbond   dtls 172.16.1.2         0          0      10.1.1.2     12346   10.1.1.2    12346   EXAMPLE-ORG    default         up     53:08:18:51

vsmart1#
Example: View Mapping of SD-WAN Controller Private IP Address and Port Number to Proxy IP Address and Port Number on Cisco vBond Orchestrator
The following is a sample output from the execution of the show orchestrator reverse-proxy-mapping command on a Cisco vBond Orchestrator. In the command output, the entries in the PROXY IP and PROXY PORT columns are the proxy IP address and port number. The
entries in the PRIVATE IP and PRIVATE PORT columns are the private IP address and port number of the transport interface in
VPN 0.
Example: View Mapping of SD-WAN Controller Private IP Address and Port Number to Proxy IP Address and Port Number on a WAN
Edge Device
The following is a sample output from the execution of the show sdwan control connections command on a Cisco IOS XE SD-WAN device. In the command output, check the entry in the PROXY column for a Cisco vManage instance or a Cisco vSmart Controller. If the entry is Yes, the entries in the PEER PUBLIC IP and PEER PUBLIC PORT are the proxy IP address and port number.
Device# show sdwan control connections
                                                             PEER              PEER                                  CONTROLLER
PEER    PEER PEER            SITE       DOMAIN PEER          PRIV  PEER        PUB                                   GROUP
TYPE    PROT SYSTEM IP       ID         ID     PRIVATE IP    PORT  PUBLIC IP   PORT  ORGANIZATION    LOCAL COLOR     PROXY STATE UPTIME      ID
--------------------------------------------------------------------------------------------------------------------------------------------------------------------------------------------------------------
vsmart  tls  172.16.1.4         1          1      10.2.100.4    23558 10.2.1.10   23558 EXAMPLE-ORG     biz-internet    Yes   up     52:08:44:25 0
vbond   dtls 0.0.0.0         0          0      10.1.1.2      12346 10.1.1.2    12346 EXAMPLE-ORG     biz-internet    -     up     52:08:50:47 0
vmanage tls  172.16.1.6         1          0      10.2.100.6    23957 10.2.1.10   23957 EXAMPLE-ORG     biz-internet    Yes   up     66:03:04:50 0


Device#
On a Cisco vEdge device, you can obtain a similar output by executing the command show control connections.
Example: View Signed Certificate Installed on a WAN Edge Device for Authentication with Reverse Proxy
The following is a sample output from the execution of the show sdwan certificate reverse-proxy command on a Cisco IOS XE SD-WAN device.
Device# show sdwan certificate reverse-proxy
Reverse proxy certificate
------------------

Certificate:
    Data:
        Version: 1 (0x0)
        Serial Number: 1 (0x1)
        Signature Algorithm: sha256WithRSAEncryption
        Issuer: C = US, CN = 6c63e80a-8175-47de-a455-53a127ee70bd, O = Viptela
        Validity
            Not Before: Jun  2 19:31:08 2021 GMT
            Not After : May 27 19:31:08 2051 GMT
        Subject: C = US, ST = California, CN = C8K-9AE4A5A8-4EB0-E6C1-1761-6E54E4985F78, O = ViptelaClient
        Subject Public Key Info:
            Public Key Algorithm: rsaEncryption
                RSA Public-Key: (2048 bit)
                Modulus:
                    00:e2:45:49:53:3a:56:d4:b8:70:59:90:01:fb:b1:
                    44:e3:73:17:97:a3:e9:b7:55:44:d4:2d:dd:13:4a:
                    a8:ef:78:14:9d:bd:b5:69:de:c9:31:29:bd:8e:57:
                    09:f2:02:f8:3d:1d:1e:cb:a3:2e:94:c7:2e:61:ea:
                    e9:94:3b:28:8d:f7:06:12:56:f3:24:56:8c:4a:e7:
                    01:b1:2b:1b:cd:85:4f:8d:34:78:78:a1:26:17:2b:
                    a5:1b:2a:b6:dd:50:51:f8:2b:13:93:cd:a6:fd:f8:
                    71:95:c4:db:fc:a7:83:05:23:68:61:15:05:cc:aa:
                    60:af:09:ef:3e:ce:70:4d:dd:50:84:3c:9a:57:ce:
                    cb:15:84:3e:cd:b2:b6:30:ab:86:68:17:94:fa:9c:
                    1a:ab:28:96:68:8c:ef:c8:f7:00:8a:7a:01:ca:58:
                    84:b0:87:af:9a:f6:13:0f:aa:42:db:8b:cc:6e:ba:
                    c8:c1:48:d2:f4:d8:08:b1:b5:15:ca:36:80:98:47:
                    32:3a:df:54:35:fe:75:32:23:9f:b5:ed:65:41:99:
                    50:b9:0f:7a:a2:10:59:12:d8:3e:45:78:cb:dc:2a:
                    95:f2:72:02:1a:a6:75:06:87:52:4d:01:17:f2:62:
                    8c:40:ad:29:e4:75:17:04:65:a9:b9:6a:dd:30:95:
                    34:9b
                Exponent: 65537 (0x10001)
    Signature Algorithm: sha256WithRSAEncryption
         99:40:af:23:bb:cf:7d:59:e9:a5:83:78:37:02:76:83:79:02:
         b3:5c:56:e8:c3:aa:fc:78:ef:07:23:f8:14:19:9c:a4:5d:88:
         07:4d:6e:b8:0d:b5:af:fa:5c:f9:55:d0:60:94:d9:24:99:5e:
         33:06:83:03:c3:73:c1:38:48:45:ba:6a:35:e6:e1:51:0e:92:
         c3:a2:4a:a2:e1:2b:da:cd:0c:c3:17:ef:35:52:e1:6a:23:20:
         af:99:95:a2:cb:99:a7:94:03:f3:78:99:bc:76:a3:0f:de:04:
         7d:35:e1:dc:4d:47:79:f4:c8:4c:19:df:80:4c:4f:15:ab:f1:
         61:a2:78:7a:2b:6e:98:f6:7b:8f:d6:55:44:16:79:e3:cd:51:
         0e:27:fc:e6:4c:ff:bb:8f:2d:b0:ee:ed:98:63:e9:c9:cf:5f:
         d7:b1:dd:7b:19:32:22:94:77:d5:bc:51:85:65:f3:e0:93:c7:
         3c:79:fc:34:c7:9f:40:dc:b1:fc:6c:e5:3d:af:2d:77:b7:c3:
         88:b3:89:7c:a6:1f:56:35:3b:35:66:0c:c8:05:b5:28:0b:98:
         19:c7:b0:8e:dc:b7:3f:9d:c1:bb:69:f0:7d:20:95:b5:d1:f0:
         06:35:b7:c4:64:ba:c4:95:31:4a:97:03:0f:04:54:6d:cb:50:
         2f:31:02:59

Device#
On a Cisco vEdge device, you can obtain a similar output by executing the command show certificate reverse-proxy.
Enterprise Certificates
In Cisco IOS XE SD-WAN Release 16.11.1 and Cisco SD-WAN Release 19.1, enterprise certificates were introduced. Enterprise
certificates replace the controller certificates authorization used previously.
Note
When using enterprise certificates for Cisco SD-WAN devices and controllers, make sure to use root certificates with an RSA key that is at least 2048 bit.
Note
For purposes of certificate management, the term controller is used to collectively refer to Cisco vManage, the Cisco vSmart Controller, and the Cisco vBond Orchestrator.
Use the Certificates page to manage certificates and authenticate WAN edge and controller devices in the overlay network.
Two components of the Cisco SD-WAN solution provide device authentication:
Signed certificates are used to authenticate devices in the overlay network. Once authenticated, devices can establish secure
sessions between each other. It is from Cisco vManage that you generate these certificates and install them on the controller devices—Cisco vManage, Cisco vBond Orchestrators, and Cisco vSmart Controllers.
The WAN edge authorized serial number file contains the serial numbers of all valid vEdge and WAN routers in your network.
You receive this file from Cisco SD-WAN, mark each router as valid or invalid, and then from Cisco vManage, send the file to the controller devices in the network.
Install the certificates and the WAN edge authorized serial number file on the controller devices to allow the Cisco SD-WAN overlay network components to validate and authenticate each other and thus to allow the overlay network to become operational.
Generate Admin-Tech Files
Table 11. Feature History
Feature Name
Release Information
Description
Admin-Tech Enhancements
Cisco SD-WAN Release 20.1.1
This feature enhances the admin-tech file to include show tech-support memory, show policy-firewall stats platform, and show sdwan confd-log netconf-trace commands in the admin-tech logs. The admin-tech tar file includes memory, platform, and operation details.
Generate System Status Information for a Cisco vManage Cluster Using Admin Tech
Cisco SD-WAN Release 20.6.1
Cisco vManage Release 20.6.1
You can collect system status information for a Cisco vManage cluster. Prior to this feature, Cisco SD-WAN was only able to generate an admin-tech file for a single device.
View Generated Admin-Tech Files at Any Time
Cisco SD-WAN Release 20.6.1
Cisco vManage Release 20.6.1
You can view a list of generated admin-tech files and determine which files to copy from your device to Cisco vManage. You can then download the selected admin-tech files to your local device, or delete the downloaded admin-tech files from
Cisco vManage, the device, or both.
Additional Diagnostics Information Added to Admin-Tech File
Cisco SD-WAN Release 20.7.1
Cisco vManage Release 20.7.1
You can access additional diagnostics information collected from the application server, the configuration database, the statistics
database, and other internal services.
Upload an Admin-Tech File to a TAC Case
Cisco SD-WAN Release 20.7.1
Cisco vManage Release 20.7.1
You can upload an admin-tech file to a TAC case from Cisco vManage.
Perform the following steps to generate admin-tech file.
From the Cisco vManage menu, choose Tools > Operational Commands.
Click Generate Admin Tech for vManage to generate an admin-tech file for all the nodes in a Cisco vManage cluster.
For a single device, click . . . for the desired device and choose Generate Admin Tech.
In the Generate admin-tech File window, limit the contents of the admin-tech tar file if desired:
The Include Logs check box is checked by default. Uncheck this check box to omit any log files from the compressed tar file.
Note
The log files are stored in the /var/log/directory on the local device.
Check the Include Cores check box to include any core files.
Note
The core files are stored in the /var/crash directory on the local device.
Check the Include Tech check box to include any files related to device processes (daemons), memory details and operations.
Click Generate.
Cisco vManage creates the admin-tech file.
The file name has the format date-time-admin-tech.tar.gz.
Note
Starting from Cisco vManage Release 20.7.1, the admin-tech file includes additional diagnostics information collected from the application server, the configuration
database, the statistics database, and other internal services.
You can perform any of the following operations after the admin-tech file is generated:
View the list of the generated admin-tech files.
Copy the selected admin-tech files from your device to Cisco vManage.
Download the selected admin-tech files to your local device.
Delete the selected admin-tech files from Cisco vManage, the device, or both.
From the Cisco vManage menu, choose Tools > Operational Commands.
For the desired device, click . . . and choose View Admin Tech List.
A tar file appears that contains the admin-tech contents of the device that you selected earlier. This file has a name similar
to ip-address-hostname-20210602-032523-admin-tech.tar.gz, where the numeric fields are the date and the time.
You can view the list of the generated admin-tech files and decide which files that you want to copy to Cisco vManage.
Click the Copy icon to copy the admin-tech file from the device to Cisco vManage.
A hint appears letting you know that the file is being copied from the device to Cisco vManage.
After the file is copied from the device to Cisco vManage, you can click the Download icon to download the file to your local device.
You can view the admin-tech file size after the file is copied to Cisco vManage.
After the admin-tech file is successfully copied to Cisco vManage, you can click the Delete icon and choose which files to delete from Cisco vManage, the device, or both.
From Cisco vManage Release 20.7.1, Cisco IOS XE Release 17.7.1a, and Cisco SD-WAN Release 20.7.1, you can upload an admin-tech file directly from Cisco vManage when opening a TAC case.
Before You Begin
Ensure that you have generated admin-tech files from Cisco vManage.
Upload an Admin-Tech File to a TAC Case
Perform the following steps to upload an admin-tech file to a TAC case:
From the Cisco vManage menu, choose Tools > Operational Commands.
After you generate Admin-Tech files, click Show Admin Tech List.
The List of Admin-techs window is displayed.
From the list of Admin-tech files, select the admin-tech file and click Upload.
In the SR Number and Token fields, enter the details.
Choose the VPN from the VPN options. The options are VPN 0 and VPN 512.
Click Upload.
The selected admin-tech file is uploaded to the relevant service request.
How to Load a Custom vManage Application Server Logo
To change the Cisco vManage web application server logo and load a new custom logo, use the request nms application-server update-logo command.
The logo image is located in the upper left corner of all Cisco vManage web application server screens. You can load two files, a larger version, which is displayed on wider browser screens, and
a smaller version, which is displayed when the screen size narrows. Both files must be PNG files located on the local device,
and both must be 1 MB or smaller in size. For best resolution, it is recommended that the image for the large logo be 180
x 33 pixels, and for the small logo 30 x 33 pixels.
Log In to the Cisco vManage Web Application Server
The Cisco vManage runs as a web application server through which you log in to a running Cisco vManage.
In an overlay network with a single Cisco vManage, to log in to the server, use HTTPS, and specify the IP address of the server. Enter a URL in the format https://ip-address:8443, where 8443 is the port number used by Cisco vManage. On the login page, enter a valid username and password, and then click Log In. You have five chances to enter the correct password. After the fifth incorrect attempt, you are locked out of the device,
and you must wait for 15 minutes before attempting to log in again.
In an overlay network that has a cluster of Cisco vManages, the cluster allows you to log in to one of the Cisco vManages that is operating in the role of a web application server. Use HTTPS, specifying the IP address of one of the Cisco vManages, in the format https://ip-address:8443. The cluster software load-balances login sessions among the individual Cisco vManages that are acting as web application servers. You cannot control which of the individual Cisco vManages you log in to.
With a Cisco vManage cluster, if you enter invalid login credentials, it might take some time for you to see an invalid login error message, and
the amount of time increases as the size of the cluster increases. This delay happens because each Cisco vManage attempts sequentially to validate the credentials. If none of the Cisco vManage servers validate you, only then do you see an invalid login error message.
To determine which Cisco vManage you are logged in to, look in the Cisco vManage toolbar, which is located at the top of the screen. To view more information about this particular Cisco vManage server, enter the name of the server in the Search filter of the Monitor > Devices.
Cisco vManage Release 20.6.x and earlier: To determine which Cisco vManage you are logged in to, look in the Cisco vManage toolbar, which is located at the top of the screen. To view more information about this particular Cisco vManage server, enter the name of the server in the Search filter of the Monitor > Network.
Manage Data Collection for Cisco SD-WAN Telemetry
Table 12. Feature History
Feature Name
Release Information
Description
Manage Data Collection for Cisco SD-WAN Telemetry
Cisco IOS XE Release 17.6.1a
Cisco SD-WAN Release 20.6.1
Cisco vManage Release 20.6.1
This feature allows you to disable data collection for Cisco SD-WAN telemetry using Cisco vManage.
Data collection for telemetry is enabled by default.
From Cisco vManage Release 20.6.1, Cisco vManage has a new option to enable or disable data collection for Cisco SD-WAN telemetry from Administration > Settings > Data Collection. Before this release, the Data Collection section only had the option to enable or disable data collection, and not data collection for Cisco SD-WAN telemetry. The two options are described below:
Data Collection: This option is used to establish a connection to Cisco SD-WAN Data Collection Service (DCS) hosted on the cloud. The connection from Cisco vManage to DCS is used to collect required data from the controllers and the network, for different features such as Cisco vAnalytics
and Cisco SD-WAN telemetry.
SD-WAN Telemetry Data Collection: This option is used to enable or disable telemetry data collection from the controllers and the network. It is enabled by
default when Data Collection is enabled for Cisco SD-WAN. For Cisco-provided cloud-hosted controllers, this option is enabled at the time of provisioning the controllers. For an
on-premises controller, establishing the connection to Cisco SD-WAN Data Collection Service (DCS) through the Data Collection setting is a mandatory prerequisite for enabling Cisco SD-WAN telemetry.
Manage Service Groups
Table 13. Feature History
Feature Name
Release Information
Description
Support for Cisco VM Image Upload in qcow2 Format
Cisco SD-WAN Release 20.7.1
Cisco vManage Release 20.7.1
You can now upload a virtual machine image to Cisco vManage in qcow2 format. Earlier, you could upload only a prepackaged image file in tar.gz format.
Create Service Chain in a Service Group
A service group consists of one or more service chains.
Table 14. Feature History
Feature Name
Release Information
Feature Description
Monitor Service Chain Health
Cisco SD-WAN Release 19.2.1
This feature lets you configure periodic
checks on the service chain data path and reports the overall status. To enable
service chain health monitoring, NFVIS version 3.12.1 or later should be installed
on all CSP devices in a cluster.
Procedure
From the Cisco vManage menu, choose Configuration > Cloud OnRamp for Colocation
Click Service Group and click Create Service Group. Enter the service group name, description, and colocation group.
The service group name can contain 128 alphanumeric characters.
The service group description can contain 2048 alphanumeric characters.
For a multitenant cluster, choose a colocation group or a tenant from the drop-down list. For a single-tenant cluster, the
colocation group admin is chosen by default.
Click Add Service Chain.
In the Add Service Chain dialog box, enter the following information:
Table 15. Add Service Chain Information
Field
Description
Name
The service chain name can contain 128 alphanumeric characters.
Description
The service chain description can contain alphanumeric 2048 characters.
Bandwidth
The service chain bandwidth is in Mbps. The default bandwidth is 10 Mbps and you can configure a maximum bandwidth of 5 Gbps.
Input Handoff VLANS and Output Handoff VLANS
The Input VLAN handoff and output VLAN handoff can be comma-separated values (10, 20), or a range from 10–20.
Monitoring
A toggle button that allows you to enable or disable service chain health monitoring. The service chain health monitoring
is a periodic monitoring service that checks health of a service chain data path and reports the overall service chain health
status. By default, the monitoring service is disabled.
A service chain with subinterfaces such as, SCHM (Service Chain Health Monitoring Service) can only monitor the service chain
including the first VLAN from the subinterface VLAN list.
The service chain monitoring reports status based on end-to-end connectivity. Therefore, ensure that you take care of the
routing and return traffic path, with attention to the Cisco SD-WAN service chains for better results.
Note
Ensure that you provide input and output monitoring IP addresses from input and output handoff subnets. However, if the first
and last VNF devices are VPN terminated, you don't need to provide input and output monitoring IP addresses.
For example, if the network function isn’t VPN terminated, the input monitoring IP can be 192.0.2.1/24 from the inbound subnet,
192.0.2.0/24. The inbound subnet connects to the first network function and the output monitoring IP can be, 203.0.113.11/24
that comes from outbound subnet, 203.0.113.0/24 of the last network function of a service chain.
If the first or last VNF firewall in a service chain is in transparent mode, you can't monitor these service chains.
Service Chain
A topology to choose from the service chain drop-down list. For a service chain topology, you can choose any of the validated
service chains such as, Router - Firewall - Router, Firewall, Firewall - Router. See the Validated Service Chains topic in Cisco SD-WAN Cloud OnRamp Colocation Solution Guide. You can also create a customized service chain. See Create Custom Service Chain.
In the Add Service Chain dialog box, click Add.
Based on the service chain configuration information, a graphical representation of the service group with all the service
chains and the VNFs automatically appear in the design view window. A VNF or PNF appears with a "V" or "P" around the circumference for a virtual a physical network function. It shows all the configured service chains within each service group. A check mark next to the service chain indicates that
the service chain configuration is complete.
After you activate a cluster, attach it with the service group and enable monitoring service for the service chain, when you
bring up the CSP device where CCM is running. Cisco vManage chooses the same CSP device to start the monitoring service. The
monitoring service monitors all service chains periodically in a round robin fashion by setting the monitoring interval to
30 minutes. See Monitor Cloud onRamp Colocation Clusters.
In the design view window, to configure a VNF, click a VNF in the service chain.
The Configure VNF dialog box appears.
Configure the VNF with the following information and perform the actions, as appropriate:
Note
The following fields are available from Cisco vManage Release 20.7.1:
Disk Image/Image Package (Select File)
Disk Image/Image Package (Filter by Tag, Name and Version)
Scaffold File (Select File)
Scaffold File (Filter by Tag, Name and Version)
Table 16. VNF Properties of Router and Firewall
Field
Description
Image Package
Choose a router, firewall package.
Disk Image/Image Package (Select File)
Choose a tar.gz package or a qcow2 image file.
Disk Image/Image Package (Filter by Tag, Name and Version)
(Optional) Filter an image or a package file based on the name, version, and tags that you specified when uploading a VNF
image.
Scaffold File (Select File)
Choose a scaffold file.
Note
This field is mandatory if a qcow2 image file has been chosen. It is optional if a tar.gz package has been chosen.
If you choose both a tar.gz package and a scaffold file, then all image properties and system properties from the scaffold
file override the image properties and system properties, including the Day-0 configuration files, specified in the tar.gz
package.
Scaffold File (Filter by Tag, Name and Version)
(Optional) Filter a scaffold file based on the name, version, and tags that you specified when uploading a VNF image.
Click Fetch VNF Properties. The available information for the image is displayed in the Configure VNF dialog box.
Name
VNF image name
CPU
(Optional) Specifies the number of virtual CPUs that are required for a VNF. The default value is 1 vCPU.
Memory
(Optional) Specifies the maximum primary memory in MB that the VNF can use. The default value is 1024 MB.
Disk
(Optional) Specifies disk in GB required for the VM. The default value is 8 GB.
A dialog box with any custom tokenized variables from Day-0 that requires your input appears. Provide the values.
In the following image, all IP addresses, VLAN, and autonomous system within the green box are system-specific information
that is generated from the VLAN, IP pools provided for the cluster. The information is automatically added into the Day-0
configurations of VMs.
The following images are a sample configuration for VNF IP addresses and autonomous system numbers, in Cisco vManage.
If you're using a multitenant cluster and a comanged scenario, configure the Cisco SD-WAN VM by entering the values for the
following fields and the remaining fields, as required for the service chain design:
Note
To join the tenant overlay network, the provider should provide correct values for the following fields.
Field
Description
Serial Number
The authorized serial number of a Cisco SD-WAN device. The service provider can get the device serial number from the tenant
before creating the service chain.
OTP
The OTP of the Cisco SD-WAN device that is available after authenticating it with Cisco SD-WAN Controllers. The service provider
can get the OTP for the corresponding serial number from the tenant before creating the service chain.
Site Id
The identifier of the site in the tenant Cisco SD-WAN overlay network domain in which the Cisco SD-WAN device resides, such
as a branch, campus, or data center. The service provider can get the site Id from the tenant before creating the service
chain.
Tenant ORG Name
The tenant organization name that is included in the Certificate Signing Request (CSR). The service provider can get the
organization name from the tenant before creating the service chain.
System IP connect to Tenant
The IP address to connect to the tenant overlay network. The service provider can get the IP address from the tenant before
creating the service chain.
Tenant vBond IP
The IP address of the tenant Cisco vBond Orchestrator. The service provider can get the Cisco vBond Orchestrator IP address
from the tenant before creating the service chain.
For edge VMs such as first and last VM in a service chain, you must provide the following addresses as they peer with a branch
router and the provider router.
Table 17. VNF Options for First VM in Service Chain
Field
Mandatory or Optional
Description
Firewall Mode
Mandatory
Choose Routed or Transparent mode.
Note
Firewall mode is applicable to firewall VMs only.
Enable HA
Optional
Enable HA mode for the VNF.
Termination
Mandatory
Choose one of the following modes:
L3 mode selection with subinterfaces that are in trunk mode
<type>selection</type> <val help="L3 Mode With Sub-interfaces(Trunked)" display="VNF-Tagged">vlan</val>
L3 mode with IPSEC termination from a consumer-side and rerouted to the provider gateway
<val help="L3 Mode With IPSEC Termination From Consumer and Routed to Provider GW" display="Tunneled">vpn</val>
L3 mode with access mode (nontrunk mode)
<val help="L3 Mode In Access Mode (Non-Trunked)" display="Hypervisor-Tagged">routed</val>
Click Configure. The service chain is configured with the VNF configuration.
To add another service chain, repeat the procedure from Steps b-g.
Click Save.
The new service group appears in a table under the Service Group. To view the status of the service chains that are monitored, use the Task View window, which displays a list of all running tasks along with the total number of successes and failures. To determine the
service chain health status, use the show system:system status command on the CSP device that has service chain health monotioring enabled.
Create Custom Service Chain
You can customize service chains,
By including extra VNFs or add other VNF types.
By creating new VNF sequence that isn’t part of the predefined service chains.
In the Add Service Chain dialog box, enter the service chain name, description, bandwidth, input VLAN handoff, output VLAN handoff, monitoring health
information of a service chain, and service chain configuration. Click Add.
For the service chain configuration, choose Create Custom from the drop-down. An empty service chain in the design view window is available.
Step 3
To add a VNF such as a router, load balancer, firewall, and others, click a VNF icon and drag the icon to its proper location
within the service group box. After adding all required VNFs and forming the VNF service chain, configure each of the VNFs.
Click a VNF in the service group box. The Configure VNF dialog box appears. Enter the following parameters:
Choose the software image to load from the Disk Image/Image Package (Select File) drop-down list.
Note
You can select a qcow2 image file from Cisco vManage Release 20.7.1.
Choose a scaffold file from the Scaffold File (Select File) drop-down list if you have chosen a qcow2 image file.
Note
This option is available from Cisco vManage Release 20.7.1.
Optionally, filter an image, a package file, or a scaffold file based on the name, version, and tags that you specified when
uploading a VNF image.
Note
This option is available from Cisco vManage Release 20.7.1.
Click Fetch VNF Properties.
In the Name field, enter a name of the VNF.
In the CPU field, enter the number of virtual CPUs required for the VNF.
In the Memory field, enter the amount of memory in megabytes to be allocated for the VNF.
In the Disk field, enter the amount of memory for storage in gigabytes to be allocated for the VNF.
Enter VNF-specific parameters, as required.
Note
These VNF details are the custom variables that are required for Day-0 operations of the VNF.
Click Configure.
To delete the VNF or cancel the VNF configuration, click Delete or Cancel respectively.
The customized service chains are added to a service group.
Note
You can customize a VNF sequence with only up to four VNFs in a service chain.
Manage Software Repository
Table 18. Feature History
Feature Name
Release Information
Description
Software Upgrade Using a Remote Server
Cisco SD-WAN Release 20.7.1
Cisco vManage Release 20.7.1
This feature enables you to register a remote server with Cisco vManage, and add locations of software images on the remote
server to the Cisco vManage software repository. When you upgrade device or controller software, the device or controller
can download the new software image from the remote server.
Register Remote Server
Register a remote server with Cisco vManage so that you can add locations of software images on the remote server to the Cisco
vManage software repository and upgrade device or controller software using these software images. In multitenant Cisco SD-WAN
deployment, only the provider can register a remote server and perform software upgrade using images on the remote server.
From the Cisco vManage menu, choose Maintenance > Software Repository.
Click Add Remote Server.
In the Add Remote Server slide-in page, configure the
following:
Server Info
Server Name: Enter a name for the server.
Server IP or DNS Name: Enter the IP address or the DNS name of the server.
Protocol: Choose HTTP or FTP.
Port: Enter the access port number.
Credentials
User ID: Enter the user ID required to access the server. The username can contain only the following characters: a-z, 0-9, ., _,
and -.
Password: Enter the password required to access the server. The password can contain only the following characters: a-z, A-Z, 0-9,
_, *, ., +, =, %, and -.
Note
Special characters such as /, ?, :, @, and SPACE, which are used in URLs and are needed for proper parsing of fields so files
can be fetched properly with the relevant protocol, are not supported in the username and the password. The use of the valid
characters is supported starting from Cisco vManage Release 20.9.1.
Image Info
Image Location Prefix: Enter
the folder path where the uploaded images must be
stored
VPN: Enter the VPN ID, either
the transport VPN, management VPN, or service
VPN
Click Add to add the remote server.
Manage Remote Server
From the Cisco vManage menu, choose Maintenance > Software Repository.
For the desired remote server, click …
To view the remote server settings, click View
Details.
To edit the remote server settings, click Edit. Edit any
of the following settings as necessary and click
Save.
Note
You cannot edit the remote server settings if you have added locations of any software images on the remote server to the
Cisco vManage software repository. If you wish to edit the remote server settings, remove the software image entries from
the software repository and then edit the settings.
Server Info
Server Name: Enter a name for the server.
Server IP or DNS Name: Enter the IP address or the DNS name of the server.
Protocol: Choose HTTP or FTP.
Port: Enter the access port number.
Credentials
User ID: Enter the user ID required to access the server. The username can contain only the following characters: a-z, 0-9, ., _,
and -.
Password: Enter the password required to access the server. The password can contain only the following characters: a-z, A-Z, 0-9,
_, *, ., +, =, %, and -.
Note
Special characters such as /, ?, :, @, and SPACE, which are used in URLs and are needed for proper parsing of fields so files
can be fetched properly with the relevant protocol, are not supported in the username and the password. The use of the valid
characters is supported starting from Cisco vManage Release 20.9.1.
Image Info
Image Location Prefix: Enter the folder path where the uploaded images must be stored.
VPN: Enter the VPN ID, either the transport VPN, management VPN, or service VPN.
To delete the remote server, click Remove. Confirm that
you wish to remove the remote server in the dialog box.
Note
Before deleting a remote server, remove any entries for software images on
the remote server that you have added to the Cisco vManage software
repository.
Add Software Images to Repository
Before you begin
Before you can upgrade the software on an edge device, Cisco vSmart Controller, or Cisco vManage to a new software version, you need to add the software image to the Cisco vManage software repository. The repository allows you to store software images on the local Cisco vManage server and on a remote file server.
The Cisco vManage software repository allows you to store images in three ways:
On the local Cisco vManage server, to be downloaded over a control plane connection—Here, the software images are stored on the local Cisco vManage server, and they are downloaded to the Cisco SD-WAN devices over a control plane connection. The receiving device generally throttles the amount of data traffic it can receive
over a control plane connection, so for large files, the Cisco vManage server might not be able to monitor the software installation on the device even though it is proceeding correctly.
On the local Cisco vManage server, to be downloaded over an out-of-band connection—Here, the software images are stored on the local Cisco vManage server, and they are downloaded to the Cisco SD-WAN devices over an out-of-band management connection. For this method to work, you specify the IP address of the out-of-band
management interface when you copy the images to the software repository. This method is recommended when the software image
files are large, because it bypasses any throttling that the device might perform and so the Cisco vManage server is able to monitor the software installation.
On a remote server—Here, the software images remain on a remote file server that is reachable through an FTP or HTTP URL.
As part of the software upgrade process, the Cisco vManage server sends this URL to the Cisco SD-WAN device, which then establishes a connection to the file server over which to download the software images.
Procedure
Step 1
From the Cisco vManage menu, choose Maintenance > Software Repository.
Step 2
Click Add New Software.
Step 3
Choose the location to store the software image:
To store the software image or on the local Cisco vManage server and have it be downloaded to Cisco SD-WAN devices over a control plane connection, choose vManage. The Upload Software to vManage dialog box opens.
Drag and drop the software image file to the dialog box, or click Browse to select the software image from a directory on the local Cisco vManage server.
Click Upload to add the image to the software repository.
Note
NFVIS upgrade images require the local Cisco vManage server.
To store the software image on a remote server, choose Remote Server. The Location of Software on Remote Server dialog box opens.
In the Controller Version field, enter the controller version.
In the Version field, enter the version number of the software image.
In the FTP/HTTP URL field, enter the FTP or HTTP URL of the software image.
Click Add to add the image to the software repository.
To store the image on a remote Cisco vManage server and have it be downloaded to Cisco SD-WAN devices over an out-of-band management connection, choose Remote Server - vManage . The Upload Software to Remote Server - vManage dialog box opens.
In the vManage Hostnamr/IP Address field, enter the IP address of an interface on the Cisco vManage server that is in a management VPN (typically, VPN 512).
Drag and drop the software image file to the dialog box, or click Browse to select the software image from a directory on the local Cisco vManage server.
Click Upload.
View Software Images
From the Cisco vManage menu, choose Maintenance > Software Respository.
The Software Repository window displays the images avaialable in the repository.
The Software Version column lists the version of the software image, and the Controller Version column lists the version of controller software that is equivalent to the software version. The controller version is the
minimum supported Cisco controller version. The software image can operate with the listed controller version or with a higher
controller version.
The Software Location column indicates where the software images are stored, either in the repository on the Cisco vManage server, or in a repository
in a remote location.
The Available Files column lists the names of the software image files.
The Updated On column shows when the software image was added to the repository.
The ... option for a desired software version provides the option to delete the software image from the repository.
In Cisco vManage Release 20.6.x and earlier releases, when two or more software images have the same software version but
are uploaded with different filenames, the images are listed in a single row. The Available Files column lists the different filenames. This listing scheme is disadvantageous when deleting software images as the delete
operation removes all the software images corresponding to a software version.
From Cisco vManage Release 20.7.1, when two or more software images have the same software version but are uploaded with
different filenames, each software image is listed in a separate row. This enables you to choose and delete specific software
images.
Upload VNF Images
The VNF images are stored in the Cisco vManage software repository. These VNF images are referenced during service chain deployment, and then they are pushed to Cisco NFVIS
during service chain attachment.
Procedure
Step 1
From the Cisco vManage menu, choose Maintenance > Software Repository.
Step 2
To add a prepackaged VNF image, click Virtual Images, and then click Upload Virtual Image.
Step 3
Choose the location to store the virtual image.
To store the virtual image on the local Cisco vManage server and download it to CSP devices over a control plane connection,
click vManage. The Upload VNF’s Package to vManage dialog box appears.
Drag and drop the virtual image file or the qcow2 image file to the dialog box or click Browse to choose the virtual image from the local Cisco vManage server. For example, CSR.tar.gz, ASAv.tar.gz, or ABC.qcow2
If you upload a file, specify the type of the uploaded file: Image Package or Scaffold. Optionally, specify a description of the file and add custom tags to the file. The tags can be used to filter images and
scaffold files when creating a service chain.
If you upload a qcow2 image file, specify the service or VNF type: FIREWALL or ROUTER. Optionally, specify the following:
Description of the image
Version number of the image
Checksum
Hash algorithm
You can also add custom tags to the file that can be used to filter images and scaffold files when creating a service chain.
Note
It is mandatory to upload a scaffold file if you choose a qcow2 image file.
The option to select a qcow2 image file is available from Cisco vManage Release 20.7.1. In Cisco vManage Release 20.6.1 and earlier releases, you can select only a tar.gz file.
Click Upload to add the image to the virtual image repository. The virtual image repository table displays the added virtual image, and
it available for installing on the CSP devices.
To store the image on a remote Cisco vManage server and then download it to CSP devices, click Remote Server - vManage. The Upload VNF’s Package to Remote Server-vManage dialog box appears.
In the vManage Hostname/IP Address field, enter the IP address of an interface on Cisco vManage server that is in the management VPN (typically, VPN 512).
Drag and drop the virtual image file or the qcow2 image file to the dialog box, or click Browse to choose the virtual image from the local Cisco vManage server.
If you upload a file, specify the type of the uploaded file: Image Package or Scaffold. Optionally, specify a description of the file and add custom tags to the file. The tags can be used to filter images and
scaffold files when creating a service chain.
If you upload a qcow2 image file, specify the service or VNF type: FIREWALL or ROUTER. Optionally, specify the following:
Description of the image
Version number of the image
Checksum
Hash algorithm
You can also add custom tags to the file that can be used to filter images and scaffold files when creating a service chain.
Note
It is mandatory to upload a scaffold file if you choose a qcow2 image file.
The option to select a qcow2 image file is available from Cisco vManage Release 20.7.1. In Cisco vManage Release 20.6.1 and earlier releases, you can select only a tar.gz file.
Click Upload to add the image to the virtual image repository. The virtual image repository table displays the added virtual image, and
it is available for installing on the CSP devices.
You can have multiple VNF entries such as a firewall from same or from different vendors. Also, you can add different versions
of VNF that are based on the release of the same VNF. However, ensure that the VNF name is unique.
View the Status of Network Devices
From the Cisco vManage menu, choose Monitor > Devices.
Cisco vManage Release 20.6.x and earlier: From the Cisco vManage menu, choose Monitor > Network.
Locate the WAN edge router that you want to view the status for. You can either scroll through the list of devices in the
device table or enter a keyword in the search bar.
Click the relevant WAN edge router under the Hostname column. The System Status screen opens by default.
View VNF Images
Procedure
Step 1
From the Cisco vManage menu, choose Maintenance > Software Repository.
Step 2
Click Virtual Images.
Step 3
To filter the search results, use the filter option in the search bar.
The Software Version column provides the version of the software image.
The Software Location column indicates where the software images are stored. Software images can be stored either in the repository
on the Cisco vManage server or in a repository in a remote location.
The Version Type Name column provides the type of firewall.
The Available Files column lists the names of the VNF image files.
The Update On column displays when the software image was added to the repository.
Step 4
For the desired VNF image, click ... and choose Show Info.
Delete VNF Images
Procedure
Step 1
From the Cisco vManage menu, choose Maintenance > Software Repository.
Step 2
Click Virtual Images. The images in the repository are displayed in a table.
Step 3
For the desired image, click ... and choose Delete.
Note
If you're downloading a VNF image to a device, you can’t delete the VNF image until the download process completes.
Note
If the VNF image is referenced by a service chain, it can’t be deleted.
Software Upgrade
Use the Software Upgrade window to download new software images and to upgrade the software image running on a Cisco SD-WAN device.
From a centralized Cisco vManage, you can upgrade the software on Cisco SD-WAN devices in the overlay network and reboot them with the new software. You can do this for a single device or for multiple
devices simultaneously.
When you upgrade a group of Cisco vBond Orchestrator, Cisco vSmart Controllers, and Cisco IOS XE SD-WAN devices or Cisco vEdge devices in either a standalone or Cisco vManage cluster deployment, the software upgrade and reboot is performed first on the Cisco vBond Orchestrator, next on the Cisco vSmart Controller, and finally on the Cisco IOS XE SD-WAN devices or Cisco vEdge devices. Up to 40 Cisco IOS XE SD-WAN devices or Cisco vEdge devices can be upgraded and rebooted in parallel, depending on CPU resources.
Introduced in the Cisco vManage Release 20.8.1, the software upgrade workflow feature simplifies the software upgrade process for the Cisco SD-WAN edge devices through a guided workflow and displays the various device and software upgrade statuses. For more information
on creating a Software Upgrade Workflow, see Software Upgrade Workflow.
Note
You cannot include Cisco vManage in a group software upgrade operation. You must upgrade and reboot the Cisco vManage server by itself.
You can create a software upgrade workflow only for upgrading the Cisco SD-WAN edge devices.
It is recommended that you perform all software upgrades from Cisco vManage rather than from the CLI.
You can now stop, start, or restart
VNFs on Cisco CSP devices from the Colocation
Cluster tab.
You can view the cluster information and their health states. Reviewing this
information can help you to determine which Cisco CSP device is responsible for hosting
each VNF in a service chain. To view information about a cluster, perform the following
steps:
Procedure
Step 1
From the Cisco vManage menu, choose Monitor > Devices.
Cisco vManage Release 20.6.x and earlier: From the Cisco vManage menu, choose Monitor > Network.
Step 2
To monitor clusters, click Colocation Cluster.
Cisco vManage Release 20.6.x and earlier: Click Colocation Clusters.
All clusters with relevant information are displayed in a tabular format. Click a cluster name. You can monitor cluster by
clicking Config. View and Port Level View.
Config. View: The primary part of the window displays the CSP devices and switch devices that form the cluster. In the right pane, you
can view the cluster information such as the available and total CPU resources, available and allocated memory, and so on,
based on colocation size.
The detail part of the window contains:
Search: To filter the search results, use the Filter option in the search bar.
A table that lists information about all devices in a cluster (Cisco CSP devices, PNFs, and switches).
Click a Cisco CSP device. VNF information is displayed in a tabular format. The table includes information such as VNF name,
service chains, number of CPUs, memory consumption, and other core parameters that define performance of a network service
chain.
See View Information About VNFs.
To start, stop, or reboot a VNF, for the desired VNF, click ... and choose one of the following operations:
Start.
Stop.
Restart.
Note
Ensure that service chain provisioning is complete and VMs are deployed, before issuing start, stop, restart operations on
any of the VNFs in the service chain.
After you choose an operation on a VNF, wait until the operation is complete before you issue another operation. You can
view the progress of an operation from the Task View window.
Port Level View: After you activate the cluster, to view the port connectivity details, click Port Level View.
You can view detailed port connectivity information for the switches and CSP devices in a color coded format based on the
SR-IOV and OVS modes.
To view the mapping of ports between the Catalyst 9500 switches and CSP devices, click or hover over a CSP device.
Figure 1. Monitor Port Connectivity Details of a Cluster
Step 3
Click Services.
Here, you can view the following:
Complete information of a service chain. The first two columns display the name and description of the service chain in the
service group and the remaining columns mention about the VNF, PNF statuses, monitoring service enablemement, and the overall health of
a service chain. You can also view the colocation user group associated with a service chain. The various health statuses and their representations are:
Healthy—An up arrow in green. A service chain is in 'Healthy'
status when all the VNF, PNF devices are running and are in
healthy state. Ensure that you configure the routing and
policy correctly.
Unhealthy—A down arrow in red. If one of the VNFs or PNFs are
in unhealthy state, the service chain is reported to be in
'Unhealthy' status. For example, after deploying a service
chain, if one of the network function IP address changes on
the WAN or LAN side, or the firewall policy isn’t configured
to let the traffic pass through, then unhealthy state is
reported. This is because the network function or overall
service chain is Unhealthy or both are in Unhealthy state.
Undetermined—Down arrow in yellow. This state is reported
when the health of the service chain can’t be determined.
This state is also reported when there’s no status such as
healthy or unhealthy available for the monitored service
chain over a time period. You can’t query or search a
service chain with undetermined status.
If a service chain consists of a single PNF and PNF is outside the reachability of Cisco vManage, it can’t be monitored. If
a service chain consists of a single network function, the firewall that has VPN termination on both sides which can’t be
monitored, then it’s reported as Undetermined.
Note
If the status of a service chain is undetermined, you
can’t choose the service chain to view the detailed
monitoring information.
If you had configured a service chain by enabling the monitoring field, then click a service group that is in Healthy or Unhealthy
state. The primary part of the service chain monitoring window contains the following elements:
Graphical display that plots the latency information of the service
chain, VNFs, PNFs.
The detail part of the service chain monitoring window contains:
Search: To filter the search results, use the Filter option in the search bar.
A table that lists information about all service chains,
VNFs, PNFs, their health status, and types.
Check the service chain, VNF, PNF check boxes for the service chains, VNFs, PNFs you want to choose.
To change the sort order of a column, click the
column title.
The status details column indicates the monitored data path and it provides the per hop analysis.
Click Diagram and view the service group with all the service chains and VNFs in the design view window.
Click a VNF. You can view CPU, memory, and disk allocated to the VNF
in a dialog box.
Choose a service group from the Service Groups drop-down. The design view displays the selected service group with all the service chains and VNFs.
Step 4
Click Network Functions.
Here, you can view the following:
All the virtual or physical network functions in a tabular format. Use the Show button, and choose to display either a VNF or PNF.
VNF information is displayed in a tabular format. The table includes
information such as VNF name, service chains, colocation user
groups, CPU use, memory consumption, and other core parameters that
define performance of network service. To view more information
about the VNF, click a VNF name.
See View Information About
VNFs.
PNF information is displayed in tabular format. The table includes information such as the serial number and PNF type. To
view and note configuration of a specific PNF, click the desired PNF serial number. Ensure that you manually note all the
configuration of the PNFs and then configure the PNF devices. For example, the following are some of the PNF configuration
where you position the PNF at various locations in the service chain.
See Cloud OnRamp for Colocation Solution Guide to configure the PNFs manually.
Figure 2. PNF in the First Position with Service Chain Side
Parameters
Figure 3. PNF in the First Position with Outside Neighbor Information
Figure 4. PNF Shared Across Two Service Chains
The ServiceGroup2_chain3 is a PNF-only service chain and
therefore no configuration gets generated. The PNF is in the
last position of the ServiceGroup2_chain1, so only INSIDE
variables gets generated.
Figure 5. PNF Shared Across Two Service Chains with Outside Neighbor
Information
Monitor Network Performance
Use the Network screens to monitor the health of data tunnels and the availability of network devices and circuits.
Screen Elements
Title bar—Includes the title of the screen.
Health—Displays latency, loss, and jitter performance.
Availability—Displays downtime information for the Cisco SD-WAN edge devices and circuits.
Display Network Availability
To display downtime for Cisco SD-WAN edge devices and circuit at each site:
Select an edge device or circuit view to see the respective downtime.
Adjust length of time: Day, Week, Month, or Custom Period.
Select Aggregated Downtime by Sites.
Click on individual data elements to see downtime information for a specific site.
Click a Cisco SD-WAN edge device or circuit to display details about that downtime event.
Display Network Health
Use the Network Health screen to monitor the performance of tunnels over time in your overlay network over time.
The tunnel statistics may be displayed in one of three views: by edge device, by tunnel, or by carrier.
To display performance through Cisco SD-WAN edge device view:
Click vEdge.
Select an individual color to filter the view.
Select a Cisco vEdge device to display latency, loss, and jitter on all the tunnels on that device.
To display graphs for latency, loss, and jitter on each tunnel in your overlay network:
Click Tunnel. Select an individual carrier, color, or both to filter the view.
Hover over a point on a line to open a hover box with details for that point in time.
Click a local Cisco SD-WAN device to display average latency, loss, or jitter on all the tunnels on that device.
Click a remote Cisco SD-WAN device to display latency, loss, or jitter on the tunnels between two Cisco SD-WAN devices.
To display performance by carrier on a geographical map of the overlay network:
Click Carrier. Circles on the map represent each carrier. The legend to the right indicates the color of each carrier.
Select Latency, Loss, or Jitter to change the data displayed.
Click on individual data elements to select specific carriers to view.
Hover over a carrier's circle to display a hover box with details for that location.
Click a circle on the map to display loss, latency, or jitter of all the tunnels terminating on that location.
Click a carrier on the graph to see performance by individual edge devices on that carrier.
Reboot a Device
Use the Device Reboot screen to reboot one or more Cisco SD-WAN devices.
Reboot Devices
From the Cisco vManage menu, choose Maintenance > Device Reboot.
Click WAN Edge, Controller, or vManage depending on the device type that you want to reboot..
Check the check boxes next to the device or devices that you want to reboot.
Click Reboot.
View Active Devices
To view a list of devices on which the reboot operation was performed:
From the Cisco vManage toolbar, click the Tasks icon. Cisco vManage displays a list of all running tasks along with the total number of successes and failures.
Click a row to see details of a task. Cisco vManage opens a pane displaying the status of the task and details of the device on which the task was performed.
Reload a Security Application
The Reload Services option in the Maintenance > Device Reboot window lets you to recover a security application from an inoperative state. Ensure that you use this service as an initial
recovery option. See Determine Security Applications in Inoperative State.
Ensure that a security application has already been installed on the device that you choose to reload services for. To reload
one or more security applications:
From the Cisco vManage menu, choose Maintenance > Device Reboot.
Under WAN Edge, check the check box for the Cisco SD-WAN device you want to choose.
Click Reload Services.
The Reload Container dialog box appears.
If the security application version is correct, check the check box against the version of the security application.
Click Reload.
The security application stops, is uninstalled, reinstalled, and restarted.
Reset a Security Application
The Reset Services option in the Maintenance > Device Reboot window enables you to recover a security application from an inoperative state.
Use the Reset Services option when the virtual network configuration of a security application changes, such as, the virtual port group configuration
on a device.
Ensure that a security application is already been installed on the device that you choose to reset services for.
Ensure that the chosen security application is in a running state.
To reset one or more security applications:
Click WAN Edge and check against a Cisco SD-WAN device to reload the security application.
Click Reset Services.
The Reset Container dialog box opens.
If the security application version is correct, check the check box against the version of the device.
Click Reset.
The security application is stopped, and then restarted.
Determine Security Applications in Inoperative State
From the Cisco vManage menu, choose Monitor > Devices.
Cisco vManage Release 20.6.x and earlier: From the Cisco vManage menu, choose Monitor > Network.
Choose a device by clicking its name in the Hostname column.
In the left pane, click Real Time.
The real time device information appears in the right pane.
From the Device Options drop-down list, choose App Hosting Details.
A table appears with the device-specific application hosting information. In the table, if the state of the device is ACTIVATED,
DEPLOYED, or STOPPED, perform a reload or reset operation on the security application.
If the state of the device is RUNNING, the security application is in an operative state.
From the Device Options drop-down list, choose Security App Dataplane Global.
A table appears with the device-specific application data plane information. In the table, if the SN Health of the device is yellow or red, perform a reload or reset operation on the security application.
If the SN Health of the device is green, the security application is in an operative state.
Rediscover Network
Use the Rediscover Network window to locate new devices in the overlay network and synchronize them with Cisco vManage.
From the Cisco vManage menu, choose Tools > Rediscover Network.
Choose a device or devices by checking the check box next to the device model. To find the device you are looking for scroll
through the device table. Alternatively, choose a device group from the Device Groups drop-down list to see devices that belong to a specific device group.
To confirm resynchronization of the device data, click Rediscover.
In the Rediscover Network dialog box, click Rediscover.
Replace a vEdge Router
This section describes how to replace a vEdge router at a particular location. You might do this when a vEdge router has failed
completely or when a component in a router, such as one of the power supplies, has failed, and you want to replace the entire
router.
At a high level, to replace one vEdge router with another, you simply copy the configuration from the router you are removing
to the new router and then put the new router into the network.
Before you can replace the vEdge router in Cisco vManage, Cisco vManage must have learned the chassis number and serial number of the replacement vEdge router.
If the replacement vEdge router is a router that you have previously received, such as a router that part of your spares inventory,
Cisco vManage will have already learned the router's chassis and serial number when you previously uploaded the serial number file to Cisco vManage.
If you initiated an RMA process and have received a new router as a replacement, you need to upload the updated version of
the authorized vEdge serial number file to Cisco vManage.
To replace a failed router using Cisco vManage, perform the following steps:
Copy the configuration from the failed router to the replacement router.
Invalidate the failed router. Invalidating a router deactivates its certificate and thus removes it from the overlay network.
Validate the replacement router, to activate its certificate.
The new router is a complete replacement for the failed router, its configuration is identical to that of the failed router.
(Remember, though, that each router has a unique chassis number and a unique serial number in its certificate.) After you
copy the configuration from the failed router to the replacement, both routers have the same configurations, including the
same IP address. Two routers with the same IP address cannot be present in the network at the same time, one router must be
in valid state on Cisco vManage and the other must be in invalid state—or both routers must be in invalid state.
Before You Begin
Ensure that you have uploaded the authorized serial number file to Cisco vManage.
Copy the Configuration from the Failed to the Replacement Router
From Cisco vManage, you copy the configuration from the failed vEdge router to the replacement router.
The vEdge router that you are copying the configuration from can be a device that is active in the overlay network (that is,
it is in a valid state) or it can be one that is inactive (that is, it is in invalid state). For example, if you are replacing
a router in which one of the two power supplies has failed, the router might still be active in the network, but if you are
replacing one that has failed completely, you might have already marked it as invalid to remove it from the network.
The vEdge router that you are copying the configuration to must be in invalid state.
To view the state of a vEdge router or to change the validity state, see Validate or Invalidate a vEdge Router.
To copy the configuration from the failed router to the replacement router:
From the Cisco vManage menu, choose Configuration > Devices.
For the failed router, click ... and choose Copy Configuration.
In the Copy Configuration window, choose the replacement router.
Click Update.
Remove the Failed Router
From the Cisco vManage menu, choose Configuration > Certificates.
For the failed router, in the Validate column, click Invalid.
Click OK to confirm invalidation of the device.
Click Send to Controllers.
Add the Replacement Router
From the Cisco vManage menu, choose Configuration > Certificates.
For the replacement router, in the Validate column, click Valid.
Click OK to confirm validation of the device.
Click Send to Controllers.
If you attempt to validate a router that has the same IP address as another router in the network, an error message is displayed,
and the validation process is terminated.
Release Information
Introduced in Cisco vManage in Release 15.4.
Restore Cisco vManage
This article describes how to restore the vManage NMS in case the server on which the vManage NMS virtual machine (VM) is
running fails. This article provides procedures for restoring a vManage NMS using two different VMware interfaces, vSphere
Client and vSphere Web Client.
Caution
When you restore vManage, any vManage certificates are reset to their original state. Any changes to the certificates are
lost as a result of restoring vManage; and you would have to reconfigure any certificates that you had customized earlier.
The vManage NMS database is the repository for the overlay network device configurations, events, alarms, and monitoring information.
The vManage NMS database is stored on a separate virtual hard disk on the vManage NMS server; specifically, it is stored on
hard disk 2. Hard disk 1 contains the Viptela operating system software.
We recommend that you set up periodic crash-consistent backups of the vManage NMS database. (In a crash-consistent backup,
all the VM's data are captured at exactly the same time.) Then, if the vManage NMS server fails, you simply create a new vManage
NMS instance and attach the vManage NMS database backup to that instance.
The procedures in this article each encompass both of the following scenarios:
If you have a backup of the vManage NMS database, you create a new vManage NMS and attach the disk that contains your backup
database.
If you do not have a backup of the vManage database, you create a new vManage NMS and create a new virtual hard disk for the
database.
Restore vManage NMS Using vSphere Client
Create a vManage VM instance. See Launch vSphere Client and Create a vManage VM Instance, in Create a vManage VM Instance
.
In the left navigation bar of the vSphere Client screen, select the vManage VM instance you just created, and click Edit virtual
machine settings.
The vManage - Virtual Machine Properties screen is displayed.
Click Add to add a new virtual disk, and click OK.
The Add Hardware window opens with the Select a Disk screen displayed. If you have a backup of the vManage NMS database, complete
Step 4. If you do not have a backup database, skip to Step 5.
If you have a backup of the vManage NMS database, complete the following steps:
In the Select a disk screen, select Use an existing virtual disk, and click Next.
The Select Existing Disk screen is displayed.
Click Browse.
The Browse Datastores window opens and displays the datastores on the server
Navigate to the location of your backup database, and click OK.
In the Select Existing Disk screen, click Next.
The Advanced Options screen is displayed. Skip Step 5 and proceed to Step 6.
If you do not have an existing vManage NMS database, you must create a new virtual disk for the vManage database:
In the Select a Disk screen, select Create a new virtual disk and click Next.
The Create a Disk screen is displayed.
Enter a disk capacity for the vManage database of 100 GB, and click Next.
The Advanced Options screen is displayed.
In the Advanced Options screen, select IDE for the virtual device node, and click Next.
The Ready to Complete screen is displayed.
Click Finish.
The data volume is added to the vManage NMS.
To verify that the new disk has been created, in the vManage Virtual Machine Properties screen, select the Hardware tab. Hard
disk 2—the virtual disk that stores the vManage database—is shown in the hardware list.
In the left navigation bar of the vSphere Client, select the vManage VM instance you just created, and click Power on the
virtual machine.
The vManage virtual machine is powered on.
Select the Console tab to connect to the vManage console. The vManage console is displayed.
At the vManage login prompt, log in with the default username, which is admin, and the default password, which is admin. The system prompts you to select the storage device to use.
Select the appropriate storage device.
In response to the question
Would you like to format x?
:
If you attached an existing disk with a backup of the vManage database, type n.
If you created a new virtual disk for the vManage database, type y.
Configure the vManage NMS. See vManage NMS Initial Configuration .
Generate a certificate for the new vManage NMS. See Generate vManage Certificate .
Add the serial number of the new vManage NMS to all the vBond orchestrators in the overlay network, as described later in
this article.
Restore vManage NMS Using vSphere Web Client
Create a vManage VM instance. See Launch vSphere Client and Create a vManage VM Instance, in Create a vManage VM Instance
.
Log in to the vSphere Web Client.
Select the VM instance for your vManage NMS.
Click the Manage tab, and click Edit. The Edit Settings screen is displayed with the Virtual Hardware tab selected.
If you have a backup of the vManage NMS database, attach it to the new vManage VM. If you do not have a backup database, skip
to step 6 and create a new virtual disk for the database.
In the New device field at the bottom of the screen, click Select. A pop-up menu opens.
From the pop-up menu, select Existing Hard Disk. The Select File window is displayed.
In the Select File window, under Datastores, navigate to and select the appropriate .vmdk file, and click OK.
If you do not have an existing vManage NMS database, create a new virtual disk for the vManage NMS database:
In the New device field at the bottom of the screen, click Select. A pop-up menu opens.
From the pop-up menu, select New Hard Disk.
In the New Hard Disk field, enter a size for the new virtual disk of 100 GB.
Click OK.
From the New Hard Disk section, under Virtual Device Node, select IDE 1, and click OK.
From the vSphere Web Client Navigator, select the datacenter that is hosting the VM and then select Open Console from the
menu. The vManage console is displayed.
At the vManage login prompt, log in with the default username, which is admin, and the default password, which is admin. The system prompts you to select the storage device to use.
Select the appropriate storage device:
In response to the question
Would you like to format x?
:
If you attached an existing disk with a backup of the vManage database, type n.
If you created a new virtual disk for the vManage database, type yto reformat the disk.
Configure the vManage NMS. See vManage NMS Initial Configuration .
Generate a certificate for the new vManage NMS. See Generate vManage Certificate .
Add the serial number of the new vManage NMS to all the vBond orchestrators in the overlay network, as described below.
Add vManage NMS Serial Number to vBond Orchestrators
When you generate a certificate for a new vManage NMS with a new database, the serial number from the certificate is automatically
sent to the vBond orchestrators. However, when you create a new vManage NMS and attach an existing database, you must manually
send the new serial number to each vBond orchestrator to overwrite the serial number of the previous vManage NMS.
If you have the management IP address for the vBond orchestrator, you can use vManage NMS to send the serial number to each
vBond orchestrator. Otherwise, you must use the CLI.
If you have the management IP address for the vBond orchestrator:
From the Cisco vManage menu, choose Configuration > Devices.
Click Controllers.
Choose the desired Cisco vBond orchestrator.
For the desired Cisco vBond orchestrator, click ... and choose Edit.
Enter the management IP address, username, and password for the vBond orchestrator.
Click Save.
From the Cisco vManage menu, choose Configuration > Certificates.
In the Certificates window, click Controllers.
Click Send to vBond to send the new Cisco vManage certificate to the Cisco vBond orchestrator.
If you do not have the management IP address for the vBond orchestrator:
Find the serial number for the new vManage NMS:
From the Cisco vManage menu, choose Configuration > Certificates.
In the Certificates window, click Controllers.
Choose the Cisco vManage instance and make a note of the serial number that is displayed in the Certificate Serial column.
From the Cisco vManage menu, choose Tools > SSH Terminal.
Choose the desired Cisco vBond orchestrator instance in the left pane, and enter the user name and password to log in to it.
Enter the following command to send the certificate serial number for the new Cisco vManage instance to the Cisco vBond orchestrator,
where number is the serial number that you noted in Step 1:
request vsmart add serial-numnumber
Restrict Network Access for a Device
Table 20. Feature History
Feature Name
Release Information
Description
Geofencing
Cisco vManage Release 20.6.1
If the location of the device goes beyond its geographical boundary, you can restrict network access to the device using Cisco vManage operational commands. For more information, see the Cisco SD-WAN Monitor and Maintain Configuration Guide.
Added Support for Configuring Geofencing Using a Cisco System Feature Template
Cisco vManage Release 20.7.1
You can configure the geographical boundary of a device using a Cisco System feature template.
Added Support for LTE Advanced NIM Modules
Added support for Long-Term Evolution (LTE) Advanced Network Interface Modules (NIMs) for Cisco ISR 4000 routers.
Make Your Device Invalid
You can make your device invalid should your device go beyond its target location.
From the Cisco SD-WAN menu, choose Tools > Operational Commands.
For the desired device, click … and choose Make Device Invalid.
Confirm that you want to make the device invalid and click OK.
Bring Your Device Back to Valid State
From the Cisco SD-WAN menu, choose Configuration > Certificates.
Choose the invalid device and look for the Validate column.
Click Valid.
Click Send to Controllers to complete the action.
Stop Data Traffic
You can stop data traffic to your device should your device exceed its target location.
From the Cisco SD-WAN menu, choose Tools > Operational Commands.
For the desired device, click … and choose Stop Traffic.
Confirm that you want to stop data traffic to your device and click OK.
Run a Traceroute
From the Cisco vManage menu, choose Monitor > Devices.
Cisco vManage Release 20.6.x and earlier: From the Cisco vManage menu, choose Monitor > Network.
To choose a device, click the device name under the Hostname column.
Click Troubleshooting in the left pane.
Under Connectivity, click Trace Route.
Enter the following details:
Destination IP: Enter the IP address of the device on the network.
VPN: From the drop-down list, choose a VPN to use to reach the device.
Source/Interface for VPN: From the drop-down list, choose the interface to use to send the traceroute probe packets.
Click Advanced Options.
In the Size field, enter the size of the traceroute probe packets, in bytes.
Click Start to trigger a traceroute to the requested destination.
The lower part of the right pane displays:
Output—Raw output of the path the traceroute probe packets take to reach the destination.
Graphical depiction of the path the traceroute probe packets take to reach the destination.
If the traceroute is for the service-side traffic, a Cisco vEdge device generates traceroute responses from any of the interfaces on the service VPN.
Security Monitoring
Table 21. Feature History
Feature Name
Release Information
Description
Enhanced Security Monitoring on Cisco SD-WAN Devices
Cisco SD-WAN Release 20.5.1
Cisco vManage Release 20.5.1
You can view traffic, CPU, memory usage, health and reachability of UTD.
View Traffic, CPU, and Memory Usage
From the Cisco vManageMonitor > Devices page, select the device.
Cisco vManage Release 20.6.x and earlier: From the Cisco vManageMonitor > Network page, select the device.
Under Security Monitoring in the left pane, select one of the UTD features Intrusion Prevention, URL Filtering, and so on.
By default, the traffic counter graph is displayed.
You can also customize the time range to see traffic usage for specific time ranges such as Real Time, 1h, 3h or even specify a Custom time range. By default, a time range of 24h is displayed. The time range cannot be more than 365 days.
To view CPU or memory usage, do the following:
To view CPU usage, click UTD Stats: CPU Usage.
To view memory usage, click UTD Stats: Memory Usage.
View the Health and Reachability of UTD
From the Cisco vManageMonitor > Devices page, select the device.
Cisco vManage Release 20.6.x and earlier: From the Cisco vManageMonitor > Network page, select the device.
Under Security Monitoring in the left pane, select one of the UTD features such as Intrusion Prevention, URL Filtering, and so on.
For all features, the health of UTD is displayed as one of the following:
Down: For example: UTD is not configured.
Green: UTD is healthy.
Yellow: For example: High memory usage.
Red: For example: One or more Snort instances are down.
If you configured UTD on the device and the status is not green, contact Cisco TAC for assistance.
Depending on the UTD feature that you choose, the following additional information is displayed:
UTD Feature
Status
Intrusion Prevention
Package Version
IPS Last Updated
Reason for last update status
URL Filtering
Cloud Reachability
Advanced Malware Protection
AMP Cloud Reachability Status
TG Cloud Reachability Status
Umbrella DNS Redirect
Umbrella Registered VPNs
DNSCrypt
SSH Terminal
Use the SSH Terminal screen to establish an SSH session to a router. From an SSH session, you can issue CLI commands on a
router.
Establish an SSH Session to a Device
To establish an SSH session to a device:
From the Cisco vManage menu, choose Tools > SSH Terminal.
Select the device on which you wish to collect statistics:
Select the device group to which the device belongs.
If needed, sort the device list by its status, hostname, system IP, site ID, or device type.
Click the device to select it.
Enter the username and password to log in to the device.
You can now issue CLI commands to monitor or configure the device.
Upgrade Cisco vManage Cluster
Table 22. Feature History
Feature Name
Release Information
Description
Cisco vManage Cluster Upgrade
Cisco SD-WAN Release 20.3.1
Cisco vManage Release 20.3.1
This feature outlines the upgrade procedure for Cisco vManage servers in a cluster to Cisco vManage Release 20.3.1.
To upgrade Cisco vManage nodes in a Cluster, use the Tools > SSH Terminal screen.
This section describes how to upgrade Cisco vManage in a cluster.
You can upgrade directly from Cisco vManage 20.3.1 or later releases to Cisco vManage Release 20.6.1. To upgrade from earlier releases, first upgrade to Cisco vManage 20.4.2 or Cisco vManage Release 20.5.1.
If you are upgrading a Cisco vManage cluster deployment from Cisco vManage Release 20.3.1 or later to Cisco vManage Release 20.5.1 or later, you must do it through the CLI.
Before You Begin
Before you upgrade Cisco vManage nodes to Cisco vManage Release 20.6.1 or later releases, verify the following:
Ensure that the internal user account vmanage-admin is not locked for any server that you are upgrading.
You can check the status of this admin account by pushing a template to the devices that are connected to the server. The
push fails if the account is locked. In such a scenario, you can unlock the account by using the request aaa unlock-user vmanage-admin command.
Ensure that PKI keys have been exchanged between the servers that you are upgrading.
To do so, ensure that the control connections are in the UP state on the servers and restart the application server.
Ensure that the out-of-band IP address of each server is reachable.
Ensure that the Cisco vManage UI is accessible on all servers in the cluster.
Ensure that DCA is running on all nodes in the cluster.
To do so, use the request nms data-collection-agent status command and ensure that the status value shows running for each node.
To start DCA, if needed, use the request nms data-collection-agent start command.
Note
If these prerequisites are not met or if another error occurs during the upgrade, the activation of the image fails and a
file named upgrade-context.json is created in the /opt/data/extra-packages/image-version folder on each node in the cluster. You can provide this file to your Cisco representative for assistance with resolving
the issue.
If you are upgrading to Cisco vManage Release 20.6.1 or later releases from a six-node Cisco vManage cluster deployment in which not all services are running on all nodes, contact your Cisco support representative before performing
the upgrade.
Take snapshots of all the vManage servers. Take a backup of the configuration database and save it in a location outside of
the Cisco vManage server using the following command:
Ensure that Cisco vManage Release 18.3 or later is installed.
For upgrades from Cisco vManage Release 20.3.1 or later, copy the current image to each Cisco vManage server in the cluster and install the image on each Cisco vManage server by using the following command. Do not activate the image at this time.
request software installpath
For upgrades from Cisco vManage Release 20.3.1 or later, activate the current image on each Cisco vManage server using the following command. All servers reboot simultaneously.
request software activateversion
You must upgrade the configuration database when upgrading from one of the following:
Cisco vManage Release 18.4.x or 19.2.x to Cisco vManage 20.3.x or 20.4.x
Cisco vManage Release 20.3.x or 20.4.x to Cisco vManage Release 20.5.x or 20.6.x
Note
Starting from Cisco vManage Release 20.1.1, before upgrading the configuration database, ensure that you verify the database
size. We recommend that the database size is less than or equal to 5 GB. To verify the database size, use the following diagnostic
command:
request nmsconfiguration-db diagnostics
When you upgrade the configuration database, ensure that you have activated the current image on each Cisco vManage server in the cluster as described in the previous step. In addition, ensure that all services except the application server
and configuration-db services are running on these servers by entering the request nms all status command on each server.
To upgrade the configuration database, do the following:
To determine which node to upgrade, enter the request nms configuration-db status command on each node. In the output look for the following:
Enabled: true
Status: not running
Note
After activating a new image on a Cisco vManage host server, the server reboots. After the reboot, for approximately 30 minutes, the output of the request nms configuration-db status command shows Enabled: false even on a node that has the configuration database enabled, while NMS services are being migrated to a containerized form.
On the node to upgrade, as determined in the previous step, enter the following:
request nms configuration-db upgrade
Note
Enter this command on one node only.
Do not enter this command if you are upgrading from Cisco vManage Release 20.5.x to Cisco vManage Release 20.6.1 or later.
Enter your login credentials, if prompted. Login credentials are prompted in releases earlier than Cisco vManage Release 20.3.1 if all the Cisco vManage servers establish control connection with each other. After a successful upgrade, all the configuration database services
are UP across the cluster, and the application server is started.
You can check the database upgrade logs at the following location: vmanage-server:/var/log/nms/neo4j-upgrade.log.
You can perform any of the following operations after the admin-tech file is generated:
View the list of the generated admin-tech files.
Copy the selected admin-tech files from your device to Cisco vManage.
Download the selected admin-tech files to your local device.
Delete the selected admin-tech files from Cisco vManage, the device, or both.
From the Cisco vManage menu, choose Tools > Operational Commands.
For the desired device, click . . . and choose View Admin Tech List.
A tar file appears that contains the admin-tech contents of the device that you selected earlier. This file has a name similar
to ip-address-hostname-20210602-032523-admin-tech.tar.gz, where the numeric fields are the date and the time.
You can view the list of the generated admin-tech files and decide which files that you want to copy to Cisco vManage.
Click the Copy icon to copy the admin-tech file from the device to Cisco vManage.
A hint appears letting you know that the file is being copied from the device to Cisco vManage.
After the file is copied from the device to Cisco vManage, you can click the Download icon to download the file to your local device.
You can view the admin-tech file size after the file is copied to Cisco vManage.
After the admin-tech file is successfully copied to Cisco vManage, you can click the Delete icon and choose which files to delete from Cisco vManage, the device, or both.
From the Cisco vManage menu, choose Monitor > Devices.
Cisco vManage Release 20.6.x and earlier: From the Cisco vManage menu, choose Monitor > Network.
Choose a device by clicking its name in the Hostname column.
Click Interface in the left pane. The right pane displays interface information for the device.
The upper part of the right pane contains:
Chart Options bar—Located directly under the device name, this bar includes:
Chart Options drop-down—Click Chart Options to choose how the data should be displayed.
IPv4 & IPv6 drop-down—Click IPv4 & IPv6 to choose the type of interfaces to view. The information is displayed in graphical format. By default, the graph is Combined,
showing interfaces on which both IPv4 and IPv6 addresses are configured. To view IPv4 and IPv6 interfaces in separate graphs,
select the Separated toggle button.
Time periods—Click either Real Time, a predefined time period, or a custom time period for which to view the data.
Interface information in graphical format.
Interface graph legend—Choose an interface to display information for just that interface.
The lower part of the right pane contains:
Filter criteria.
Interface table, which lists information about all interfaces. By default, the first six interfaces are displayed. The graphical
display in the upper part of the right pane plots information for the selected interfaces.
Check the check box to the left to select and deselect interfaces. You can select and view information for a maximum of 30
interfaces at a time.
To rearrange the columns, drag the column title to the desired position.
For cellular interfaces, click the interface name to view a detailed information about the cellular interface.
You have the following options to view the status of a device in the overlay network.
Use the Dashboard Screen
From the Cisco vManage menu, choose Monitor > Overview.
Cisco vManage Release 20.6.x and earlier: From the Cisco vManage menu, choose Dashboard > Main Dashboard.
For releases before Cisco vManage Release 20.6.1, click the upward or downward arrow next to WAN Edge.
For Cisco vManage Release 20.6.1 and later, click the number representing the number of WAN Edge devices.
To know the status of the WAN edge device, see the Reachability column in the dialog box that opens.
Use the Geography Screen
From the Cisco vManage menu, choose Monitor > Geography.
Click Filter and choose WAN Edge under Types.
Click the router icon to check its status.
Use the Network Screen
From the Cisco vManage menu, choose Monitor > Devices.
Cisco vManage Release 20.6.x and earlier: From the Cisco vManage menu, choose Monitor > Network.
Locate the WAN edge router that you want to view the status for. You can either scroll through the list of devices in the
device table or enter a keyword in the search bar.
Click the relevant WAN edge router under the Hostname column. The System Status screen opens by default.
View the Geographic Location of Your Devices
Use the Geography window in Cisco vManage to view information about the Cisco SD-WAN devices and links in the overlay network. The Geography window provides a map displaying the geographic location of the devices in the overlay network.
Note
The browser on which you are running Cisco vManage must have internet access. If you do not have internet access, ensure that the browser has access to "*.openstreetmaps.org."
To view the geographic location of the devices in the overlay network:
From the VPN Group list, choose a VPN group.
From the VPN Segment list, choose a VPN segment.
Set filters.
Set Map Filters
To select the devices and links you want to display on the map:
From the Cisco vManage menu, choose Monitor > Geography.
Click Filter.
From the options that display, choose the device group. By default, the group All is selected and displays all devices in the overlay network. The group No Groups displays devices that are not part of a device group. If all devices are in a group, the No Groups option is not displayed.
Choose the devices you want to view. By default, the map displays all device types including edge devices, Cisco vBond, Cisco
vSmart, and Cisco vManage.
Choose the state of control and data links. By default, the map displays all control and data connections.
Close the Filter box by moving the cursor outside the box.
The map dynamically updates to display your selections.
View Device Information
To view basic information for a device, hover over the device icon. A pop-up box displays the system IP, hostname, site ID,
device type, and device status.
To view detailed information for a device, double-click the device icon. Click Device Dashboard, Device Details, SSH Terminal, Site Topology, or Links to view more details for the device.
Note the following about links:
A thin blue line displays an active control connection between two devices.
A bold blue line displays multiple active connections between devices.
A dotted red line displays a control connection that is down.
A bold dotted red line displays multiple control connections that are down.
A thin green line displays an active data connection between two devices.
A bold green line displays multiple active data connections.
A dotted red line displays a data connection that is down.
A bold dotted red line displays multiple data connections that are down.
A thick gray line displays an active consolidated control and data connection between two devices.
If you hover over the line, a hover box tells you if the connection is up or down.
Configure and View Geographic Coordinates for a Device
To configure the geographic coordinates for a device, use the System Feature template under Configuration > Templates.
If the Cisco SD-WAN device is not attached to a configuration template, you can configure the latitude and longitude directly on the device:
From the Cisco vManage menu, choose Tools > SSH Terminal.
Choose a device from the left pane. The SSH Terminal window opens in the right pane.
Enter the username and password to log in to the device.
Use the show system status command to determine whether the device is attached to a configuration template:
Device# show system status...
    Personality:            vedge
    Model name:             vedge-cloud
    Services:               None
    vManaged:               false
    Commit pending:         false
    Configuration template: None
In the output, check the values in the vManaged and Configuration template output fields. If the vManaged field is false, the device is not attached to a configuration template, and the Configuration template field value is None. For such a device, you can configure the GPS coordinates directly from the CLI. If the vManaged field is true, the Cisco vManage server has downloaded the device configuration, and the Configuration template field value displays the name of the configuration template. For such a device, you cannot configure the GPS coordinates
directly from the CLI. If you attempt to do so, the validate or commit commands fails with the following message:
Aborted: 'system is-vmanaged': This device is being managed by the vManage. Configuration through the CLI is not allowed.
Enter configuration mode:
For Cisco vEdge devices:
Device# config
Device(config)#
For Cisco IOS XE SD-WAN devices:
Device# configure-transaction
Device(config)#
Configure the latitude and longitude for the device.
Device(config)# system gps-location latitude degrees.minutes.secondsDevice(config-system)# gps-location longitudedegrees.minutes.seconds
In vManage NMS, select the Configuration > Cloud OnRamp for SaaS screen. The Cloud OnRamp for SaaS Dashboard displays the performance of each cloud application in a separate pane.
Each application pane displays the number of Cisco vEdge devices accessing the application and the quality of the connection:
The bottom status bar displays green for devices experiencing good quality.
The middle status bar displays yellow for devices experiencing average quality.
The top status bar displays red for devices experiencing bad quality.
The number to the right of each status bar indicates how many devices are experiencing that quality of connection.
View Application Details
In vManage NMS, choose the Configuration > Cloud OnRamp for SaaS screen. The Cloud OnRamp for SaaS Dashboard displays each cloud application in a separate pane.
Click in an application's pane. vManage NMS displays a list of sites accessing the application.
Click a graph icon in the vQoE Score column to display vQoE history for that site:
Click a predefined or custom time period for which to display data.
Hover over a point on the chart to display vQoE details for that point in time.
View ARP Table Entries
The Address Resolution Protocol (ARP) is used to resolve network layer addresses, such as IPv4 addresses) into link layer
addresses (such as Ethernet, or MAC, addresses). The mappings between network and physical addresses are stored in an ARP
table.
To view the entries in the ARP table:
From the Cisco vManage menu, choose Monitor > Devices.
Cisco vManage Release 20.6.x and earlier: From the Cisco vManage menu, choose Monitor > Network.
Choose a device from the list of devices that displays.
Click Real Time in the left pane.
From the Device Options drop-down list in the right pane, choose ARP.
CLI equivalent: show arp
View BFD Session Information
Bidirectional Forwarding Detection (BFD) sessions between routers start automatically when the devices come up in the network.
BFD which runs on secure IPsec connections between the routers, is used to detect connection failures between the routers.
To view BFD information for a router:
From the Cisco vManage menu, choose Monitor > Devices.
Cisco vManage Release 20.6.x and earlier: From the Cisco vManage menu, choose Monitor > Network.
Choose a device from the list of devices that displays.
Click Real Time in the left pane.
From the Device Options drop-down list, choose one of the following commands as relevant:
BFD Sessions (to view real-time BFD sessions)
BFD History (to view BFD session history)
View BGP Information
You can configure the Border Gateway Protocol (BGP) on routers to enable routing on the service side (site-local side) of
the device, thus providing reachability to networks at the devices' local sites.
To view BGP information on a router:
From the Cisco vManage menu, choose Monitor > Devices.
Cisco vManage Release 20.6.x and earlier: From the Cisco vManage menu, choose Monitor > Network.
Choose a device from the list of devices that displays.
Click Real Time in the left pane.
From the Device Options drop-down list, choose one of the following commands as relevant:
Option
Description
BGP Summary (show bgp summary
View BGP connection status.
BGP Neigbors (show bgp neighbor)
View BGP neighbors.
BGP Routes (show bgp routes)
View routes learned by BGP.
View Device Templates
View a Template
From the Cisco vManage menu, choose Configuration > Templates.
Click Device Templates or Feature Templates, and select a template you wish to view.
Note
In Cisco vManage Release 20.7.x and earlier releases, Device Templates is titled Device, and Feature Templates is titled Feature.
Click …, and then click View.
View Device Templates Attached to a Feature Template
From the Cisco vManage menu, choose Configuration > Templates.
Click Feature Templates, and select a template you wish to view.
Note
In Cisco vManage Release 20.7.x and earlier releases, Feature Templates is titled Feature.
Click …, and click Show Attached Device Templates.
Device Templates dailog box opens, displaying the names of the device templates to which the feature template is attached.
View Devices Attached to a Device Template
For a device template that you created from feature templates:
From the Cisco vManage menu, choose Configuration > Templates.
Click Device Templates, and select a template you wish to view.
Note
In Cisco vManage Release 20.7.x and earlier releases, Device Templates is titled Device.
Click …, and click Attach Devices.
From Attach Devices, click Attached Devices.
For a device template that you created from a CLI template:
From the Cisco vManage menu, choose Configuration > Templates.
Click Device Templates, and select a template you wish to view.
Note
In Cisco vManage Release 20.7.x and earlier releases, Device Templates is titled Device.
Click …, and then click Show Attached Devices.
View and Monitor Cellular Interfaces
This topic describes how to monitor the status of cellular interfaces in Cisco SD-WAN devices.
Monitor Cellular Interfaces
You can verify signal strength and service availability using either Cisco vManage or the LED on the router. You can view the last-seen error message for cellular interfaces from Cisco vManage.
Verify Signal Strength
From the Cisco vManage menu, choose Monitor > Devices.
Cisco vManage Release 20.6.x and earlier: From the Cisco vManage menu, choose Monitor > Network.
From the Device Groups drop-down list, choose a group that the device belongs to.
Choose a device by clicking its name in the Hostname column.
Click Real Time in the left pane.
From the Device Options drop-down list in the right pane, choose Cellular Radio.
To check signal strength and service availability of a cellular connection from the router, look at the WWAN Signal Strength
LED. This LED is typically on the front of the routers, and is labeled with a wireless icon.
The following table explains the LED color and associated status:
Table 23.
Color
Signal Strength
State
Description
Off
—
—
LTE interface disabled (that is, admin status is down) or not configured
Green
Excellent
Solid
LTE interface enabled and in dormant mode (no data being received or transmitted)
Blinking
LTE interface enabled and in active mode (data being received and transmitted)
Yellow
Good
Solid
LTE interface enabled and in dormant mode (no data being received or transmitted)
Blinking
LTE interface enabled and in active mode (data being received and transmitted)
Orange
Poor
Solid
LTE interface enabled and in dormant mode (no data being received or transmitted)
Blinking
LTE interface enabled and in active mode (data are being received and transmitted)
Red
Critical Issue
Solid
LTE interface enabled but faulty; issues include no connectivity with the base transceiver station (BTS) and no signal
View Error Messages for Cellular Interfaces
From the Cisco vManage menu, choose Monitor > Devices.
Cisco vManage Release 20.6.x and earlier: From the Cisco vManage menu, choose Monitor > Network.
Choose a device by clicking its name in the Hostname column.
Click Real Time in the left pane.
From the Device Options drop-down list in the right pane, choose Cellular Status.
The output displayed includes a column for Last Seen Error
CLI equivalent: show cellular status
View a Signed Certificate
Signed certificates are used to authenticate Cisco SD-WAN devices in the overlay network. To view the contents of a signed certificate using Cisco vManage:
From the Cisco vManage menu, choose Configuration > Certificates.
Click Controllers.
For the desired device, click ... and choose View Certificate to view the installed certificate.
View Cisco Umbrella Information
To view Cisco Umbrella information on a device, perform the following steps:
From the Cisco vManage menu, choose Monitor > Devices.
Choose a device from the list of devices that is displayed.
Click Real Time in the left pane.
Click Device Options, and choose the following.
Device Option
Command
Description
Umbrella Device Registration
show umbrella deviceid
Displays Cisco Umbrella registration status for Cisco IOS XE SD-WAN devices.
View Cisco vBond Orchestrator Information
From the Cisco vManage menu, choose Monitor > Devices.
Cisco vManage Release 20.6.x and earlier: From the Cisco vManage menu, choose Monitor > Network.
Choose a device from the list of devices that is displayed.
Click Real Time in the left pane.
From the Device Options drop-down list, choose one of the following commands:
Device Option
CLI Command
Description
Orchestrator Reverse Proxy Mapping
show orchestrator reverse-proxy-mapping
Displays the proxy IP addresses and port numbers that are configured for use by reverse proxy.
Orchestrator Statistics
show orchestrator statistics
Displays statistics about the packets that a Cisco vBond Orchestrator has transmitted and received in the process of establishing and maintaining secure DTLS connections to a Cisco IOS XE SD-WAN devices in the overlay network.
Orchestrator Valid vManage ID
show orchestrator valid-vmanage-id
Lists the chassis numbers of the valid Cisco vManage instance in the overlay network.
View Control Connections
To view all control connections for a device:
From the Cisco vManage menu, choose Monitor > Geography.
Choose a device to view its control connections.
If you select a controller device—a Cisco vBond Orchestrator, Cisco vManage, or a Cisco vSmart Controller, the Control Connections screen opens by default.
If you choose an edge device, the System Status screen displays by default. To view control connections for the device, click
Control Connections in the left pane. The right pane displays information about all control connections that the device has with other controller
devices in the network.
The upper area of the right pane contains the following elements:
Expected and actual number of connections.
Control connection data in graphical format. If the device has multiple interfaces, Cisco vManage displays a graphical topology of all control connections for each color.
The lower area of the right pane contains the following elements:
Search bar—Includes the Search Options drop-down, for a Contains or Match.
Control connections data in tabular format. By default, the first six control connections are selected. The graphical display
in the upper part of the right pane plots information for the selected control connections.
View Data Policies
A centralized data policy is configured and applied on Cisco vSmart controllers, and is then carried in OMP updates to the
edge devices in the site-list that the policy is applied to. Centralized data policy examines fields in the headers of data
packets, looking at the source and destination addresses and ports, and the protocol and DSCP values, and for matching packets,
it modifies the next hop in a variety of ways or applies a policer to the packets. The policy match operation and any resultant
actions are performed on the router as it transmits or receives data traffic.
Localized data policy, also called access lists (ACLs), is configured directly on a local router and affects data traffic
being transmitted between the routers on the Cisco SD-WAN overlay network.
To view ACL information on a router, do the following
From the Cisco vManage menu, choose Monitor > Devices.
Cisco vManage Release 20.6.x and earlier: From the Cisco vManage menu, choose Monitor > Network.
Choose a device from the list of devices that appears.
Click Real Time in the left pane.
Click Device Options, and choose one of the following commands:
Command
Description
show policy access-list-names
View names of configured ACLs
show policy access-list-associations
View Interfaces to which ACLs are applied
show policy access-list-associations
View count of packets affected by ACLs
View Cisco vSmart Controller Policy
To view policy information from Cisco vSmart Controller on a device, perform the following steps:
From the Cisco vManage menu, choose Monitor > Devices.
Cisco vManage Release 20.6.x and earlier: From the Cisco vManage menu, choose Monitor > Network.
Choose a device from the list of devices that appears.
Click Real Time in the left pane.
Click Device Options, and choose one of the following commands:
Device Option
Command
Description
Policy from vSmart
show policy from-vsmart
Displays a centralized data policy, an application-aware policy, or a cflowd policy that a Cisco vSmart Controller has pushed to the Edge devices.
View Policy Zone-Based Firewall
To view policy information about zone-based firewalls on a device, perform the following steps:
From the Cisco vManage menu, choose Monitor > Devices.
Cisco vManage Release 20.6.x and earlier: From the Cisco vManage menu, choose Monitor > Network.
Choose a device from the list of devices that appears.
Click Real Time in the left pane.
Click Device Options, and choose one of the following commands as relevant:
Device Option
CLI Command
Description
Policy Zone Based Firewall Statistics
show policy zbfw filter-statistics
Displays a count of the packets that match a zone-based firewall's match criteria and the number of bytes that match the criteria.
Policy Zone Pair Sessions
show policy zbfw sessions
Displays the session flow information for all zone pairs that are configured with a zone- based firewall policy.
View Devices Connected to Cisco vManage
From the Cisco vManage menu, choose Administration > Cluster Management.
Under Service Configuration, click the hostname of the desired Cisco vManage server. The vManage Details screen appears.
Or alternatively:
Under Service Configuration, for the desired Cisco vManage instance, click ... and choose Device Connected.
View Device Information
You can view basic or detailed information for a device in the overlay network.
To view basic information:
From the Cisco vManage menu, choose Monitor > Geography.
Hover over the device icon.
A pop-up box displays the system IP address, hostname, site ID, device type, and device status. To view more information for
a device, double-click the device icon to open the View More Details pop-up box. Click Device Dashboard, Device Details, SSH Terminal, or Links to get further details for the device.
To view detailed information:
From the Cisco vManage menu, choose Monitor > Devices.
Cisco vManage Release 20.6.x and earlier: From the Cisco vManage menu, choose Monitor > Network.
Locate the WAN edge router to view the status. You can either scroll through the list of devices in the device table or enter
a keyword in the search bar.
Click the relevant device under the Hostname column. The right pane displays System Status by default. To view more detailed information for the device, choose one of
the categories from the left pane.
Note
Starting from Cisco vManage Release 20.9.2, the Monitor > Devices page displays the devices that are newly added or synced to Cisco vManage using the options available on the Configuration > Devices page.
View DHCP Server and Interface Information
When you configure a tunnel interface on a device, a number of services are enabled by default on that interface, including
DHCP. The device can act as a DHCP server for the service-side network to which it is connected, assigning IP addresses to
hosts in the service-side network. It can also act as a DHCP helper, forwarding requests for IP addresses from devices in
the service-side network to a DHCP server that is in a different subnet on the service side of the device.
To view DHCP server and interface information:
From the Cisco vManage menu, choose Monitor > Devices.
Cisco vManage Release 20.6.x and earlier: From the Cisco vManage menu, choose Monitor > Network.
Choose the device by clicking its name in the Hostname column.
Click Real Time in the left pane.
From the Device Options drop-down list in the right pane. choose one of the following to view specific DHCP server and interface information:
Device Option
Command
Description
DHCP Servers
show dhcp server
View information about the DHCP server functionality that is enabled on the device
DHCP Interfaces
show dhcp interface
View information about the interfaces on which DHCP is enabled on an edge device or a Cisco vSmart controller
View SAIE Flows
From the Cisco vManage menu, choose Monitor > Devices.
Cisco vManage Release 20.6.x and earlier: From the Cisco vManage menu, choose Monitor > Network.
Starting from Cisco vManage Release 20.6.1, to view the detailed SD-WAN Application Intelligence Engine (SAIE) flow information such as source IP address, destination
IP address, and port details, you need to add the devices to the on-demand troubleshooting list. Add the device to the on-demand
troubleshooting list from Tools > On Demand Troubleshooting.
Note
In Cisco vManage Release 20.6.x and earlier releases, On Demand Troubleshooting is part of the Monitor menu.
In Cisco vManage Release 20.7.x and earlier releases, the SAIE flow is called the deep packet inspection (DPI) flow.
Ensure that no Cisco or third-party APIs that instruct on-demand troubleshooting to stop are called. These APIs prevent on-demand
troubleshooting from compiling information.
To enhance the application visibility, the data collection process on the device generates aggregated application statistics
usage data, which in turn reduces the size of the statistics data files that are processed by default on the management plane.
This enhancement allows Cisco vManage to collect SAIE data efficiently and reduce the processing time of the management plane.
Under Applications in the left pane, click SAIE Applications. The right pane displays SAIE flow information for the device.
Note
When displaying the SAIE flow usage, peak usage is shown to be higher from one time interval than for another for the same
time period. This situation occurs because the data is not yet available from the statistics database to display in Cisco vManage. Cisco vManage displays only available data and then plots that data in the appropriate axis.
In Cisco vManage Release 20.7.x and earlier releases, SAIE Applications is called DPI Applications.
The upper part of the right pane contains:
Filter option: Click the Filter option to view a drop-down menu to choose the desired VPN and Local TLOC. Click Search. Click a predefined or custom time period for which to view the data.
Note
Filtering Local TLOC : Dia is supported only for Cisco vEdge devices.
SAIE flow information in graphical format.
SAIE flow graph legend—Select an application family to display information for just that flow. Click the Total Network Traffic check box to display flow information as a proportion of total network traffic.
The lower part of the right pane contains:
Filter criteria.
SAIE flow information table that lists all application families sorted by usage. By default, the top six application families
are selected. The graphical display in the upper part of the right pane plots the flow and usage of the selected application
families.
Click the check box on the left to select or deselect application families. You can choose to view information for a maximum
of six application families at one time.
Click an application family to view applications within the family.
Click an application to view the source IP addresses of the devices accessing the application. The Traffic per TLOC pie chart
next to the graph displays traffic distribution per TLOC (color).
To re-arrange the columns, drag the column title to the desired position.
View Interface MTU Information
From the Cisco vManage menu, choose Monitor > Devices.
Cisco vManage Release 20.6.x and earlier: From the Cisco vManage menu, choose Monitor > Network.
Choose a device by clicking its name in the Hostname column.
Click Real Time in the left pane.
From the Device Options drop-down list in the right pane, choose Interface Detail.
View Interfaces in Management VPN or VPN 512
VPN 512 is commonly used for out-of-band management traffic. To display information about the interfaces in VPN 512 on a router:
From the Cisco vManage menu, choose Monitor > Devices.
Cisco vManage Release 20.6.x and earlier: From the Cisco vManage menu, choose Monitor > Network.
Locate the device that you want to view the status for. You can either scroll through the list of devices in the device table
or enter a keyword in the search bar.
Choose the device by clicking its name in the Hostname column.
In the left pane, click Real Time.
From the Device Options drop-down list in the right pane, choose Interface Detail.
In the Select Filter dialog box, click Show Filters if you want to use filters. Otherwise click Do Not Filter.
In the Search bar, enter 512, which is the management VPN.
CLI equivalent: show interface vpn 512.
View License Information
To view license information on a device, perform the following steps:
From the Cisco vManage menu, choose Monitor > Devices.
Cisco vManage Release 20.6.x and earlier: From the Cisco vManage menu, choose Monitor > Network.
Choose a device from the list of devices that is displayed.
Click Real Time in the left pane.
Click Device Options, and choose one of the following commands:
Device Option
Command
Description
Smart License <info>
show licenses
Display the licenses for the software packages used by Cisco SD-WAN.
View Logging Information
To view logging information on a device, perform the following steps:
From the Cisco vManage menu, choose Monitor > Devices.
Cisco vManage Release 20.6.x and earlier: From the Cisco vManage menu, choose Monitor > Network.
Choose a device from the list of devices that is displayed.
Click Real Time in the left pane.
Click Device Options and choose the following command:
Device Option
Command
Description
Logging
show logging
Displays the settings for logging syslog messages.
View Log of Certificate Activities
To view the status of certificate-related activities, use the Cisco vManageConfiguration > Certificates window.
From the Cisco vManage toolbar, click the tasks icon . Cisco vManage displays a list of all running tasks along with the total number of successes and failures.
Click a row to see details of a task. Cisco vManage opens a status window displaying the status of the task and details of the device on which the task was performed.
View Log of Configuration Template Activities
To view a log of activities related to creation of configuration templates and the status of attaching configuration templates
to devices:
From the Cisco vManage menu, choose Configuration > Devices.
Choose WAN Edge List or Controllers, and choose a device.
For the desired device, click ... and choose Template Log.
View Loss Percentage, Latency, Jitter, and Octet Information for Tunnels
View the loss percentage, latency, jitter, and octets for tunnels in a single chart option in Cisco vManage.
Table 24. Feature History
Feature Name
Release Information
Description
View Loss Percentage, Latency, Jitter, and Octet Information for Tunnels
Cisco IOS XE Release 17.5.1a
Cisco SD-WAN Release 20.5.1
Cisco vManage Release 20.5.1
You can view the loss percentage, latency, jitter, and octet information for tunnels in a single chart option in Cisco vManage.
View Loss Percentage, Latency, Jitter, and Octets for Tunnels
You can choose the Real Time option or other time frames to view tunnel information in the graph.
To view loss percentage, latency, jitter, and octets in Cisco vManage:
From the Cisco vManage menu, choose Monitor > Devices.
Cisco vManage Release 20.6.x and earlier: From the Cisco vManage menu, choose Monitor > Network.
Choose a device.
In the left pane, click Tunnel under the WAN area. The right pane displays information about all tunnel connections.
In the right pane, click Chart Options to choose the format in which you want to view the information. Click Loss Percentage/Latency/Jitter/Octets for troubleshooting tunnel information.
The upper part of the right pane contains the following elements:
Data for each tunnel is graphed based on time.
Legend for the graph—Choose a tunnel to view information for just that tunnel. Lines and data points for each tunnel are uniquely
colored.
The lower part of the right pane contains the following elements:
Search bar—Includes the Search Options filter to filter the table based on a Contains or a Match criteria.
Tunnel Table—Lists the jitter, latency, loss percentage, and other data about all the tunnel end points. By default, the first
six tunnels are selected. The graphical display in the upper part of the right pane plots information for the selected tunnels.
Click the column drop-down lists to enable or disable all of the descriptions.
Check the check box to the left to select and deselect tunnels. You can choose and view information for a maximum of six tunnels
at one time.
View Multicast Information
From the Cisco vManage menu, choose Monitor > Devices.
Cisco vManage Release 20.6.x and earlier: From the Cisco vManage menu, choose Monitor > Network.
Choose a device from the list of devices that displays.
Click Real Time in the left pane.
From the Device Options drop-down list, choose one of the following commands as relevant:
Device Option
Command
Description
Multicast Topology
show multicast topology
View topology information about the Multicast Domain
OMP Multicast Advertised Autodiscover or OMP Multicast Received Autodiscover
show omp multicast multicast-auto-discover
View peers that support Multicast
Multicast Tunnels
show multicast tunnel
View information about IPsec tunnels between Multicast peers
Multicast RPF
show multicast rpf
View Multicast reverse-path forwarding information
Multicast Replicator
show multicast replicator
View Multicast replicators
OMP Multicast Advertised Routes or OMP Multicast Received Routes
show omp multicast-routes
View Multicast routes that OMP has learned from PIM join messages
View NMS Server Status
From the Cisco vManage menu, choose Monitor > Devices.
Cisco vManage Release 20.6.x and earlier: From the Cisco vManage menu, choose Monitor > Network.
Choose a Cisco vManage device from the list of devices that is displayed.
Click Real Time in the left pane.
From the Device Options drop-down list, choose NMS Server Running.
Device Option
Command
Description
NMS Server Running
show nms-server running
Displays whether a Cisco vManage NMS server is operational.
This device option is available from Cisco vManage Release 20.6.1.
View Device Configuration
From the Cisco vManage menu, choose Configuration > Devices .
Click WAN Edge List or Controllers.
To view the running configuration, for the desired device, click … and choose Running Configuration.
To view the local configuration, for the desired device, click … and choose Local Configuration.
View Routing Information
From the Cisco vManage menu, choose Monitor > Devices.
Cisco vManage Release 20.6.x and earlier: From the Cisco vManage menu, choose Monitor > Network.
Choose a device from the list of devices that appears.
Click Real Time in the left pane.
Click Device Options, and choose one of the following commands as relevant:
Device Options
Command
Description
IP Routes
show ip routes
show ipv6 routes
Displays information about the IP route table entries.
Displays the IPv6 entries in the local route table.
IP FIB
show ip fib
show ipv6 fib
Displays information about forwarding table entries.
Display the IPv6 entries in the local forwarding table.
IP MFIB Summary
show ip mfib summary
Displays information about a summary of active entries in the multicast FIB.
IP MFIB OIL
show ip mfib oil
Displays information about outgoing Interfaces from the multicast FIB.
IP MFIB Statistics
show ip mfib stats
Displays information about statistics for active entries in the multicast FIB.
OMP Peers
show omp peers
Displays OMP peers and their peering sessions.
OMP Summary
show omp summary
Displays information about the OMP sessions running between Cisco vSmart and the routers.
OMP Received Routes or OMP Advertised Routes
show omp routes
show sdwan omp routes
Displays OMP routes.
Displays the IPv6 entries in the local route table.
OMP Received TLOCs or OMP Advertised TLOCs
show omp tlocs
Displays OMP TLOCs.
OSPF Interfaces
show ospf interface
Displays information about the Interfaces running OSPF.
OSPF Neighbors
show ospf neighbor
Displays information about the OSPF neighbors.
OSPF Routes
show ospf routes
Displays routes learned from OSPF.
OSPF Database Summary
show ospf database-summary
Displays a summary of the OSPF link-state database entries.
OSPF Database
show ospf database
Displays information about the OSPF link-state database entries.
OSPF External Database
Not applicable
Display OSPF external routes. External routes are OSPF routes that are not within the OSPF AS (domain).
OSPF Processes
show ospf process
Display the OSPF processes.
PIM Interfaces
show pim interface
Displays information about interfaces running PIM.
PIM Neighbors
show pim neighbor
Displays information about PIM neighbors.
PIM Statistics
show pim statistics
Displays information about PIM-related statistics.
Interface Detail
show ipv6 interface
Displays information about IPv6 interfaces on Cisco Cisco IOS XE SD-WAN devices.
From Cisco vManage Release 20.6.1, this device option is available on all Cisco IOS XE SD-WAN devices and Cisco vEdge devices.
View Services Running on Cisco vManage
From the Cisco vManage menu, choose Administration > Cluster Management.
Under Service Configuration, click the hostname of the desired Cisco vManage server. The screen displays the process IDs of all the Cisco vManage services
that are enabled on Cisco vManage.
View SFP Information
To view SFP information on a router, perform the following steps:
From the Cisco vManage menu, choose Monitor > Devices.
Cisco vManage Release 20.6.x and earlier: From the Cisco vManage menu, choose Monitor > Network.
Choose a device from the list of devices that is displayed.
Click Real Time in the left pane.
Click Device Options, and choose one of the following commands:
Device Option
Command
Description
SFP Detail
show interface sfp detail
Displays detailed SFP status and digital diagnostic information.
SFP Diagnostic
show interface sfp detail
Displays SFP digital diagnostic information.
SFP Measurement Value
show interface sfp detail
Displays SFP measurement data.
SFP Measurement Alarm
show interface sfp detail
Displays SFP alarm information for the measurements.
View the Software Versions Installed on a Device
From the Cisco vManage menu, choose Monitor > Devices.
Cisco vManage Release 20.6.x and earlier: From the Cisco vManage menu, choose Monitor > Network.
Choose a device by clicking its name in the Hostname column.
Click Real Time in the left pane.
From the Device Options drop-down list in the right pane, choose Software Versions.
View and Open TAC Cases
Table 25. Feature History
Feature Name
Release Information
Description
Access TAC Cases from Cisco vManage
Cisco IOS XE Release 17.9.1a
Cisco vManage Release 20.9.1
Cisco SD-WAN Release 20.9.1
This feature allows you to access Support Case Manager (SCM) wizard using Cisco vManage. You can create, view, or edit the support cases directly from Cisco vManage without having to go to a different Case Manager
portal.
Supported Devices
This feature is supported on both Cisco SD-WAN and Cisco IOS XE SD-WAN devices.
Overview
For any Cisco vManage troubleshooting issues, you raise a support case in the SCM portal. In Cisco vManage, there is a provision
to upload an Admin-Tech File to a specific Service Request (SR) on the SCM server by providing the SR number and the token
details.
Starting from Cisco vManage Release 20.9.1, you can access SCM portal from Cisco vManage. In the SCM portal, you can create, view, or upload an admin-tech file. For
more information on Admin-tech files, see Admin-Tech File.
Prerequisites to Access TAC Cases
Ensure that you have an active Cisco single sign-on (SSO) login to access the SCM Wizard and the cloud server.
View TAC Cases
Perform the following steps to view TAC cases from Cisco vManage.
From the Cisco vManage menu, choose Tools > TAC Cases.
The TAC Support Cases portal displays a list of cases.
Login to the SCM portal using Cisco SSO login.
Open a TAC Case
Perform the following steps to open a TAC Case from Cisco vManage.
From the Cisco vManage menu, choose Tools > TAC Cases.
In the TAC Cases wizard, click Open a Case.
Enter all the relevant details.
Click Create.
The TAC Support Cases portal displays a list of cases.
For more information about using SCM portal, refer Cisco TAC Connect.
View Template Log and Device Bringup
View Log of Template Activities
A log of template activities contains information that relates to creating, editing, and deleting configuration templates,
and the status of attaching configuration templates to devices. This information can be useful for troubleshooting.
To view a log of template activities:
From the Cisco vManage menu, choose Configuration > Devices.
Click WAN Edge List or Controllers, and select the device.
Click …, and click Template Log.
View Status of Device Bringup
You can view the status of the operations involved in bringing a router or controller up in the overlay network. This information
can help you monitor these operations.
To view the status of a device bringup:
From the Cisco vManage menu, choose Configuration > Devices.
Click WAN Edge List or Controllers, and select the device.
Click …, and click Device Bring Up.
View the Status of a Cisco vBond Orchestrator
You have the following options to view the status of a Cisco vBond Orchestrator.
Use the Dashboard Screen
From the Cisco vManage menu, choose Monitor > Overview.
Cisco vManage Release 20.6.x and earlier: From the Cisco vManage menu, choose Dashboard > Main Dashboard.
For releases before Cisco vManage Release 20.6.1, click the upward or downward arrow next to Cisco vBond.
For Cisco vManage Release 20.6.1 and later, click the number representing the number of Cisco vBond orchestrators in your overlay network.
To know the status of the Cisco vBond Orchestrator, see the Reachability column in the dialog box that opens.
Use the Geography Screen
From the Cisco vManage menu, choose Monitor > Geography.
Click Filter and choose vBond under Types.
Click the Cisco vBond icon to check its status.
Use the Network Screen
From the Cisco vManage menu, choose Monitor > Devices.
Cisco vManage Release 20.6.x and earlier: From the Cisco vManage menu, choose Monitor > Network.
Locate the Cisco vBond Orchestrator that you want to view the status for. You can either scroll through the list of devices in the device table or enter vBond as the keyword in the search bar.
Click the relevant Cisco vBond Orchestrator under the Hostname column. The Control Connections screen opens by default and displays information about all control connections that the device has with other controller
devices in the network.
View Device Status in the Overlay Network
You have the following options to view the status of a device in the overlay network.
Use the Dashboard Screen
From the Cisco vManage menu, choose Monitor > Overview.
Cisco vManage Release 20.6.x and earlier: From the Cisco vManage menu, choose Dashboard > Main Dashboard.
For releases before Cisco vManage Release 20.6.1, click the upward or downward arrow next to WAN Edge.
For Cisco vManage Release 20.6.1 and later, click the number representing the number of WAN Edge devices.
To know the status of the WAN edge device, see the Reachability column in the dialog box that opens.
Use the Geography Screen
From the Cisco vManage menu, choose Monitor > Geography.
Click Filter and choose WAN Edge under Types.
Click the router icon to check its status.
Use the Network Screen
From the Cisco vManage menu, choose Monitor > Devices.
Cisco vManage Release 20.6.x and earlier: From the Cisco vManage menu, choose Monitor > Network.
Locate the WAN edge router that you want to view the status for. You can either scroll through the list of devices in the
device table or enter a keyword in the search bar.
Click the relevant WAN edge router under the Hostname column. The System Status screen opens by default.
View Top Applications Pane
The Top Applications pane in the Cisco vManageMonitor > Overview page displays the SD-WAN Application Intelligence Engine (SAIE) flow information for traffic transiting WAN Edge routers
in the overlay network.
Note
In Cisco vManage Release 20.7.x and earlier releases, the SAIE flow is called the deep packet inspection (DPI) flow.
To list top applications by VPN, select a VPN from the drop-down list. To select a time period for which to display data,
click the Time drop-down list.
To list top applications in a sidebar:
Click View Details to open the Top Applications sidebar. It displays a more detailed view of the same information.
In SAIE Application, from the VPN drop-down list, select the desired VPN, and then click Search.
Note
In Cisco vManage Release 20.7.x and earlier releases, SAIE Application is called DPI Application.
Click Chart to list the applications.
Click Details to display more information about the applications.
Click SSL Proxy, from the View by Policy Actions drop-down list, select the policy action. All Policy Action, Encrypted, Un-Encrypted, Decrypted view are supported. From
the VPN drop-down list, select the desired VPN, and then click Search. The Hour option displays statistics for the selected hour duration.
Click Chart to list the SSL applications.
Click Details to display more information about the SSL applications.
Click X to close the window and return to the Monitor > Overview page.
Note
In Cisco vManage Release 20.6.x and earlier releases, Cisco vManage has the following behavior:
The Top Applications pane is part of the Dashboard > Main Dashboard page.
A filter icon instead of a drop-down list lists the VPN options and indicates the time period for which to display data.
An expand icon instead of the View Details button opens the Top Applications pop-up window.
Note
Flow DPI data is collected by Cisco vManage on schedule, but processed on user requests. Flow DPI based reports are available
after data is processed.
View the Status of a Cisco vSmart Controller
You have the following options to view the status of a Cisco vSmart Controller.
Use the Dashboard Screen
From the Cisco vManage menu, choose Monitor > Overview.
Cisco vManage Release 20.6.x and earlier: From the Cisco vManage menu, choose Dashboard > Main Dashboard.
For releases before Cisco vManage Release 20.6.1, click the upward or downward arrow next to Cisco vSmart.
For Cisco vManage Release 20.6.1 and later, click the number representing the number of Cisco vSmart controllers in your overlay network.
To know the status of the Cisco vSmart Controller, see the Reachability column in the dialog box that opens.
Use the Geography Screen
From the Cisco vManage menu, choose Monitor > Geography.
Click Filter and choose vSmart under Types.
Click the Cisco vSmart icon to check its status.
Use the Network Screen
From the Cisco vManage menu, choose Monitor > Devices.
Cisco vManage Release 20.6.x and earlier: From the Cisco vManage menu, choose Monitor > Network.
Locate the Cisco vSmart Controller that you want to view the status for. You can either scroll through the list of devices in the device table or enter vBond
as the keyword in the search bar.
Click the relevant Cisco vSmart Controller instance under the Hostname column. The Control Connections screen opens by default and displays information about all control connections that the device has with other controller
devices in the network.
View Tunnel Connections
To view details about the top 100 data plane tunnels between Cisco SD-WAN devices with the lowest average latency, do the
following:
From the Cisco vManage menu, choose Monitor > Tunnels.
The Tunnels table lists the following information about all tunnel end points:
Health
State
Quality of Experience (QoE) score. The QoE score rates the quality of experience of an application that a network can deliver
for a period of time.
Local IP and remote IP
Average latency, loss, and jitter data
The health of a tunnel is defined based on the following criteria:
Good: If the QOE score is between 8 and 10, and the tunnel status is 1/1.
Fair: If the QOE score is between 5 and 7, and the tunnel status is 1/1.
Poor: If the QOE score is between 1 and 4, or the tunnel status is 0/1.
Note
The tunnel information is available in Cisco vManage as a separate menu starting from Cisco vManage Release 20.7.1.
To view tunnel connections of a specific device, do the following:
From the Cisco vManage menu, choose Monitor > Devices.
Cisco vManage Release 20.6.x and earlier: From the Cisco vManage menu, choose Monitor > Network.
Choose a device from the list of devices that is displayed.
In the left pane, click TLOC under the WAN area. The right pane displays information about all tunnel connections.
(Optional) Click the Chart Options drop-down list to choose the type of data to view.
You can also choose a predefined time period or a custom time period to sort the data.
(Optional) In the lower part of the right pane, use the filter option in the search bar to customize the table fields you
want to view.
The tunnel table lists average latency, loss, and jitter data about all tunnel end points. By default, the first six tunnels
are selected. The graphical display in the upper part of the right pane plots information for the selected tunnels.
(Optional) Click the check box to the left to select and deselect tunnels. You can select and view information for a maximum
of 30 tunnels at one time.
(Optional) Click Application Usage to the right to view the SD-WAN Application Intelligence Engine (SAIE) flow information for that TLOC.
Note
Beginning with Cisco vManage Release 20.8.1, the Application Usage column and the Application Usage links are removed from the Monitor > Devices > WAN – Tunnel window. After you have configured on-demand troubleshooting for a device, you can view SAIE usage data based on the selected
filters or based on application families sorted by usage.
In Cisco vManage Release 20.7.x and earlier releases, the SAIE flow is called the deep packet inspection (DPI) flow.
To view IPSec tunnel information on a device, perform the following steps:
From the Cisco vManage menu, choose Monitor > Devices.
Cisco vManage Release 20.6.x and earlier: From the Cisco vManage menu, choose Monitor > Network.
Choose a device from the list of devices that is displayed.
Click Real Time in the left pane.
Click Device Options, and choose one of the following commands:
Device Option
CLI Command
Description
IPsec Inbound Connections
show tunnel inbound-connections
Displays information about the IPsec tunnel connections that originate on the local router, showing the TLOC addresses for
both ends of the tunnel.
IPsec Local SAs
show tunnel local-sa
Displays the IPsec tunnel security associations for the local TLOCs.
View Tunnel Loss Statistics
View Data Plane Tunnel Loss Statistics
From the Cisco vManage menu, choose Monitor > Devices.
Cisco vManage Release 20.6.x and earlier: From the Cisco vManage menu, choose Monitor > Network.
Choose a device from the list of devices that displays.
Click Real Time in the left pane.
From the Device Options drop-down list, choose Tunnel Statistics.
View Traffic Loss for Application-Aware Routing
From the Cisco vManage menu, choose Monitor > Overview.
Cisco vManage Release 20.6.x and earlier: From the Cisco vManage menu, choose Dashboard > Main Dashboard.
Scroll down to the Application-Aware Routing pane.
You can also use the show app-route statistics command to view traffic loss for application-aware routing.
View WAN Interfaces
Transport interfaces in VPN 0 connect to a WAN network of some kind, such as the Internet, Metro Ethernet network, or an MPLS
network.
You can view information about WAN interfaces on a device using one of the following options:
Real Time Pane
From the Cisco vManage menu, choose Monitor > Devices.
Cisco vManage Release 20.6.x and earlier: From the Cisco vManage menu, choose Monitor > Network.
Locate the device that you want to view the status for. You can either scroll through the list of devices in the device table
or enter a keyword in the search bar.
Choose the device by clicking its name in the Hostname column.
In the window that opens, choose Real Time in the left pane.
From the Device Options drop-down in the right pane, choose Control WAN Interface Information.
Interface Pane
From the Cisco vManage menu, choose Monitor > Devices.
Cisco vManage Release 20.6.x and earlier: From the Cisco vManage menu, choose Monitor > Network.
From the Device Groups drop-down list, choose the device group to which the device belongs.
Choose the device by clicking its name in the Hostname column.
In the left pane, choose Interface.
View VRRP Information
From the Cisco vManage menu, choose Monitor > Devices.
Cisco vManage Release 20.6.x and earlier: From the Cisco vManage menu, choose Monitor > Network.
Choose a device.
Click Real Time from the left pane.
Click Device Options, and choose VRRP Information.
View Device Interfaces
To view information about interfaces on a device:
From the Cisco vManage menu, choose Monitor > Devices.
Cisco vManage Release 20.6.x and earlier: From the Cisco vManage menu, choose Monitor > Network.
Choose a device by clicking its name in the Hostname column.
Click Interface in the left pane. The right pane displays interface information for the device.
The upper part of the right pane contains:
Chart Options bar—Located directly under the device name, this bar includes:
Chart Options drop-down—Click Chart Options to choose how the data should be displayed.
IPv4 & IPv6 drop-down—Click IPv4 & IPv6 to choose the type of interfaces to view. The information is displayed in graphical format. By default, the graph is Combined,
showing interfaces on which both IPv4 and IPv6 addresses are configured. To view IPv4 and IPv6 interfaces in separate graphs,
select the Separated toggle button.
Time periods—Click either Real Time, a predefined time period, or a custom time period for which to view the data.
Interface information in graphical format.
Interface graph legend—Choose an interface to display information for just that interface.
The lower part of the right pane contains:
Filter criteria.
Interface table, which lists information about all interfaces. By default, the first six interfaces are displayed. The graphical
display in the upper part of the right pane plots information for the selected interfaces.
Check the check box to the left to select and deselect interfaces. You can select and view information for a maximum of 30
interfaces at a time.
To rearrange the columns, drag the column title to the desired position.
For cellular interfaces, click the interface name to view a detailed information about the cellular interface.


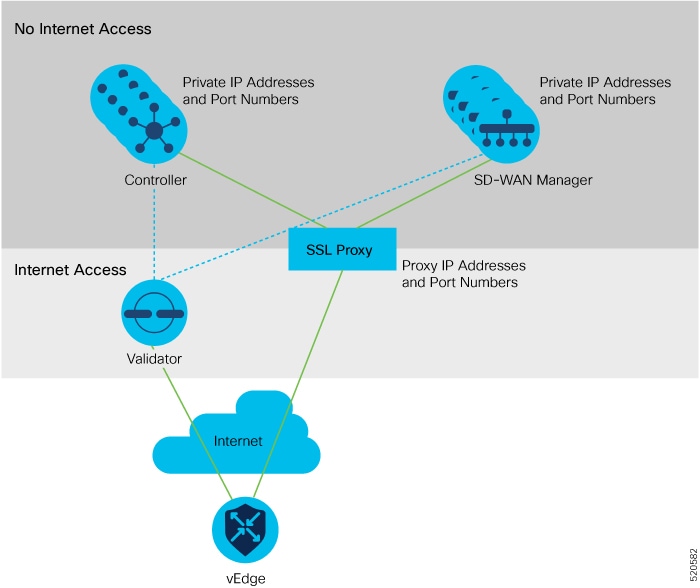
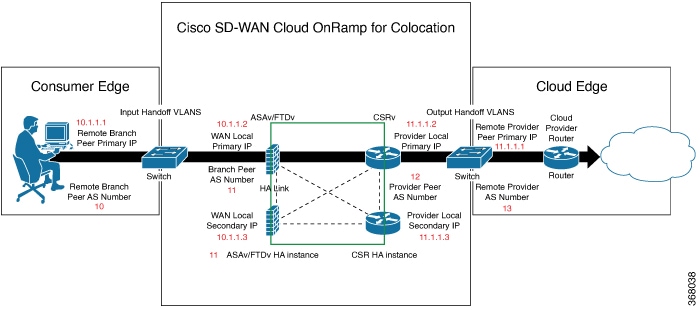
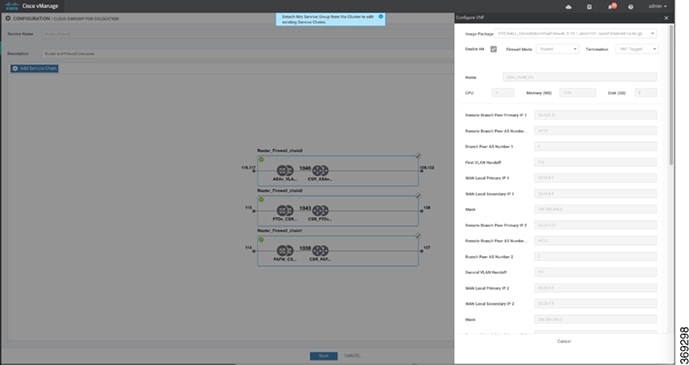
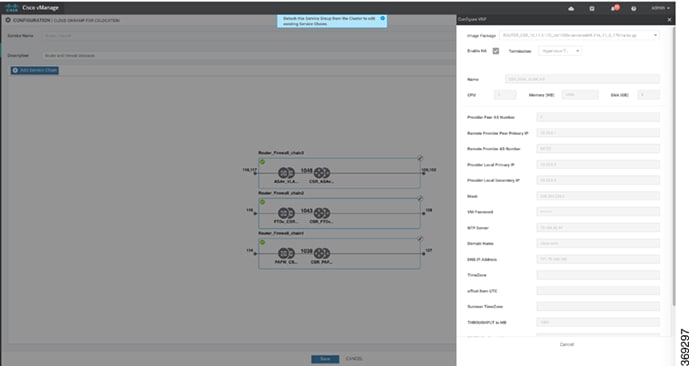
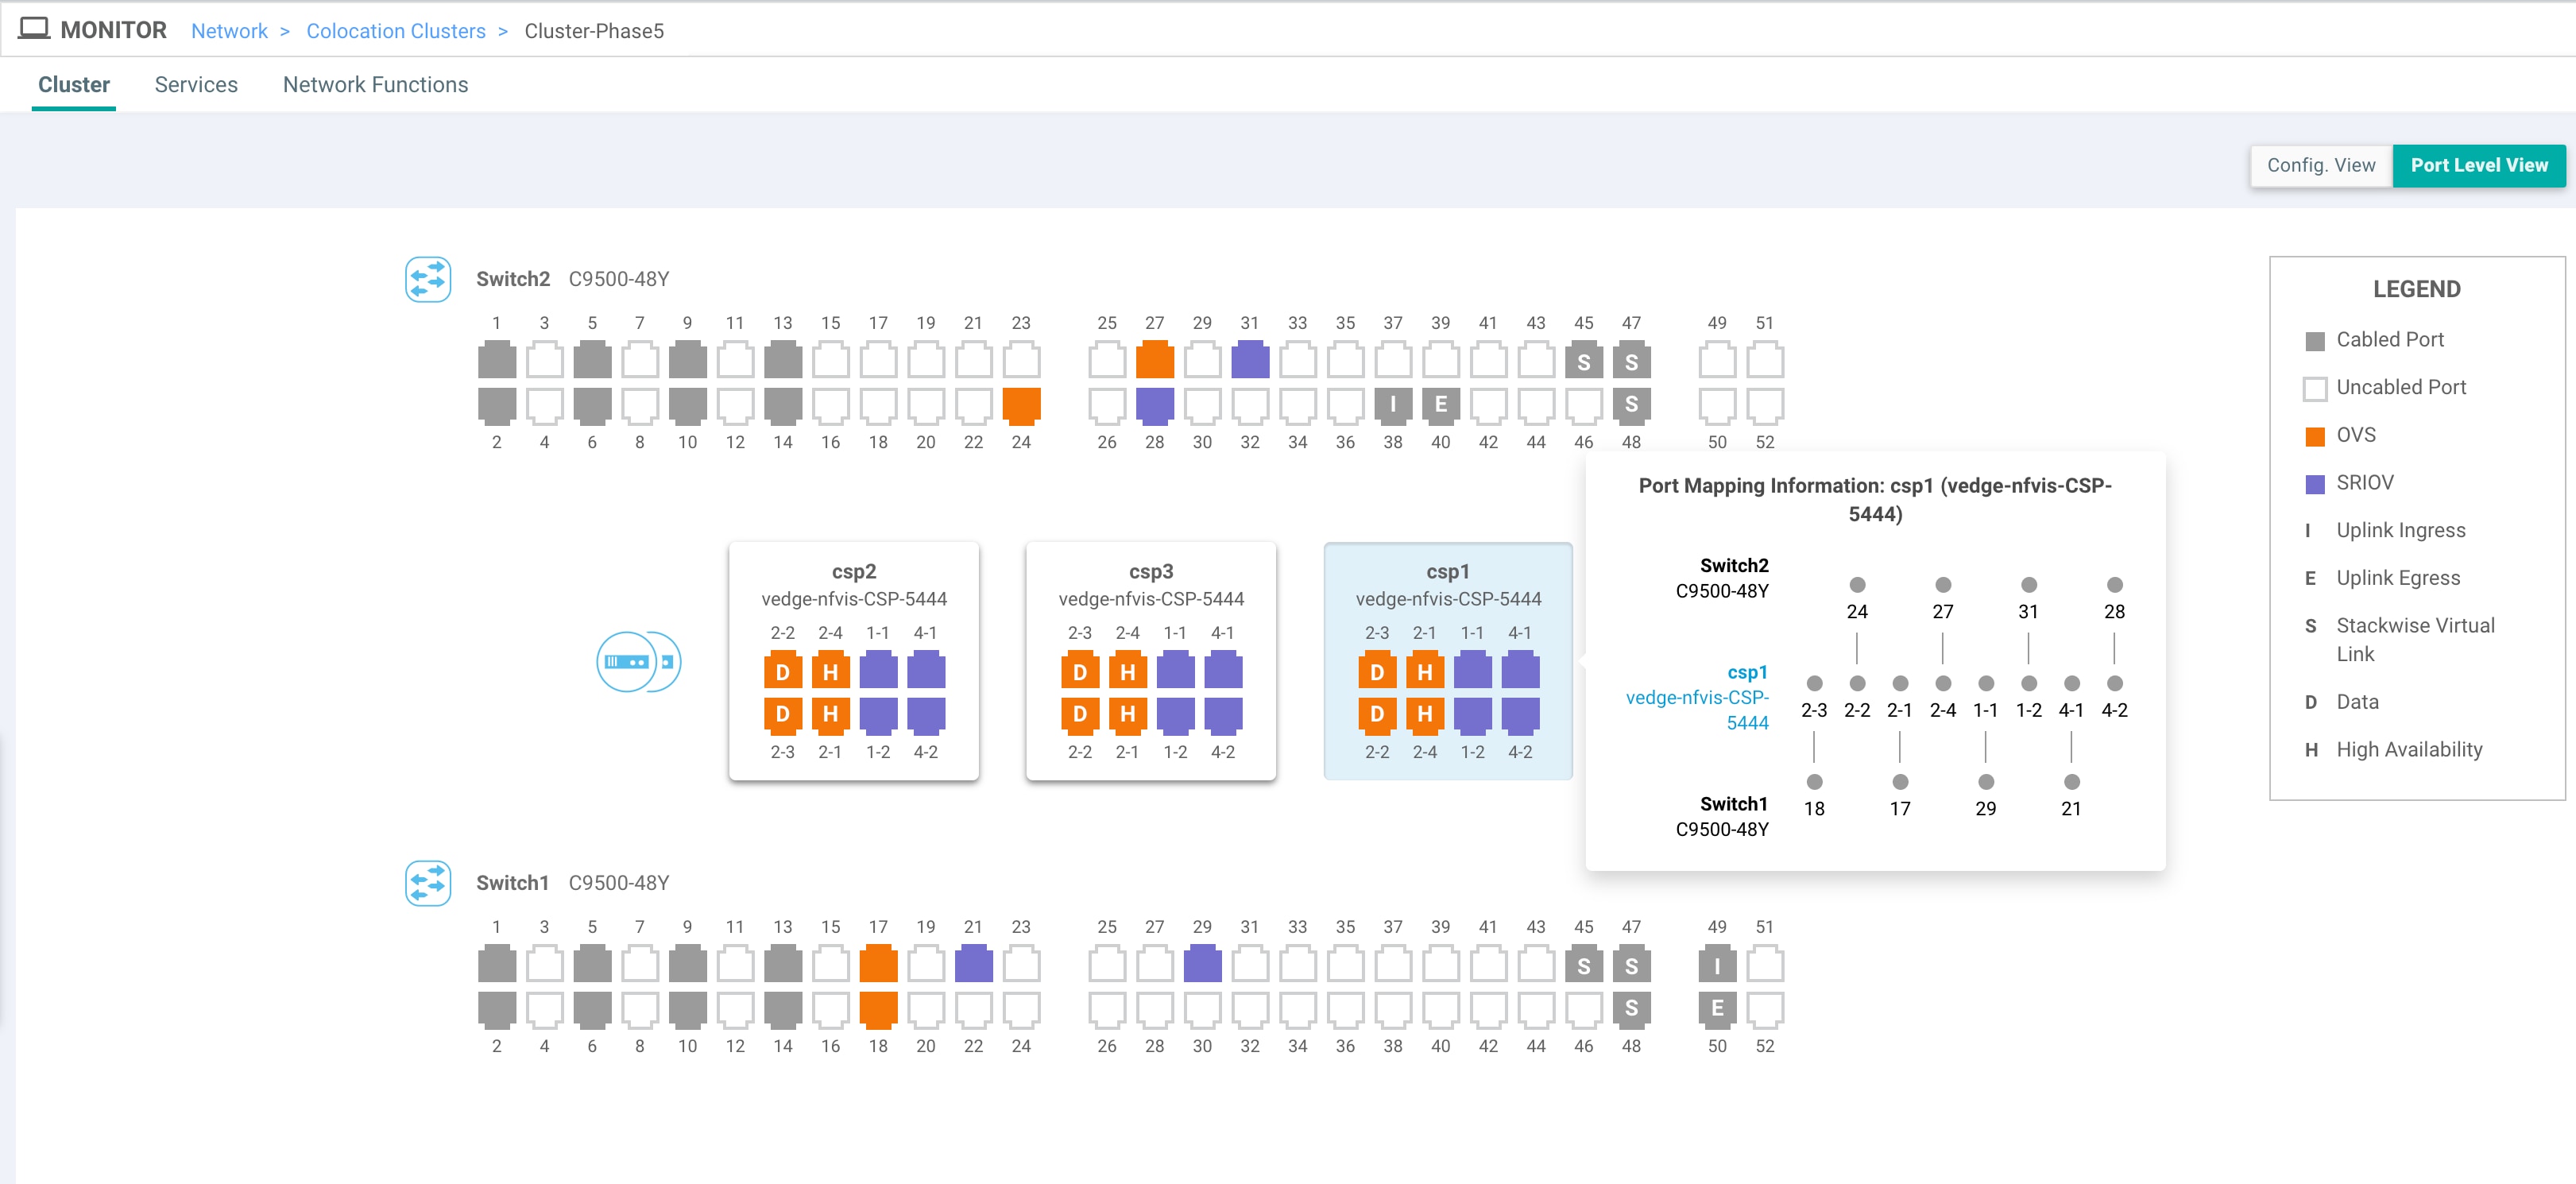

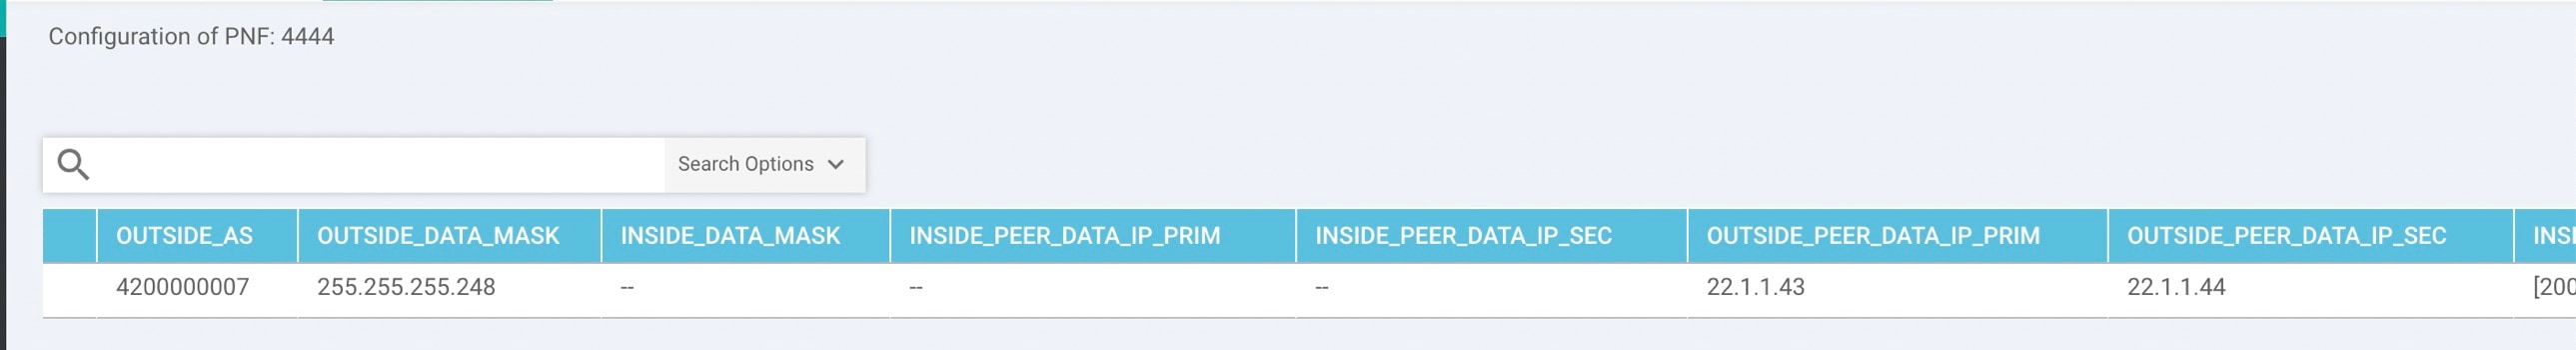
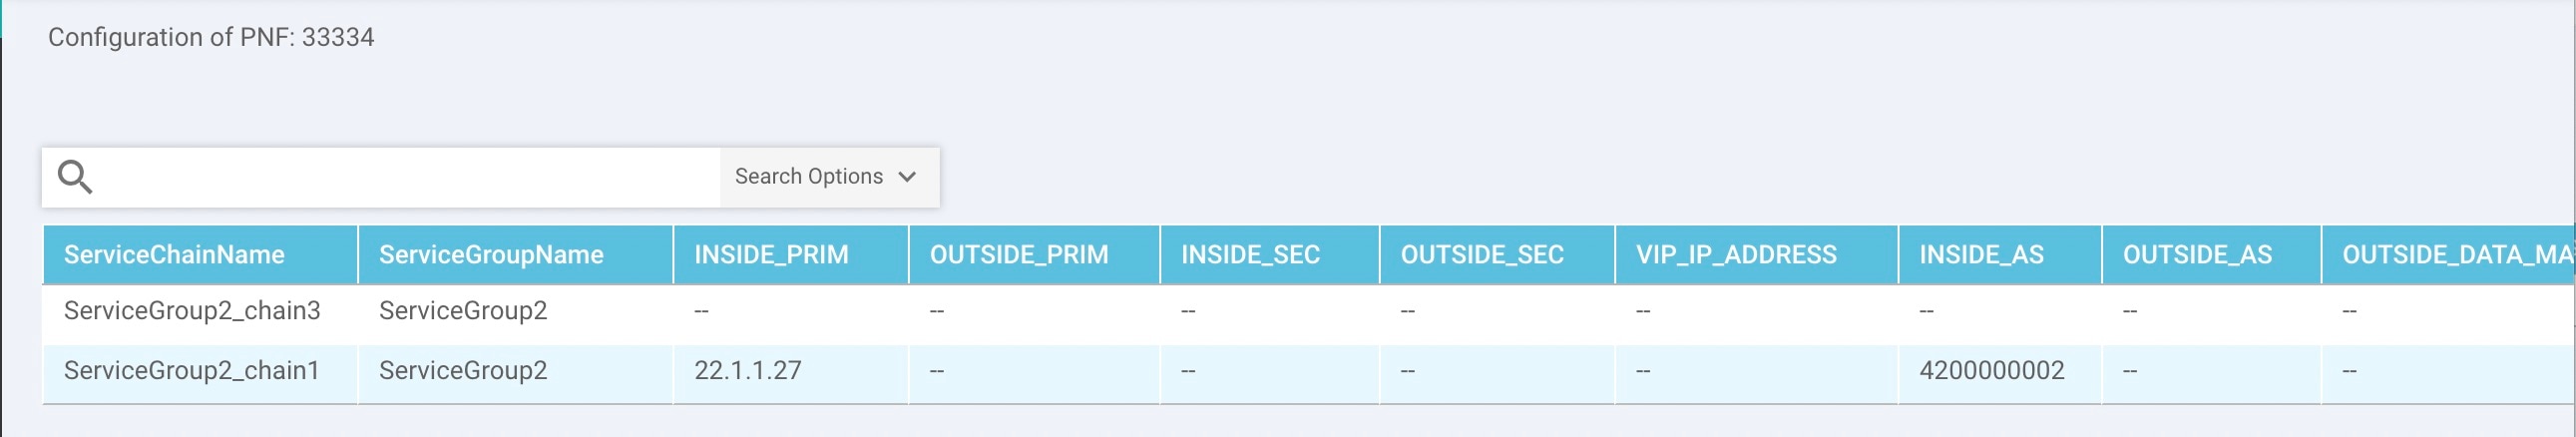
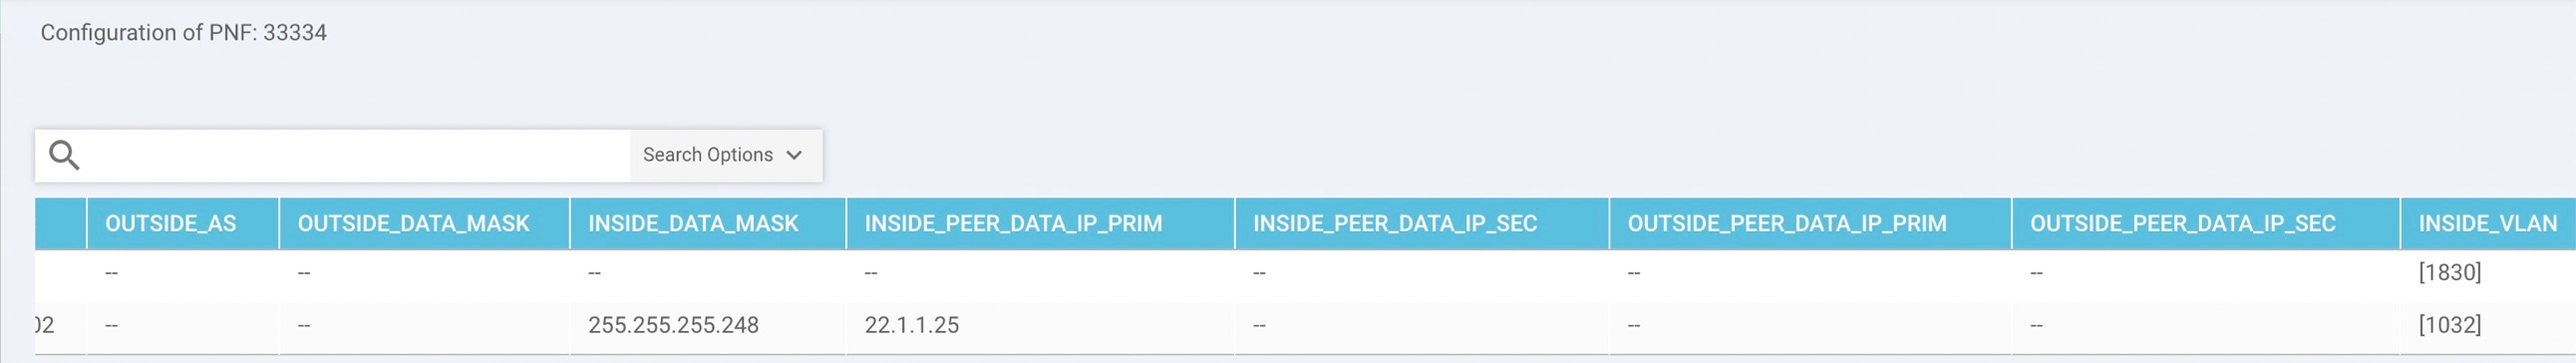
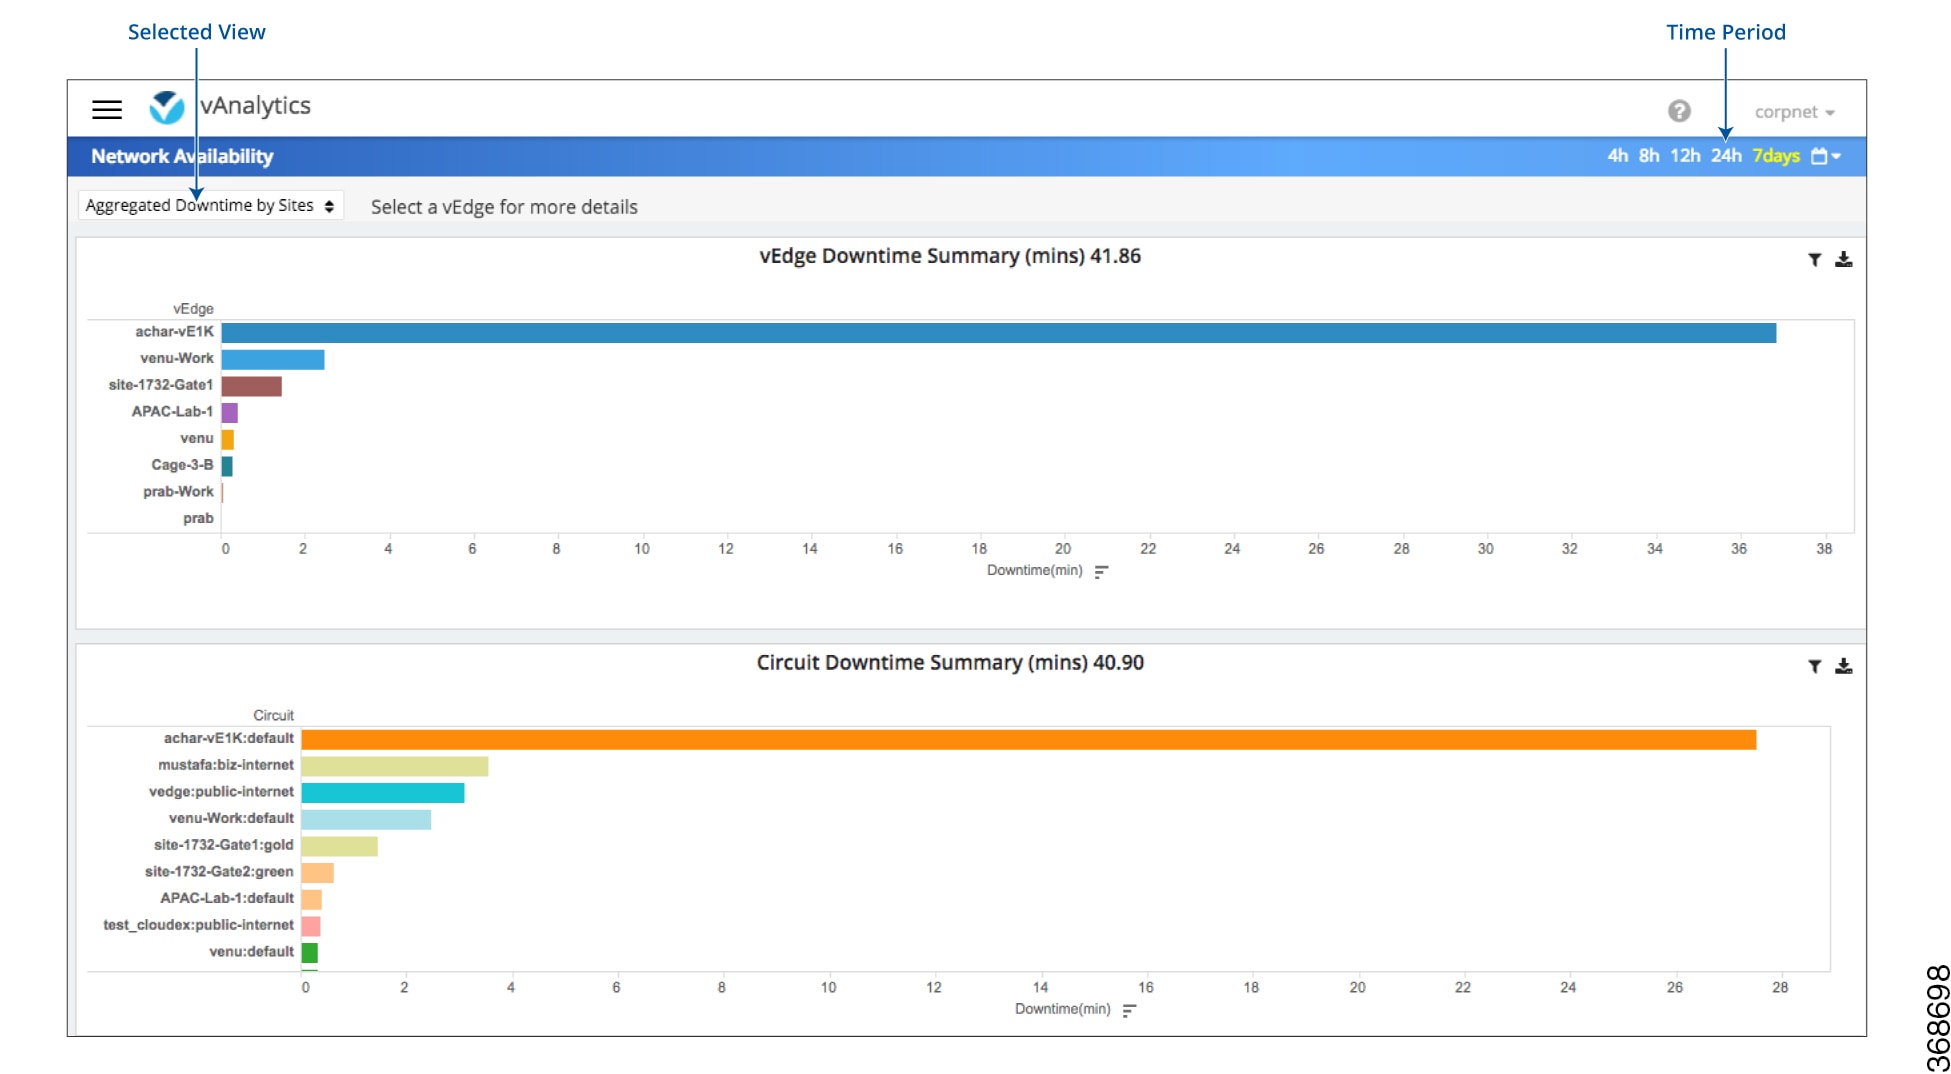

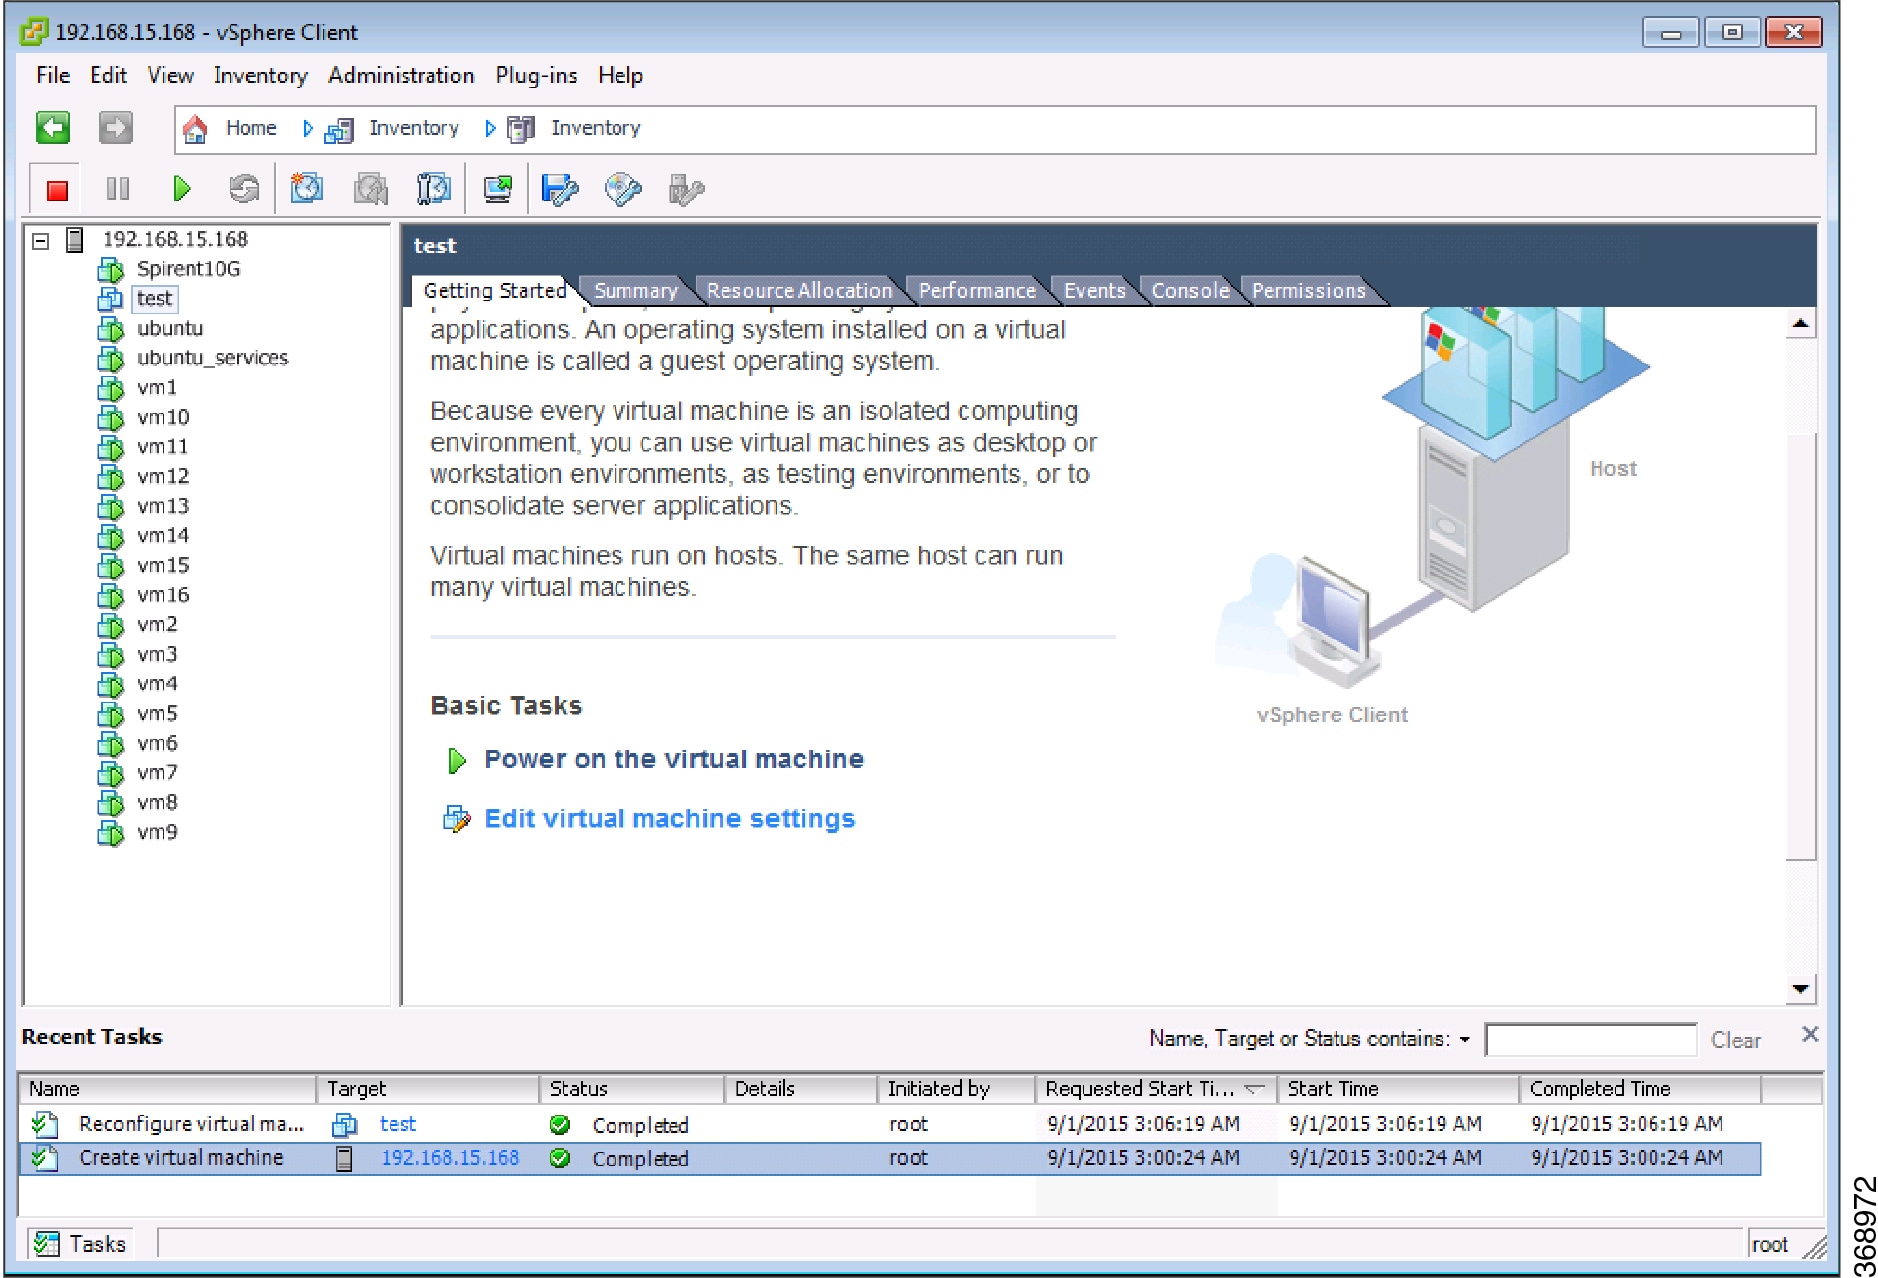
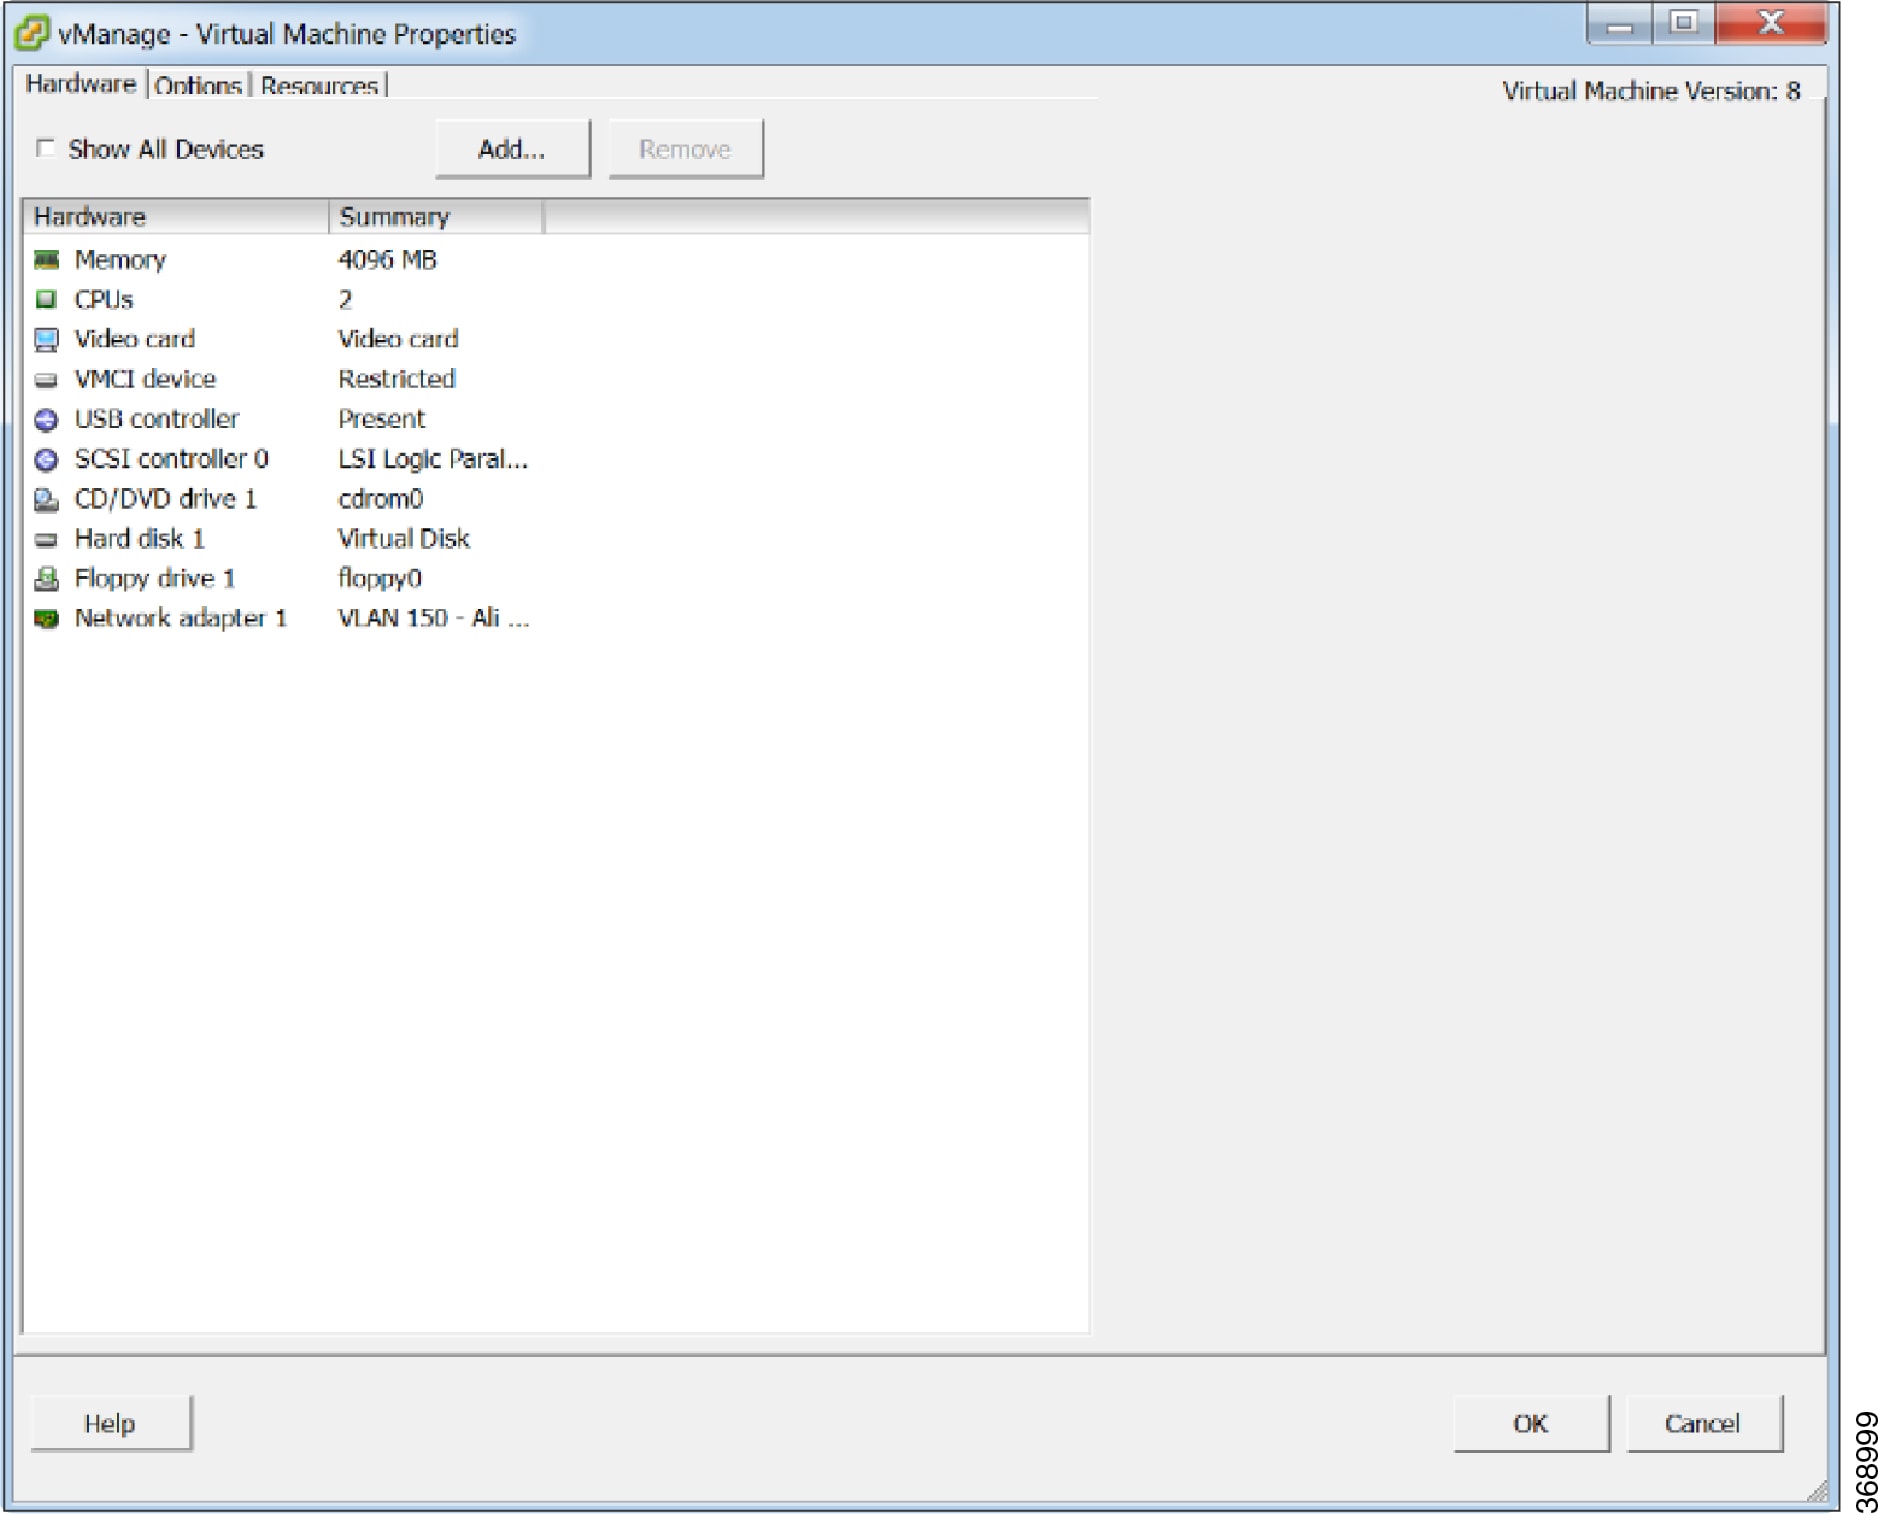
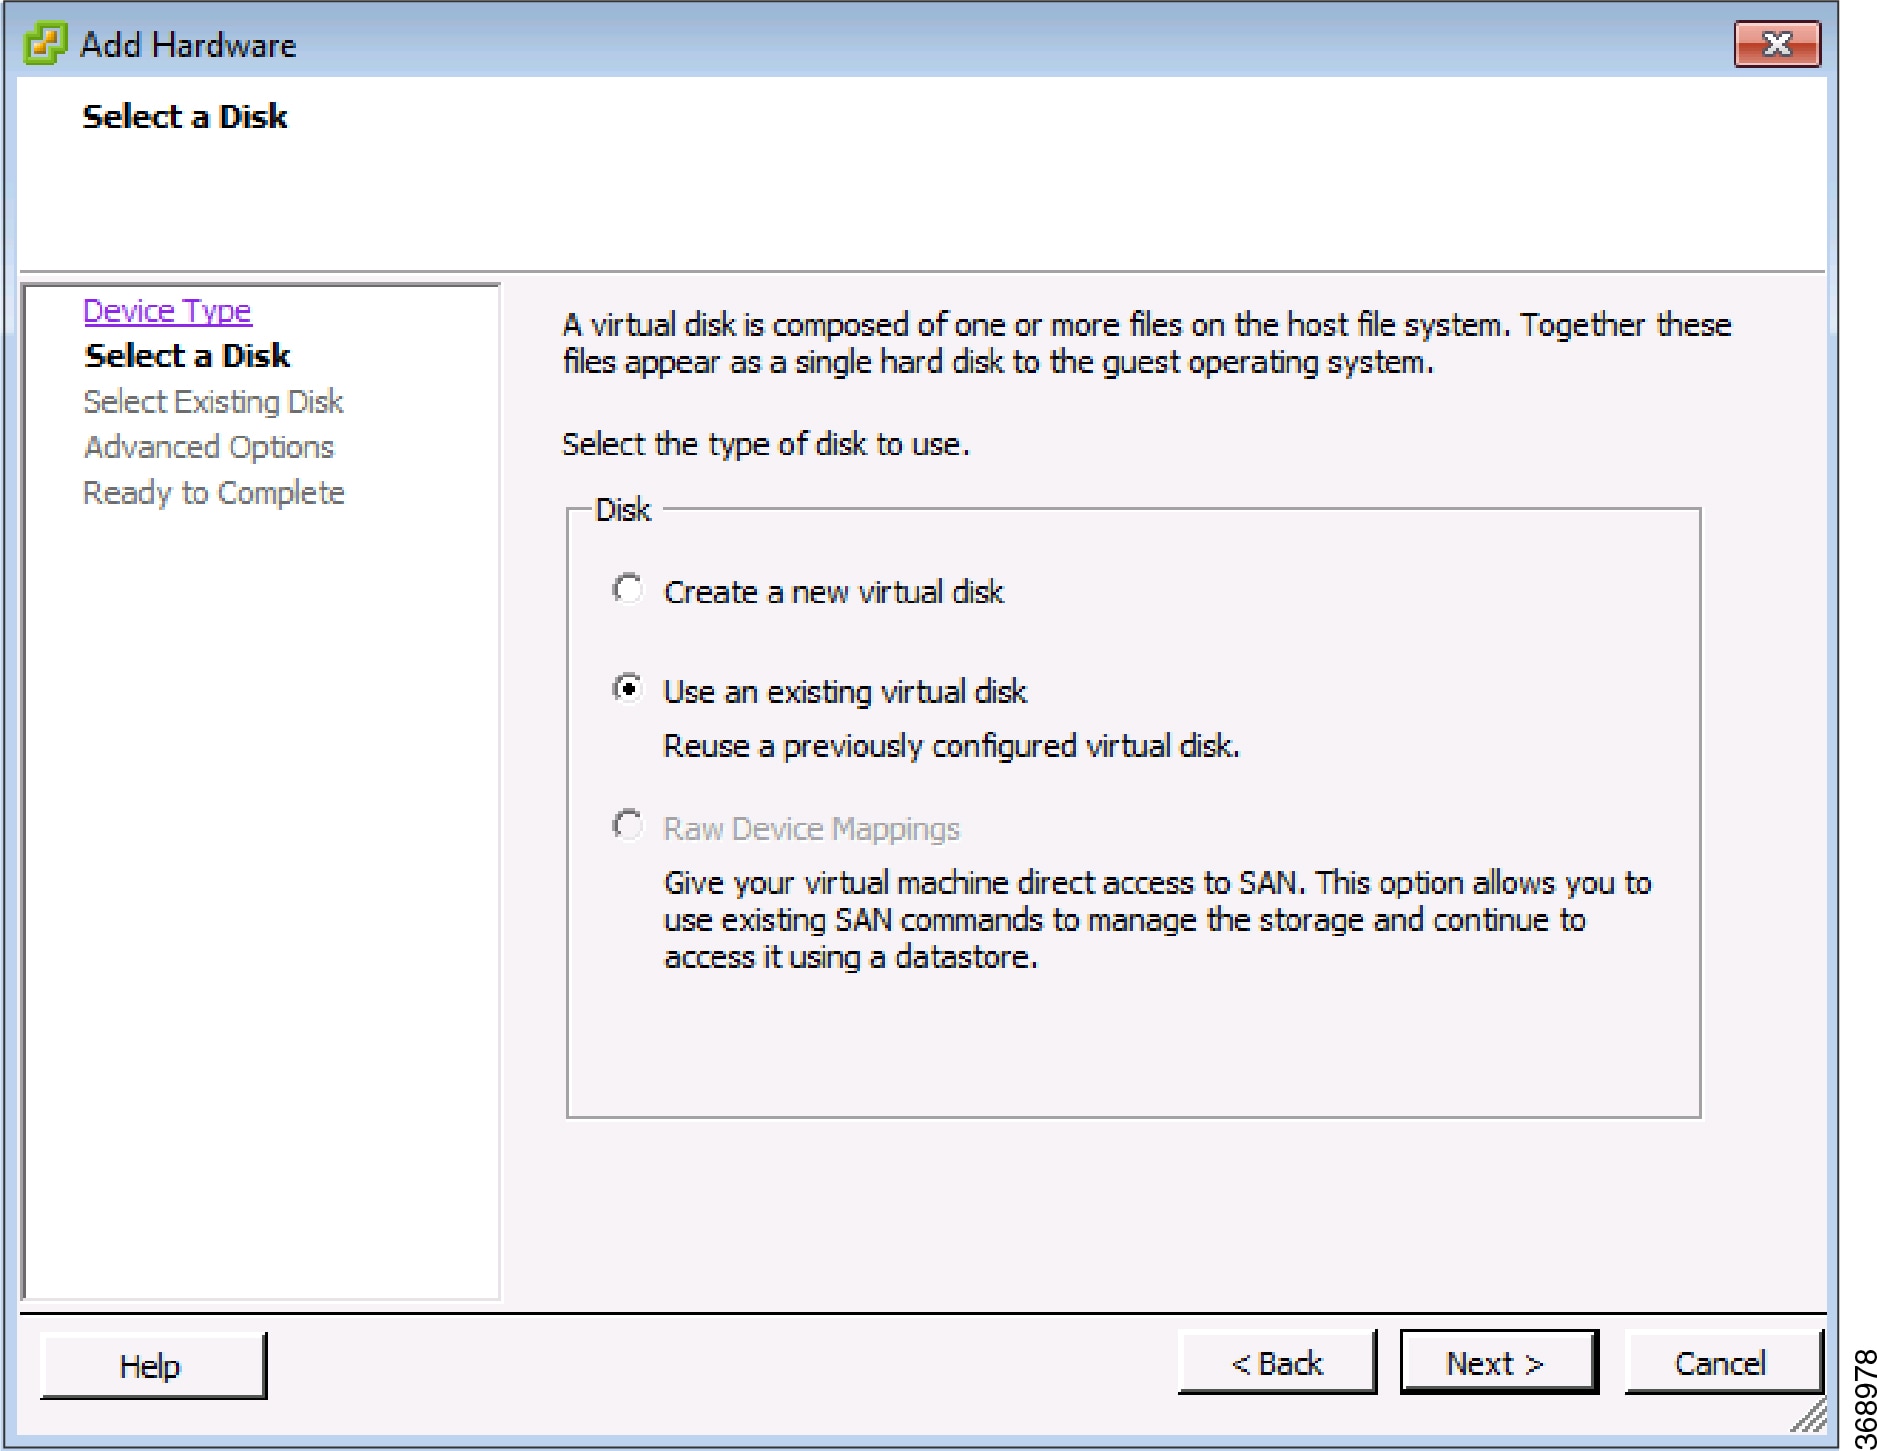
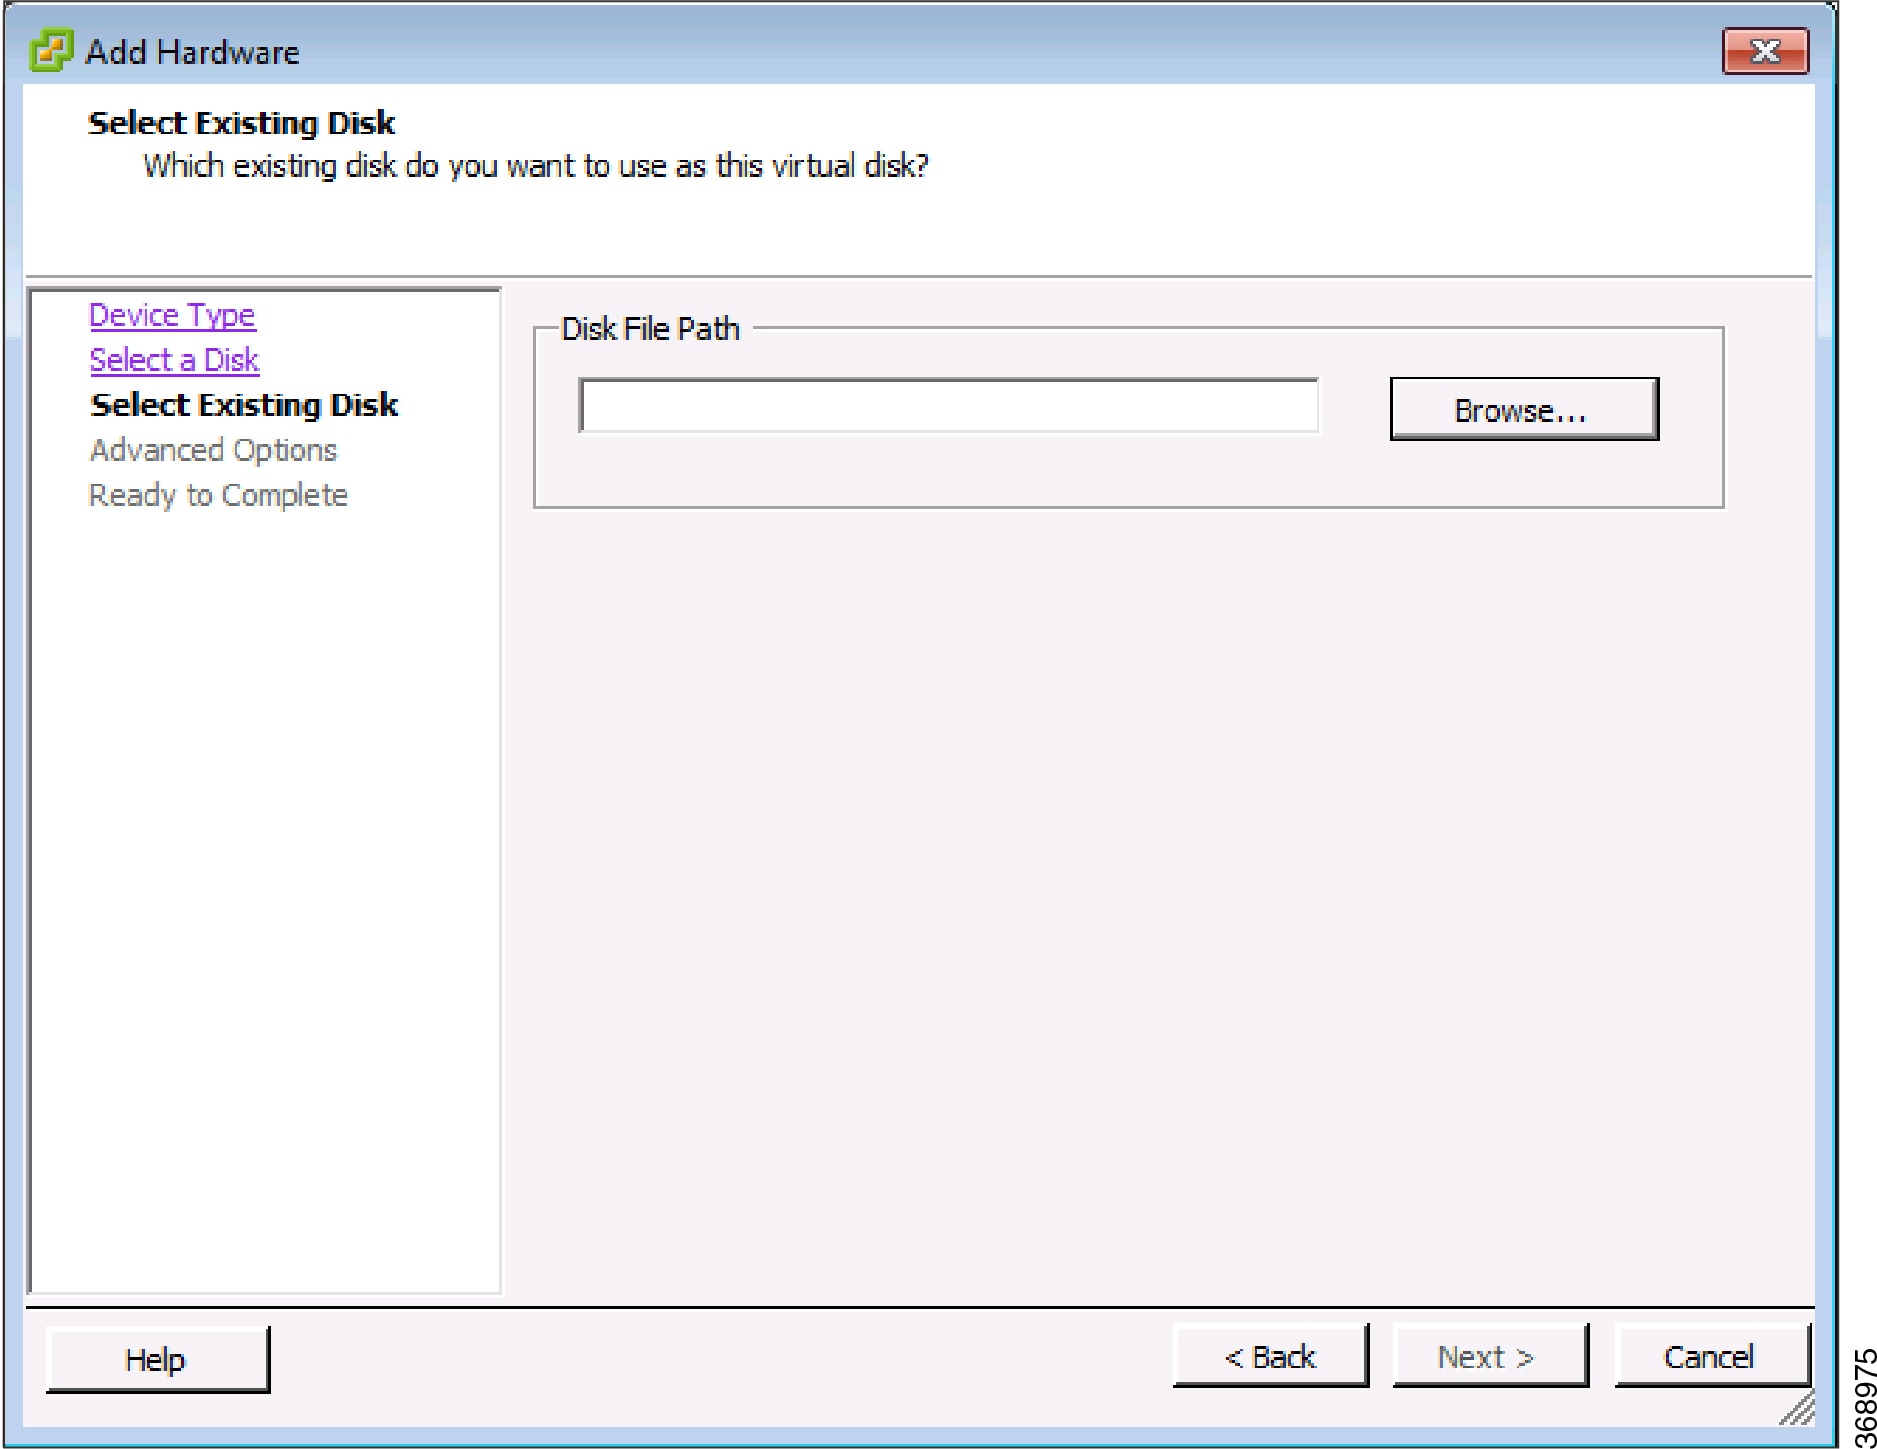
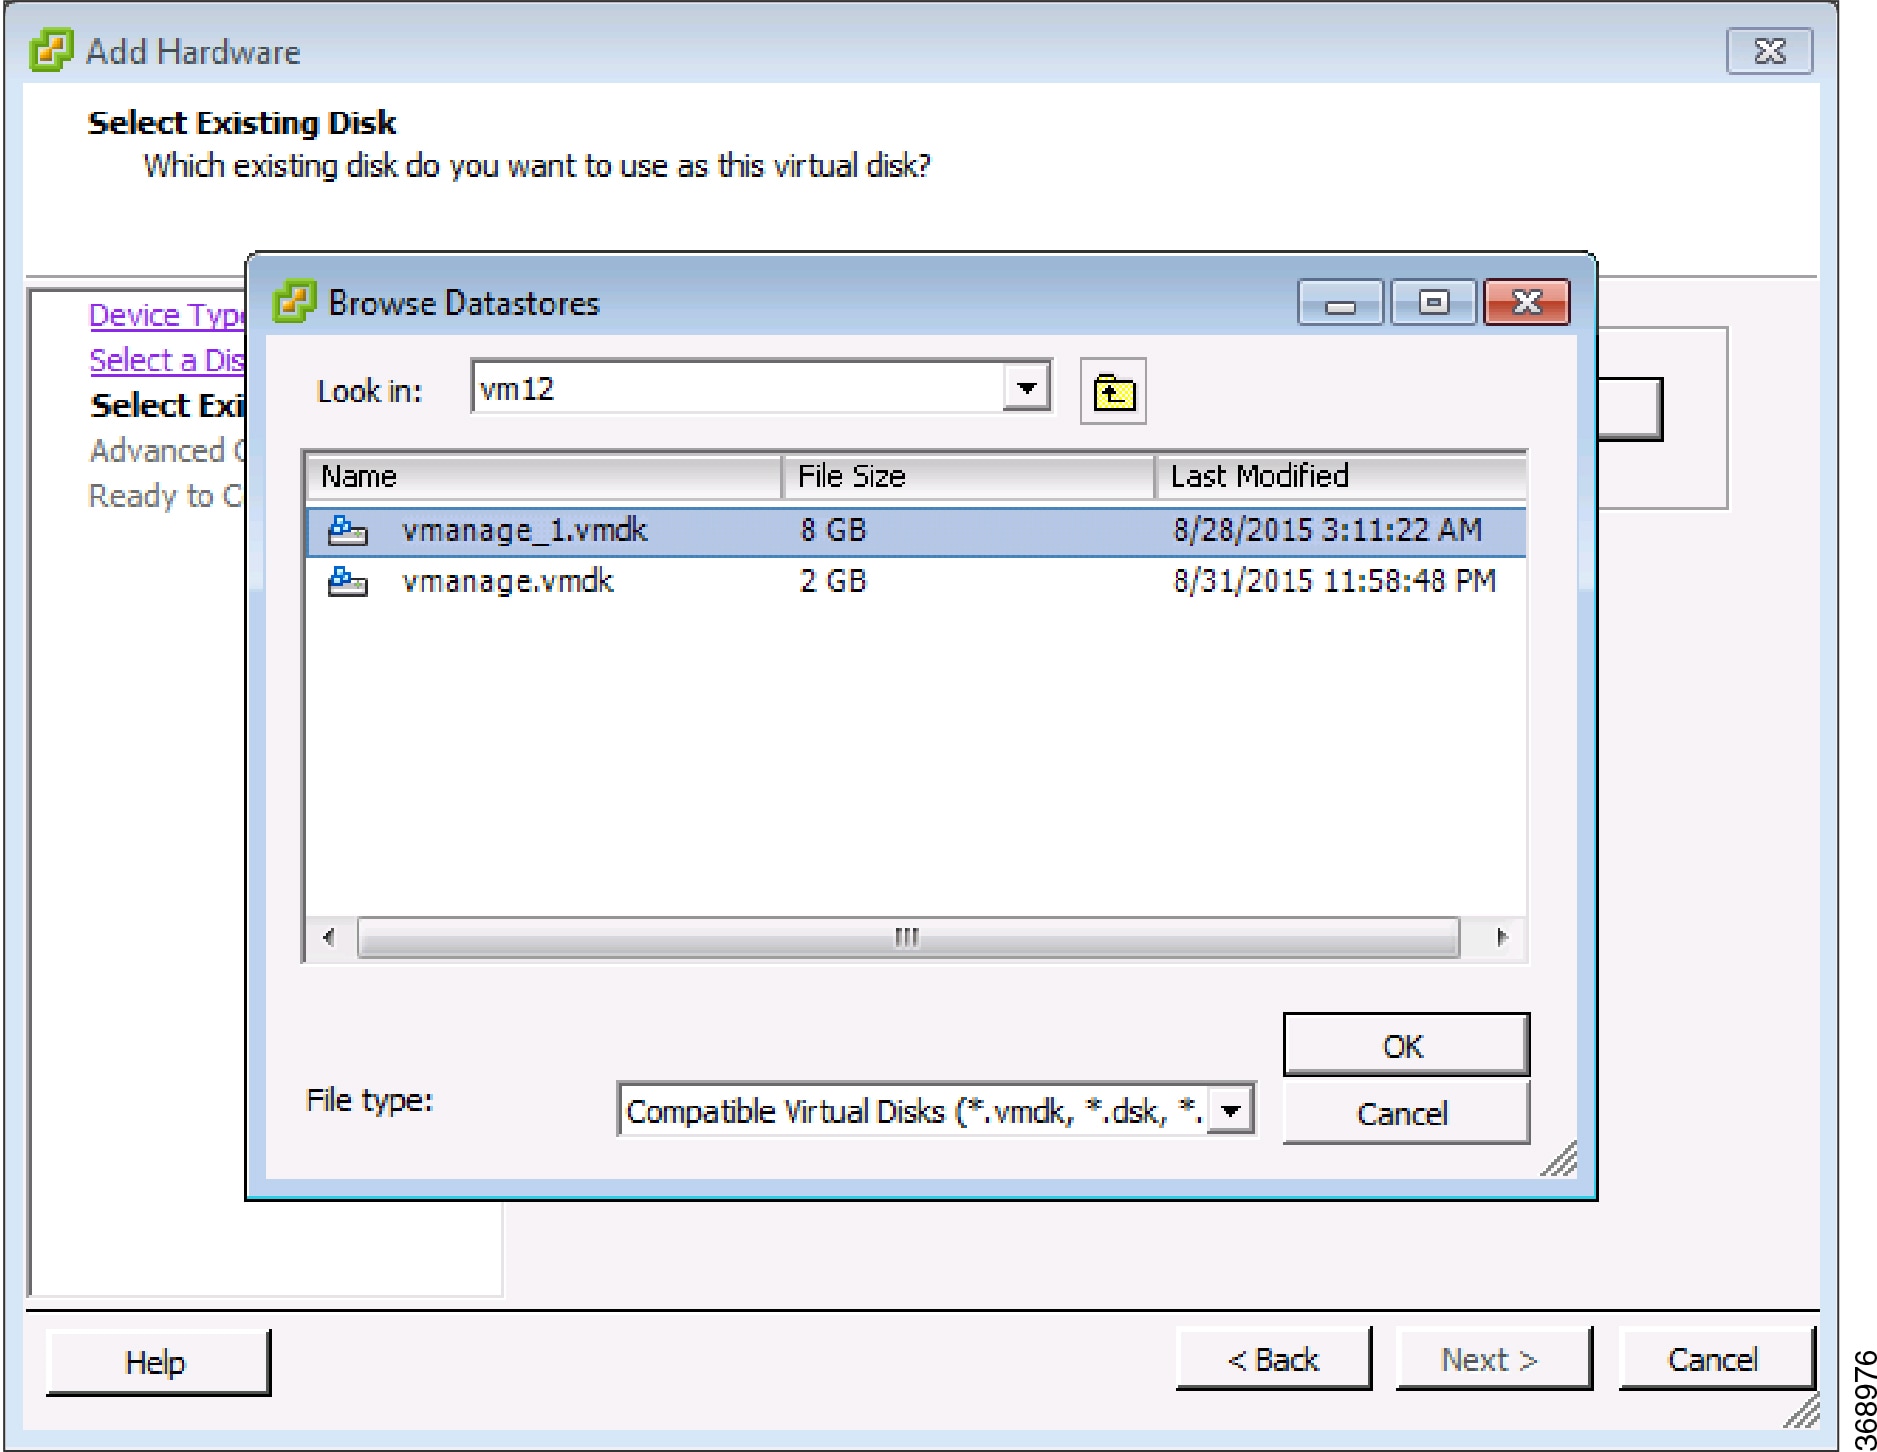
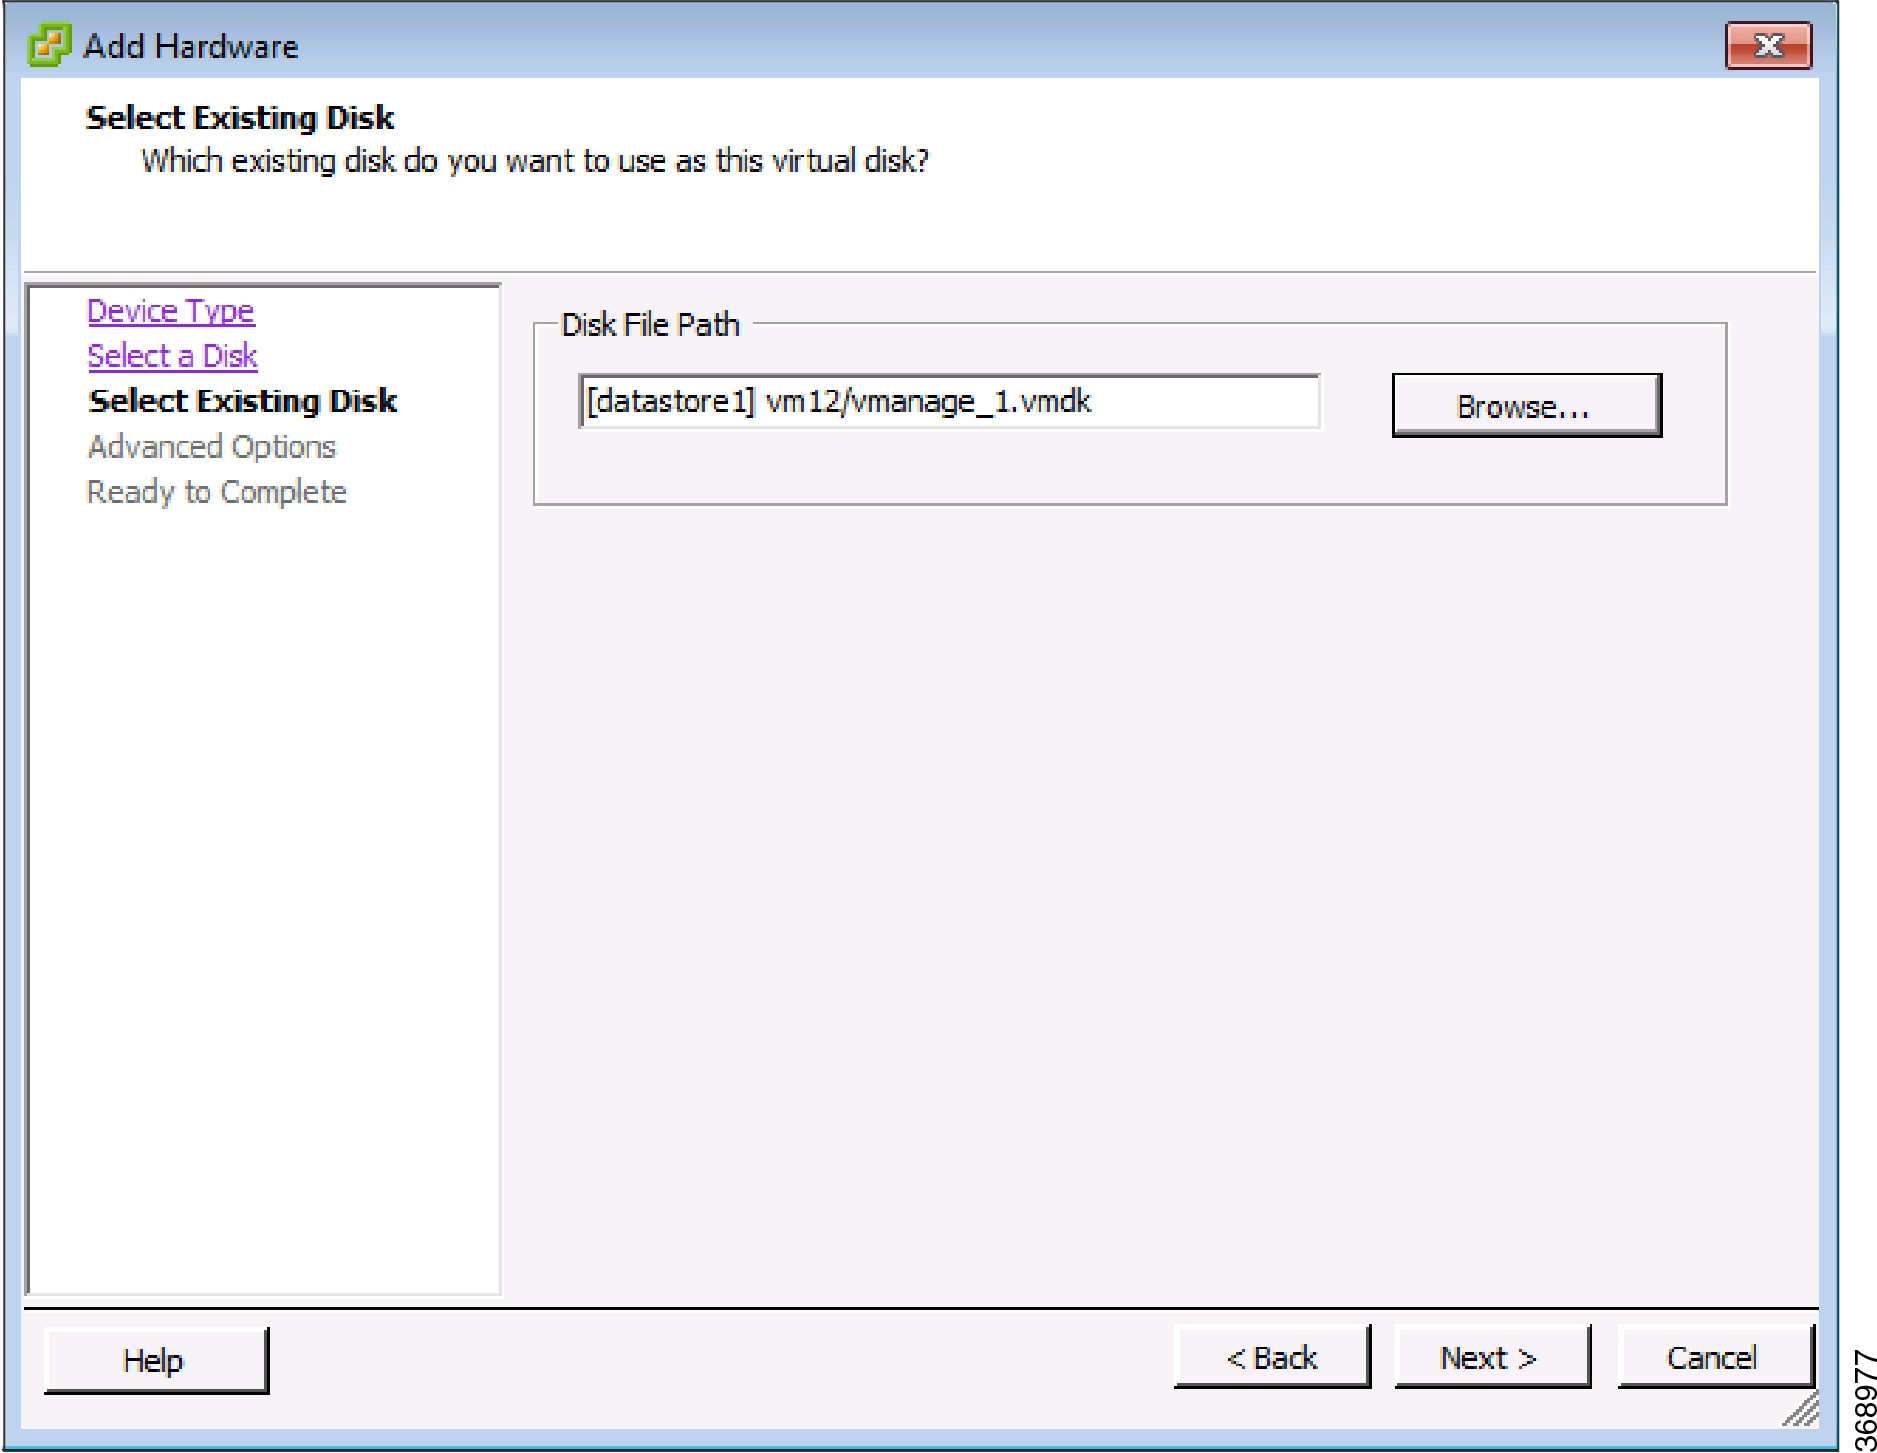
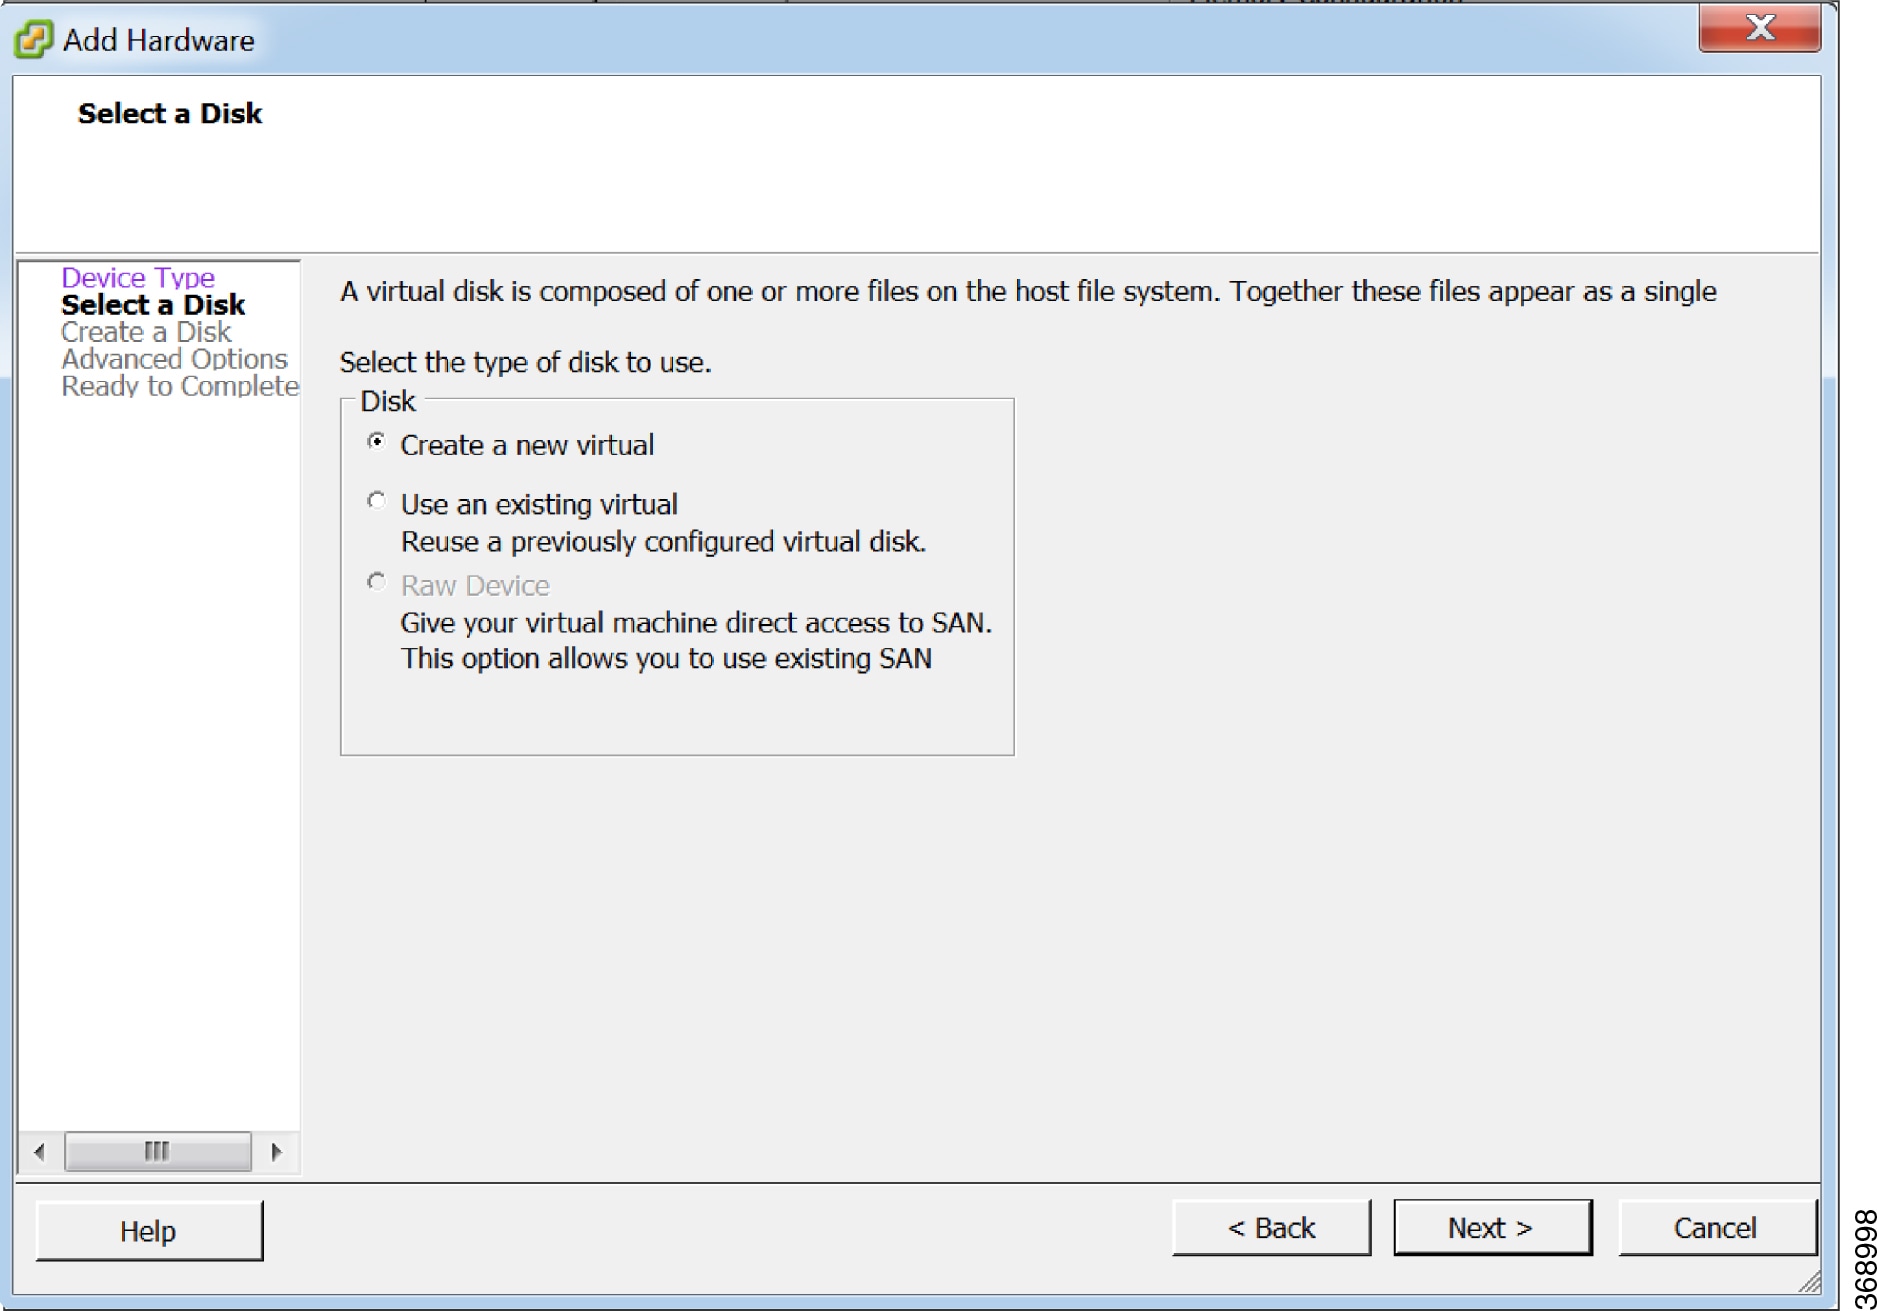
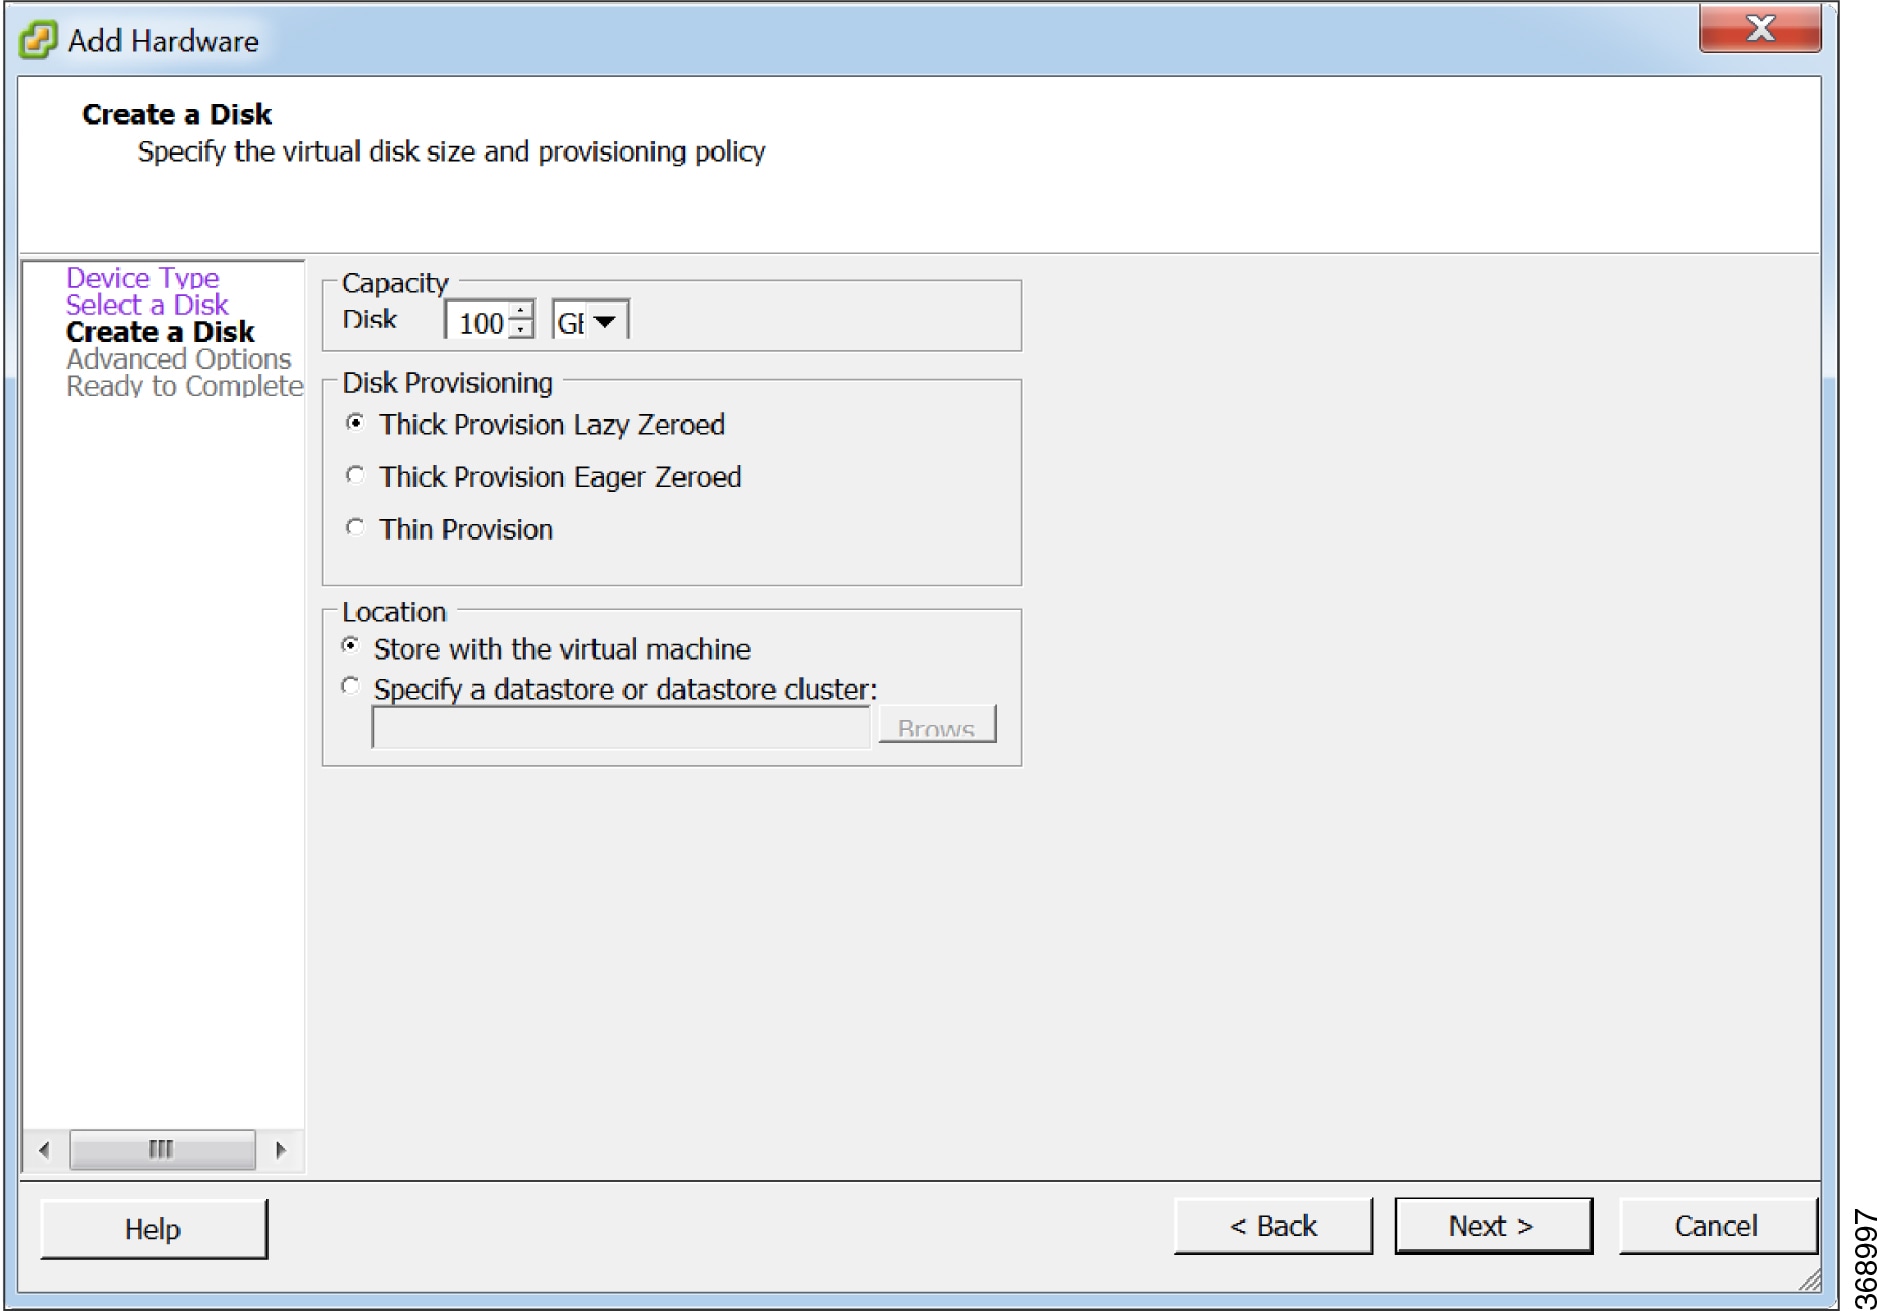
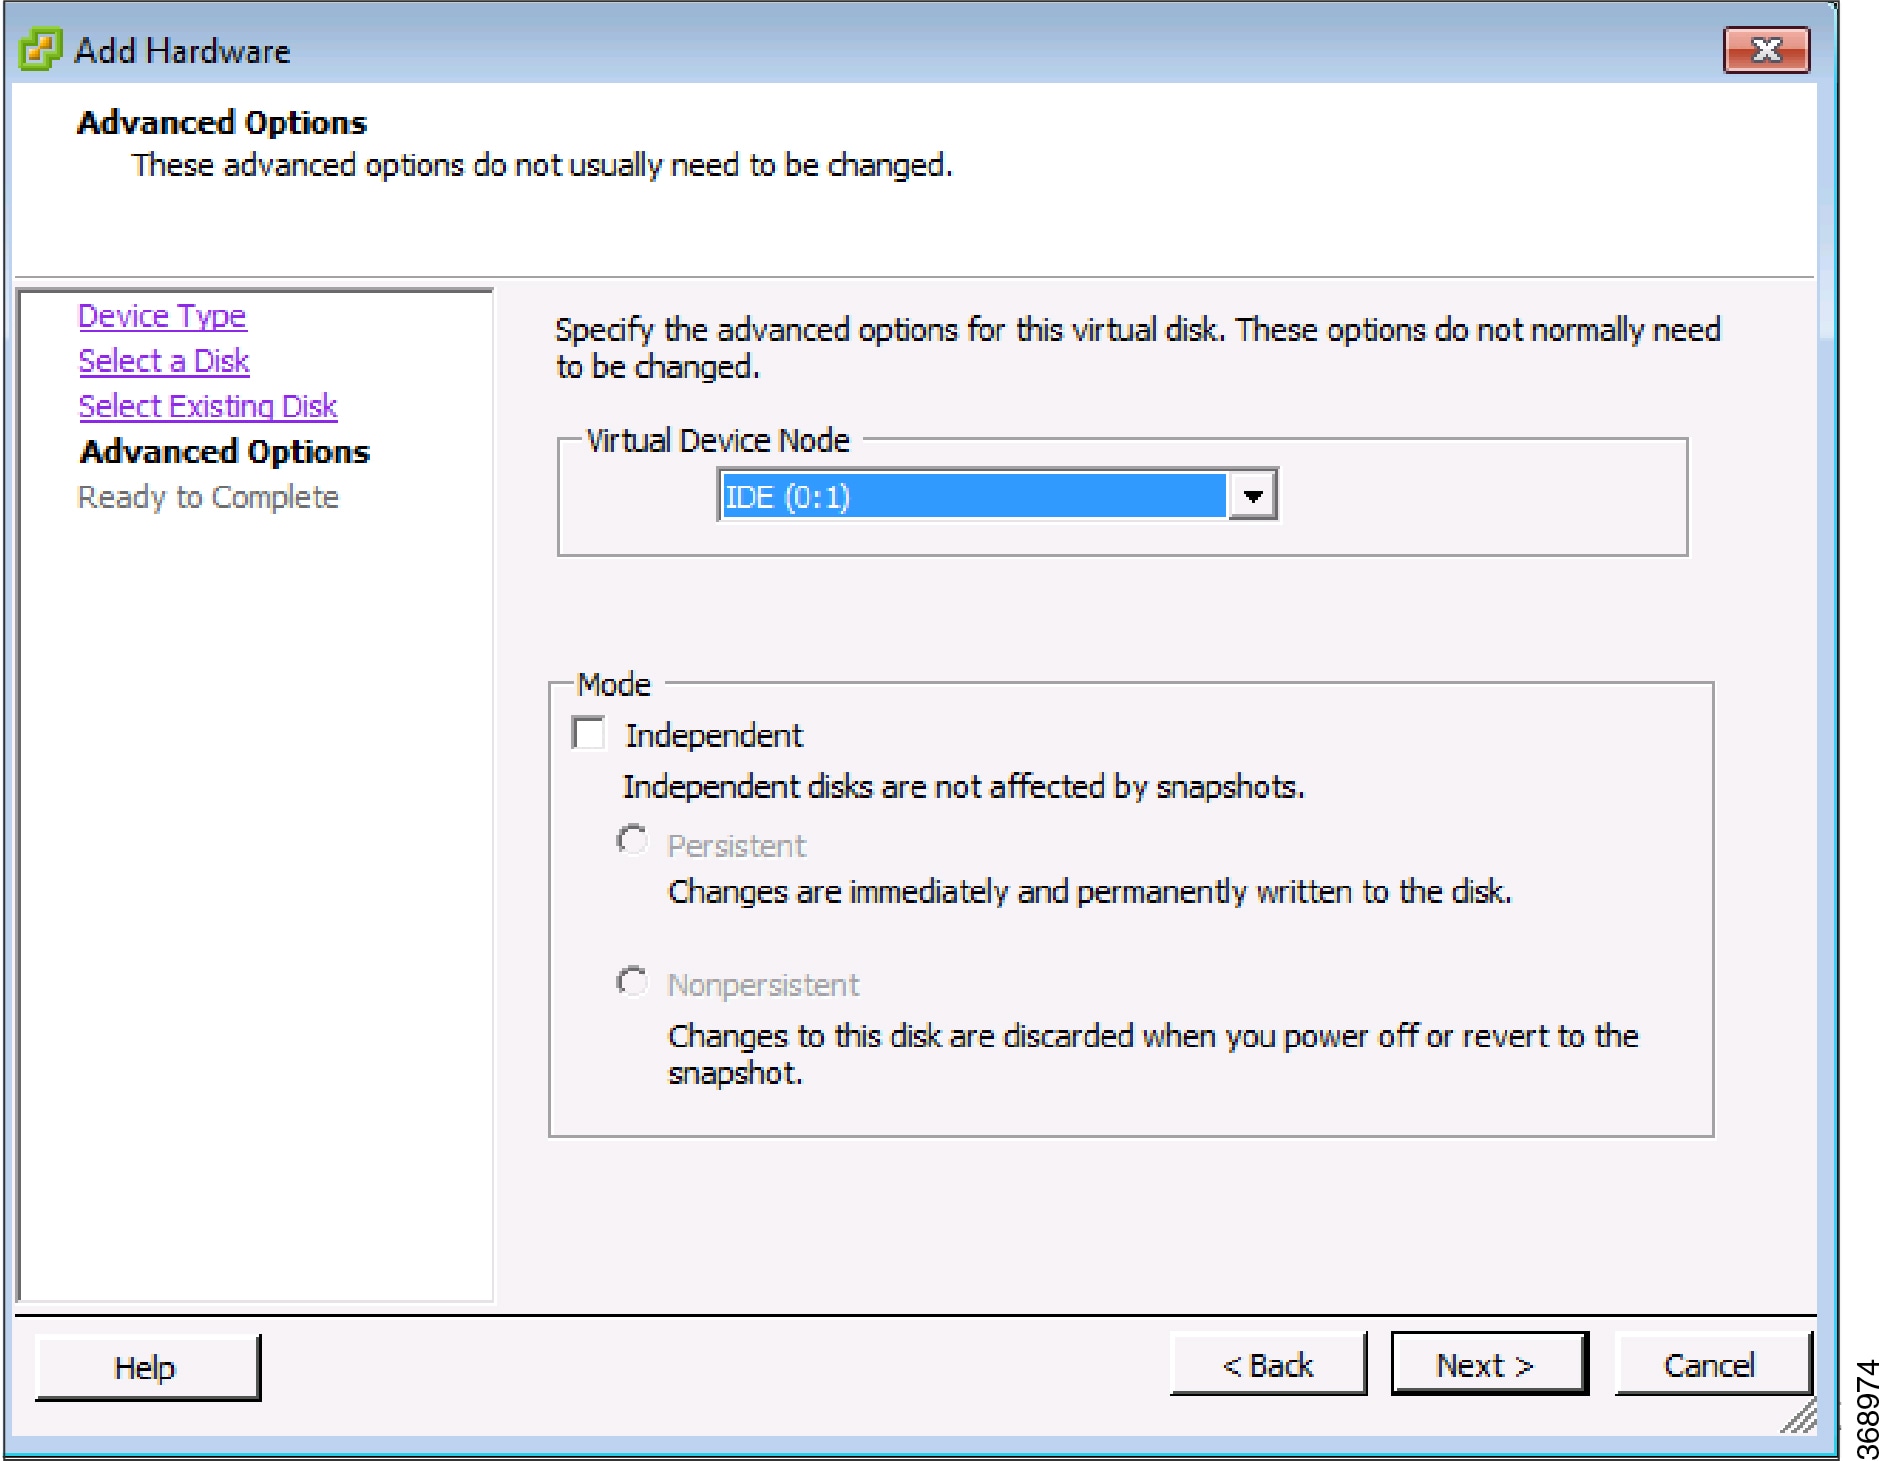
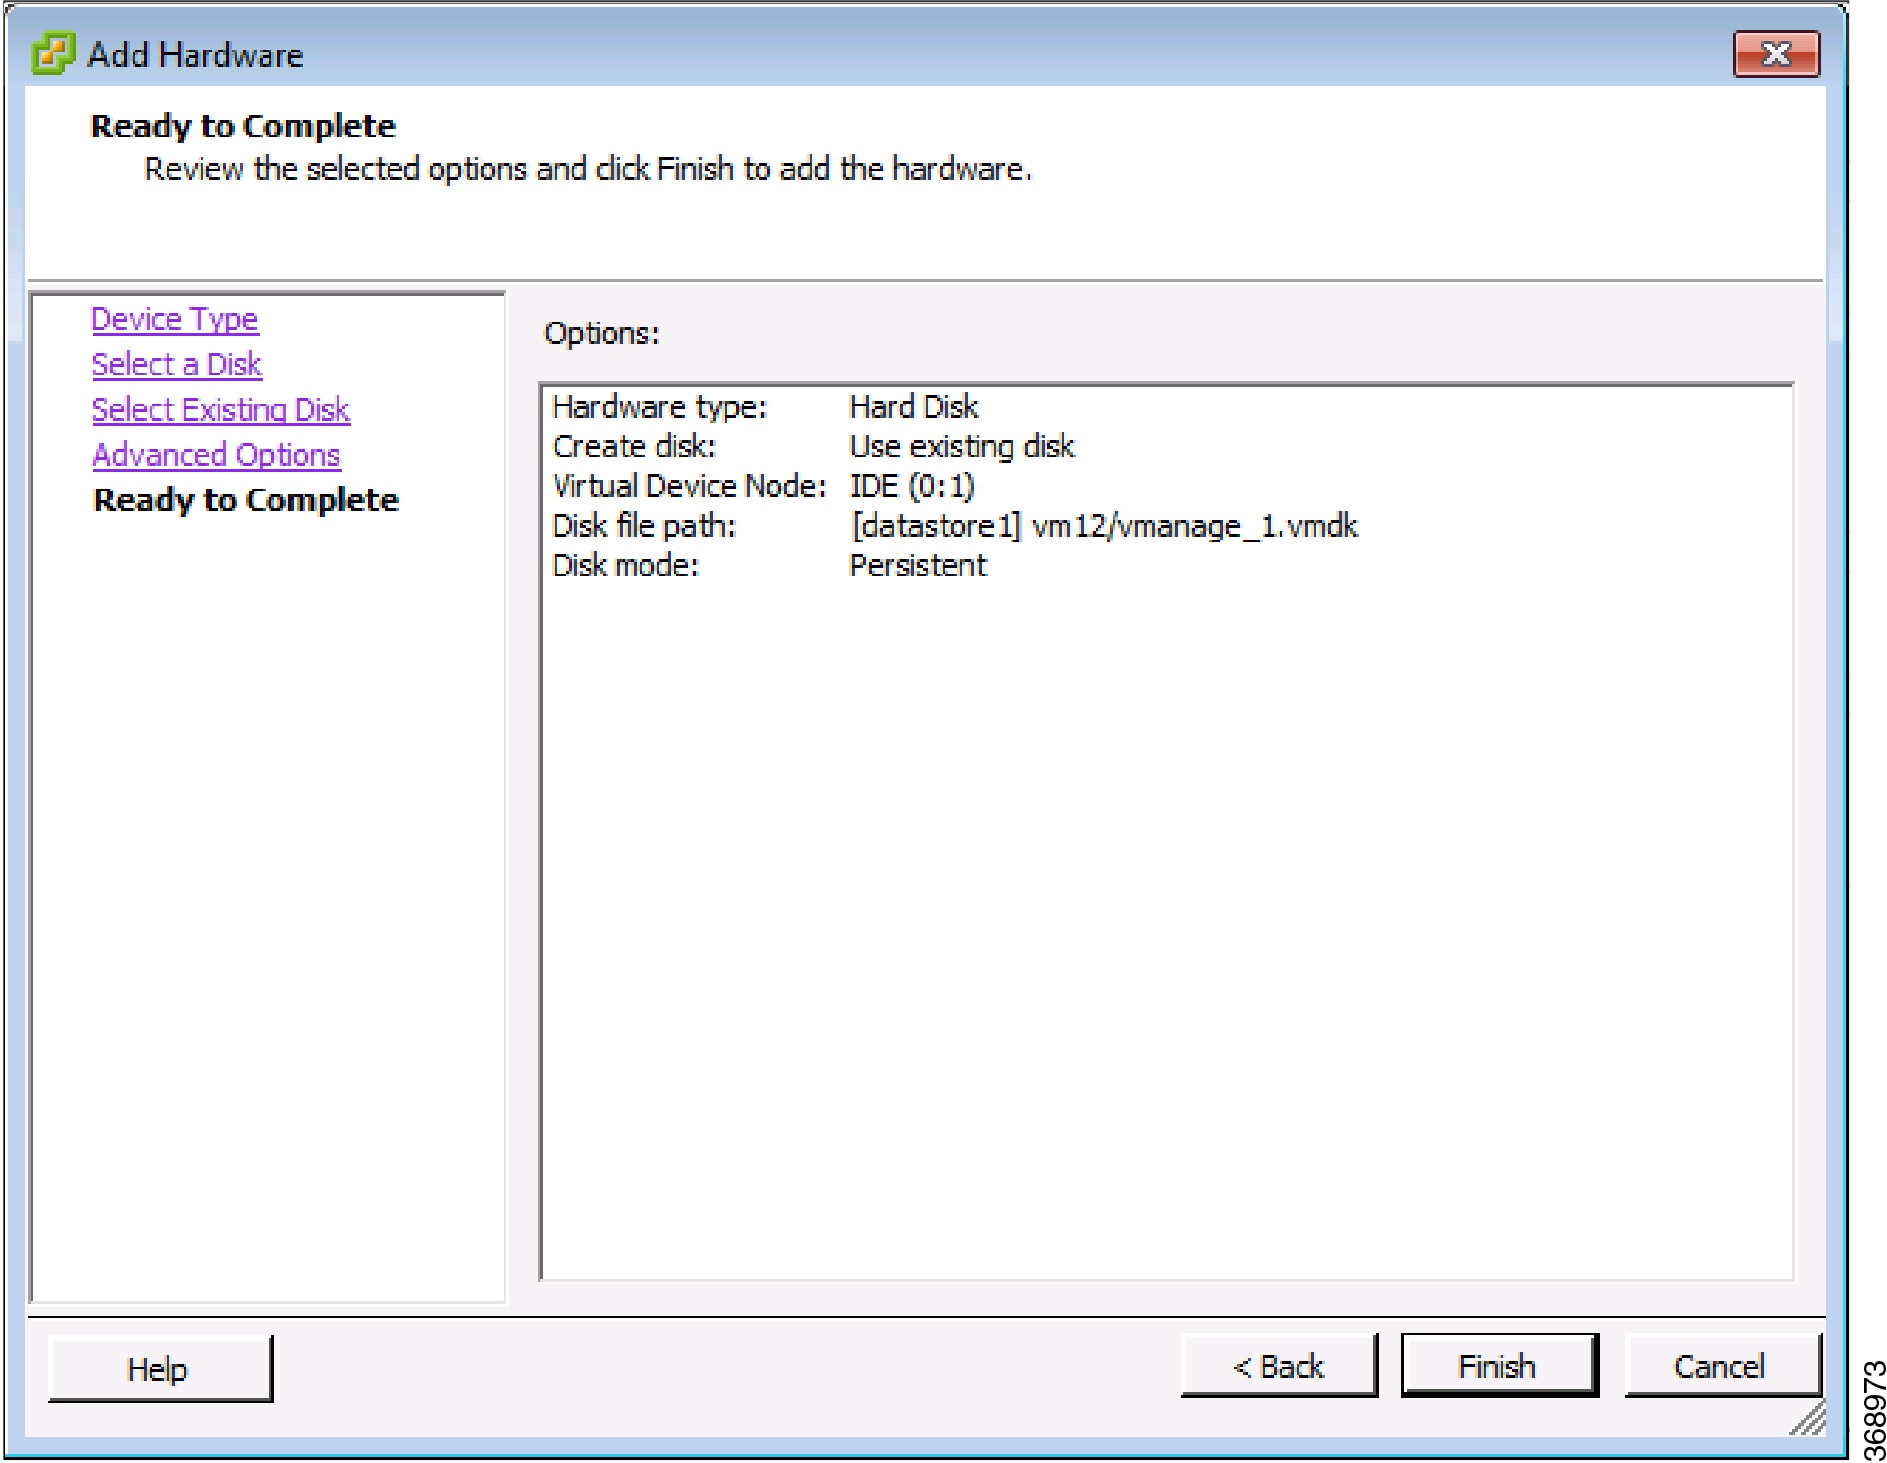
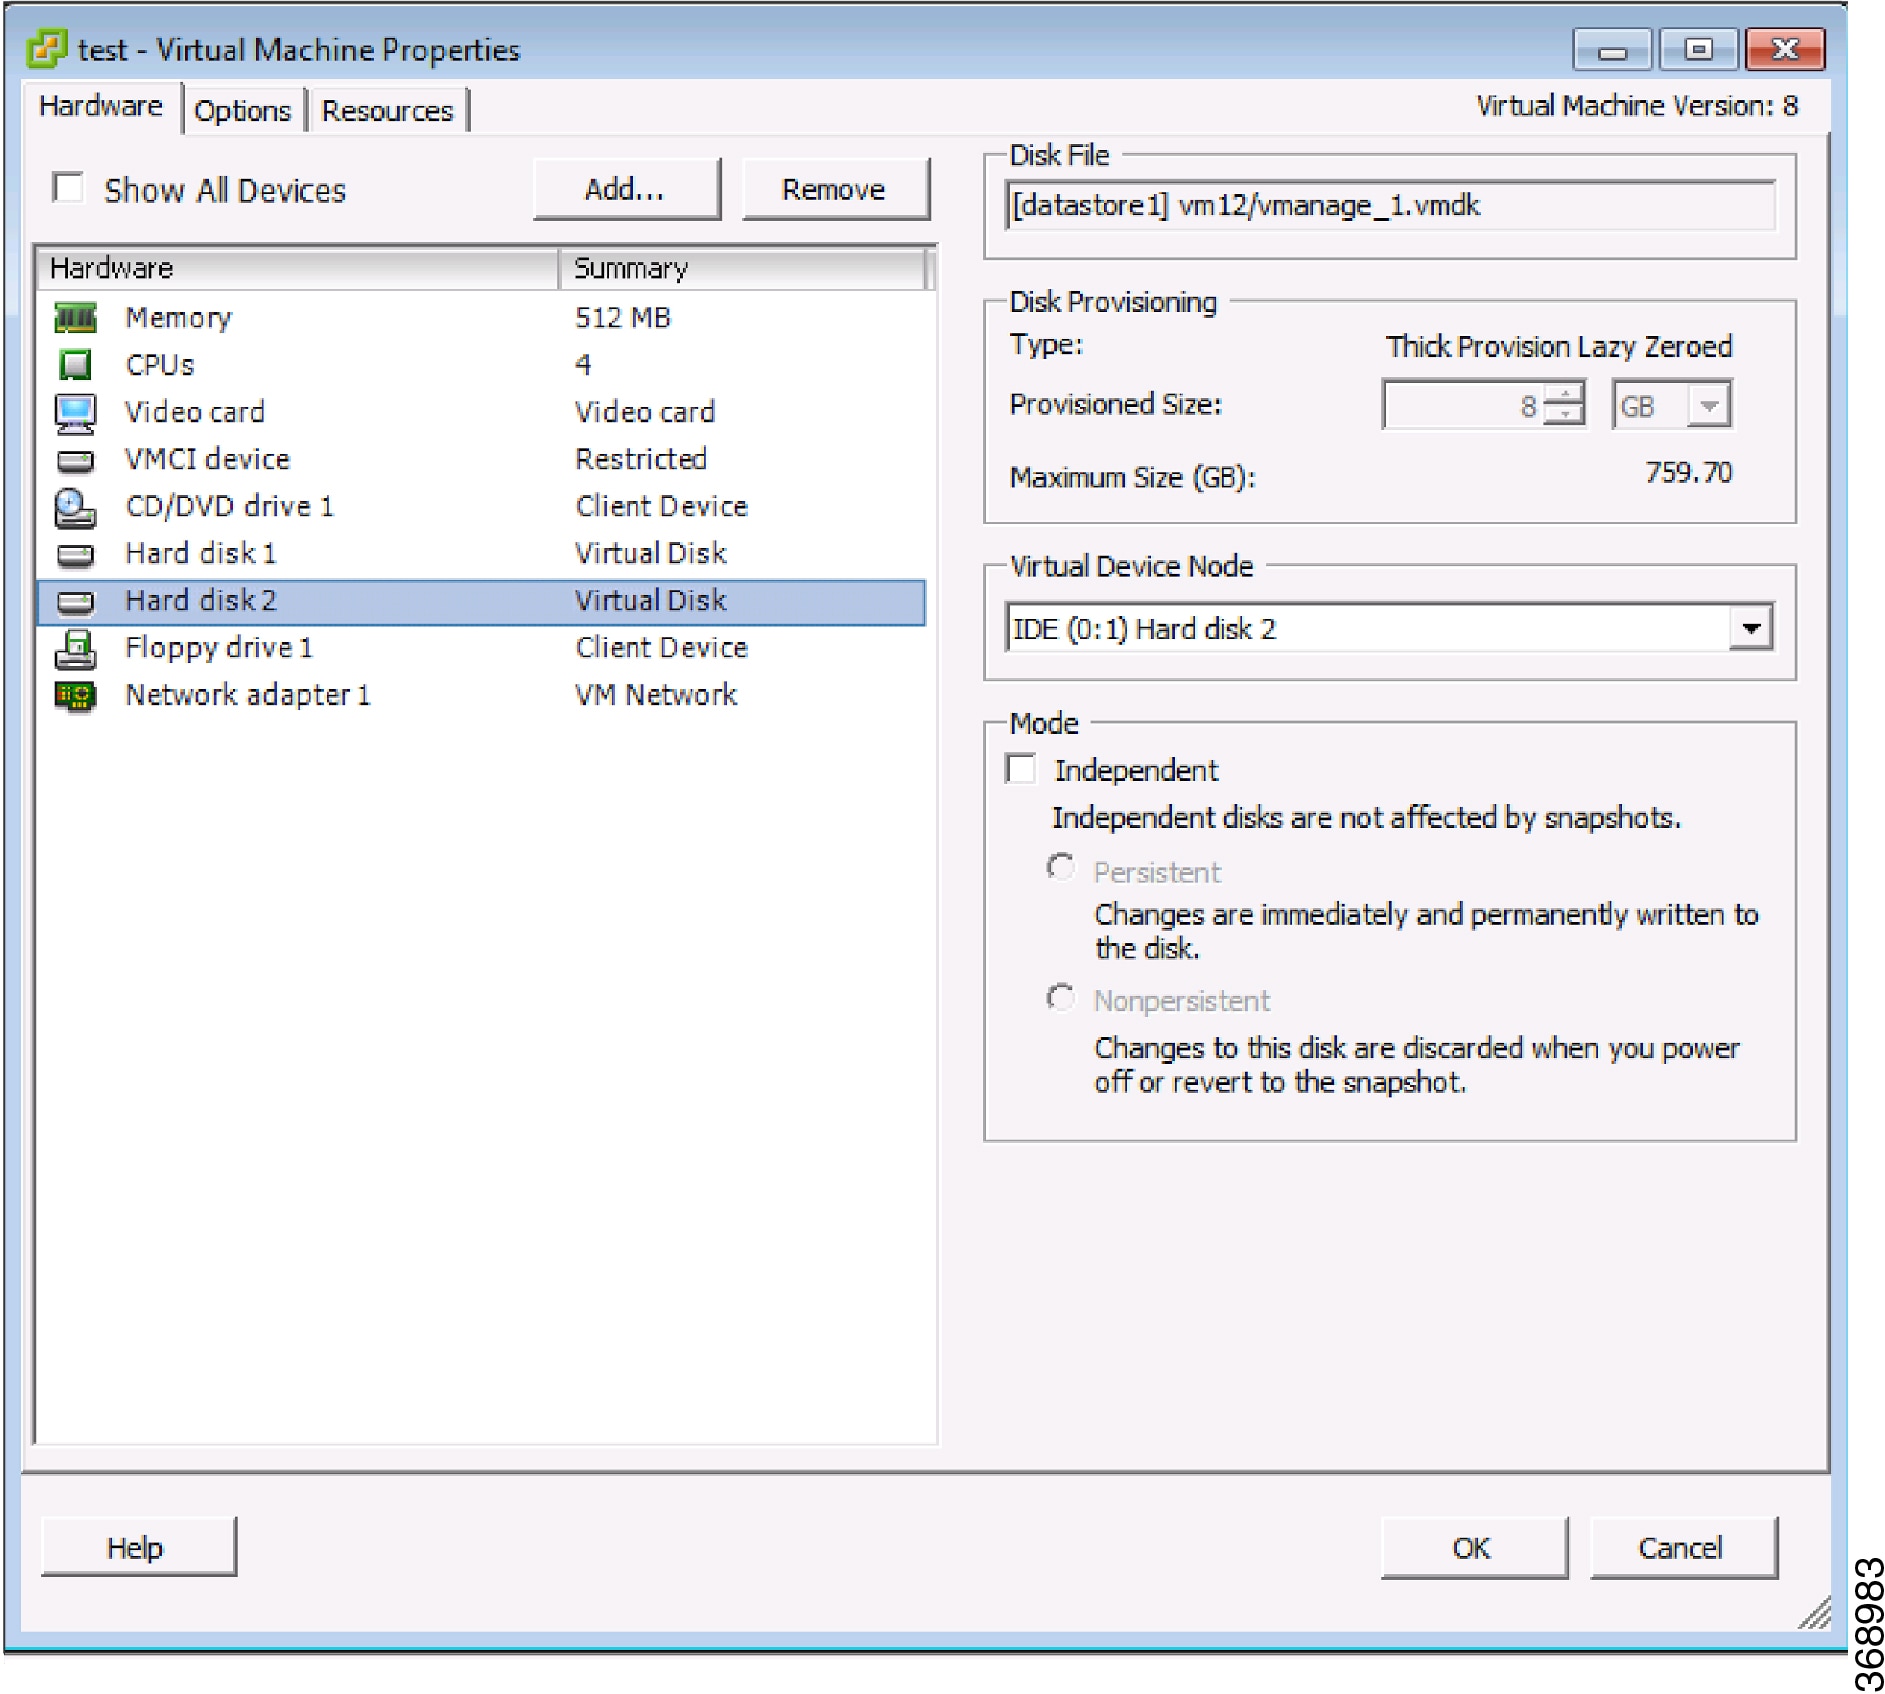
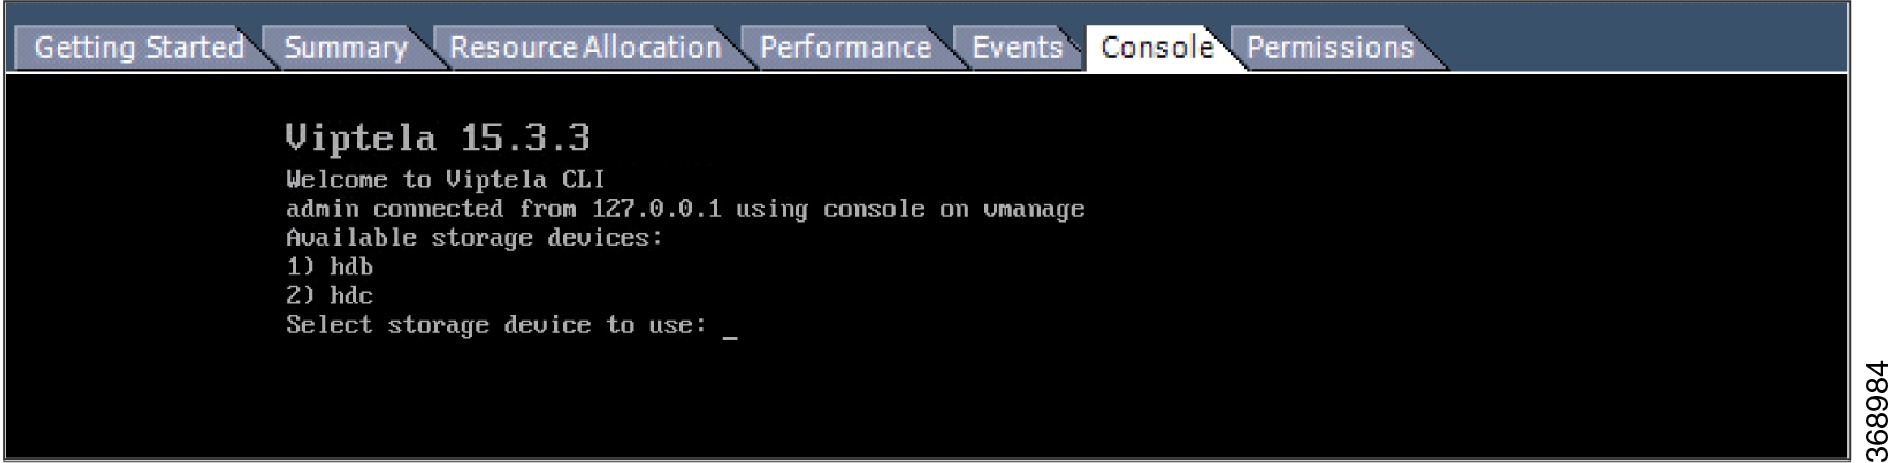
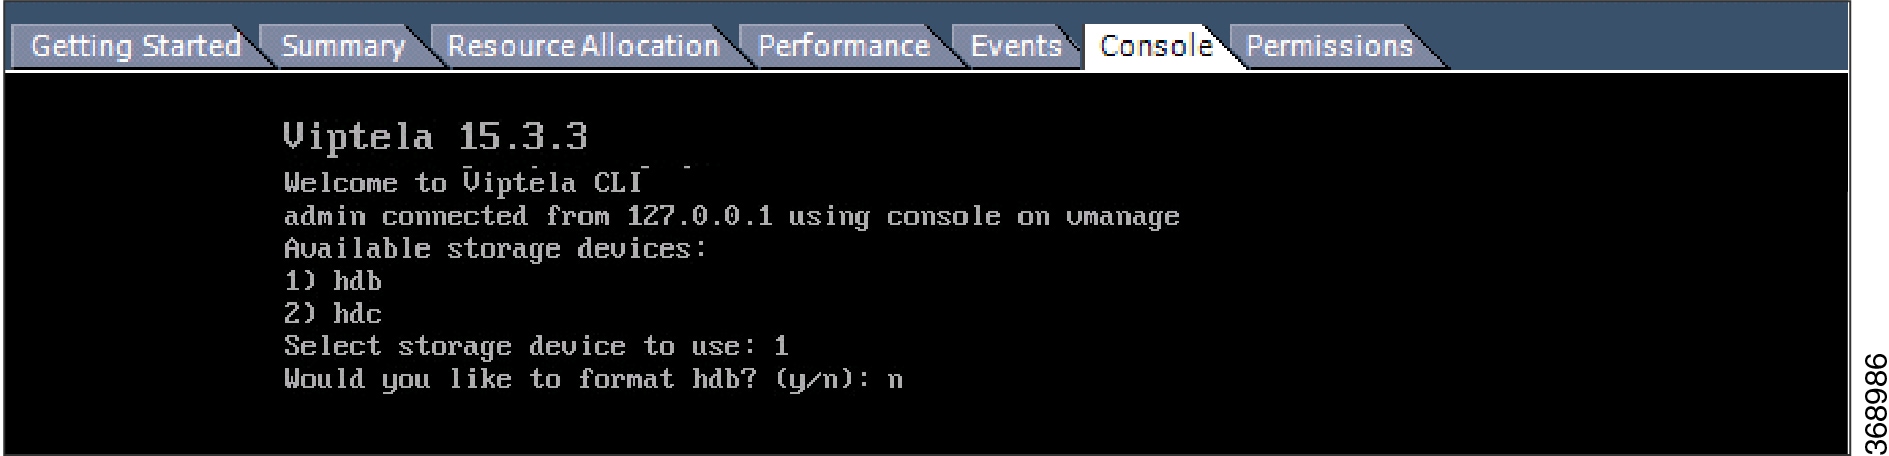
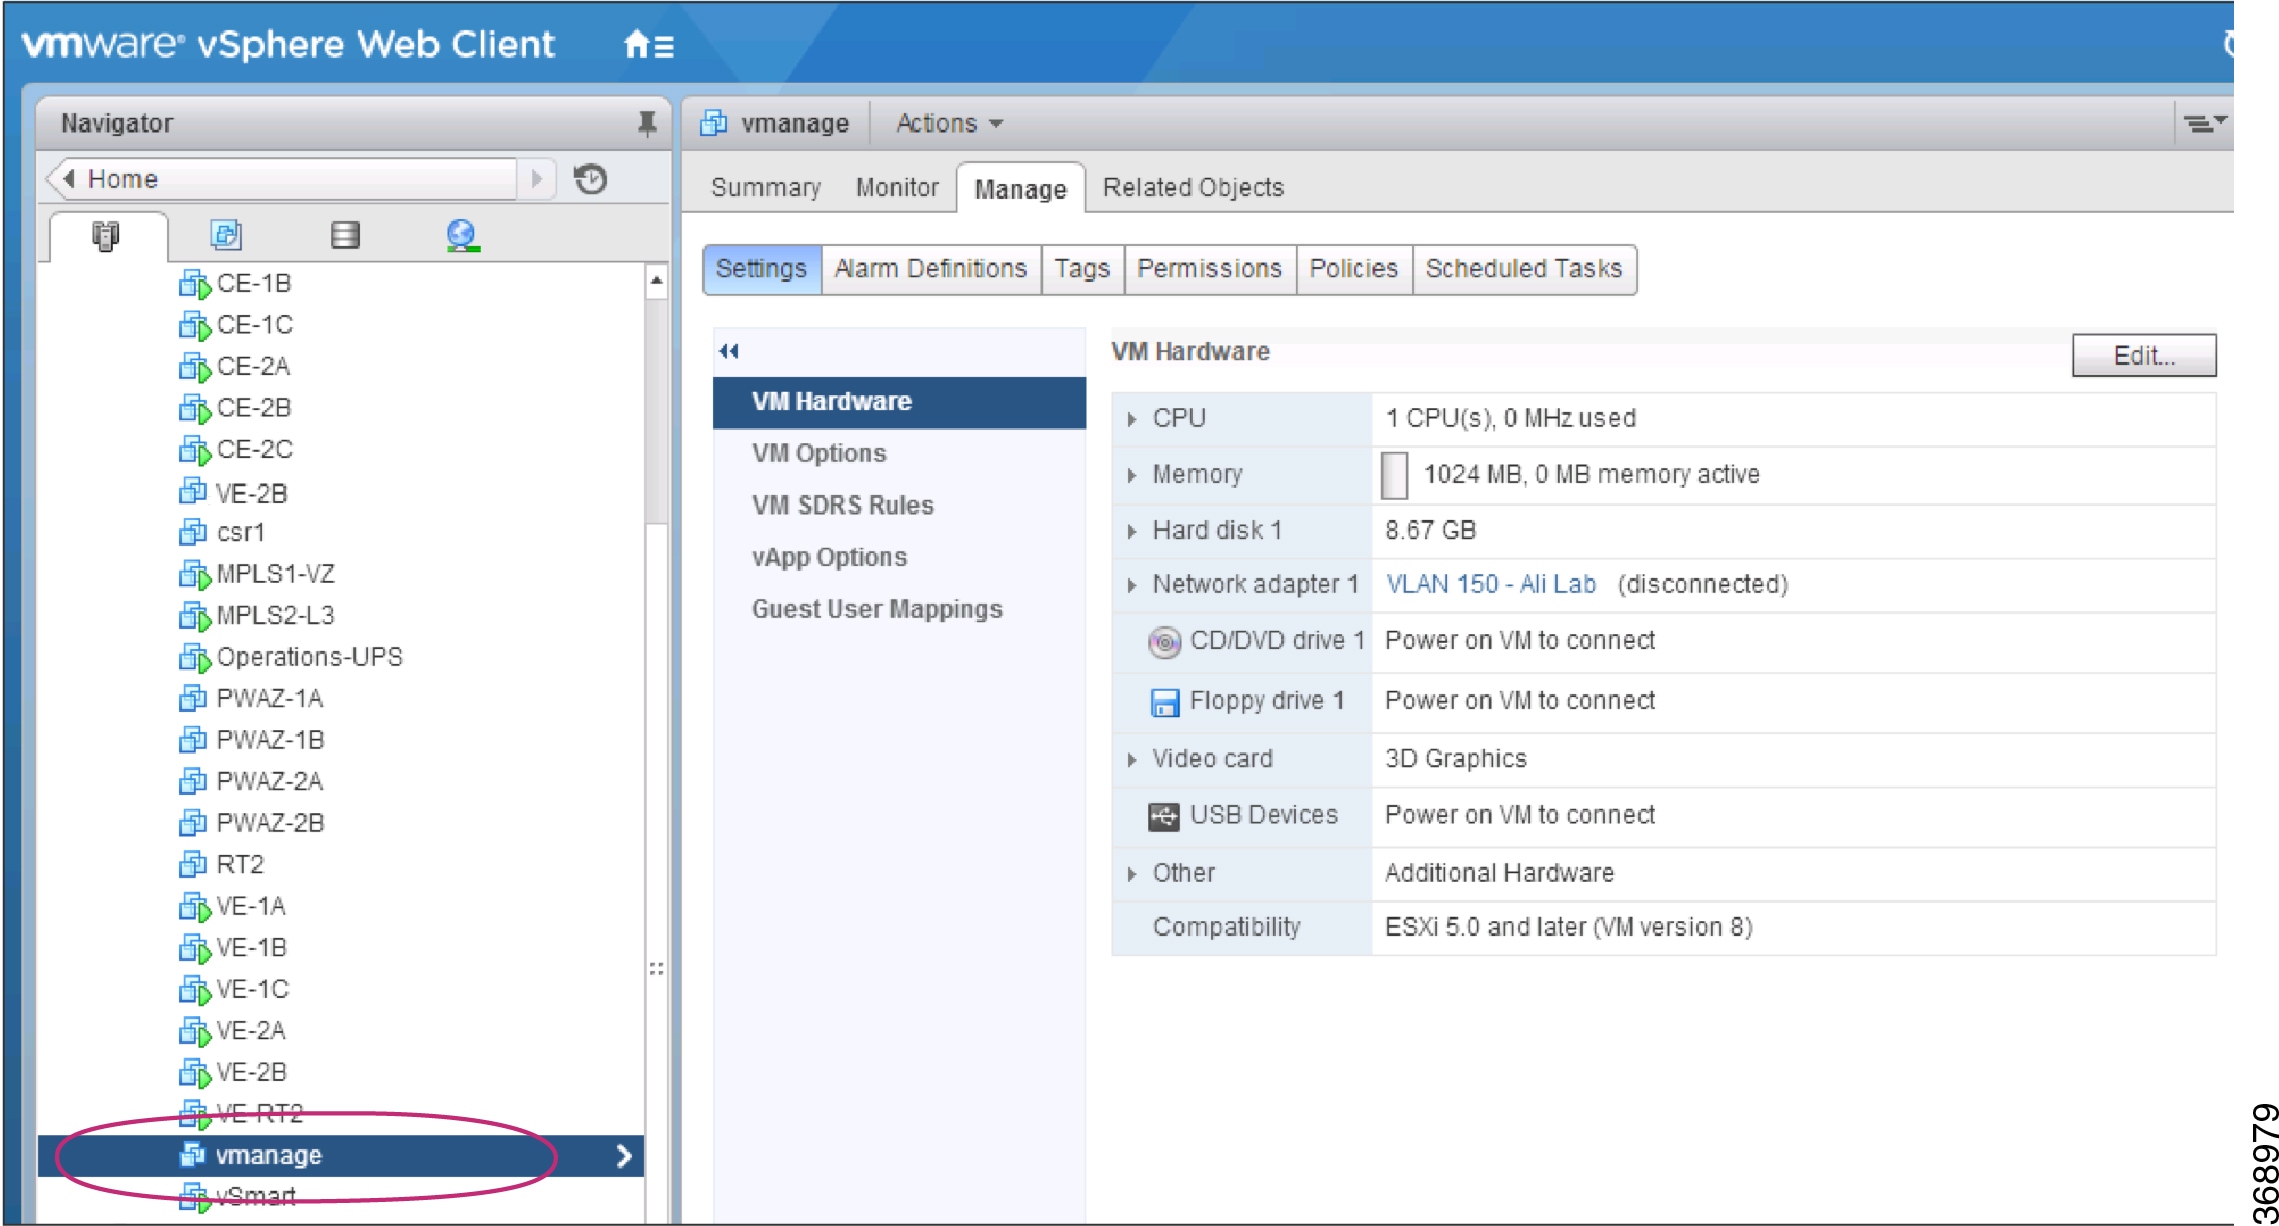
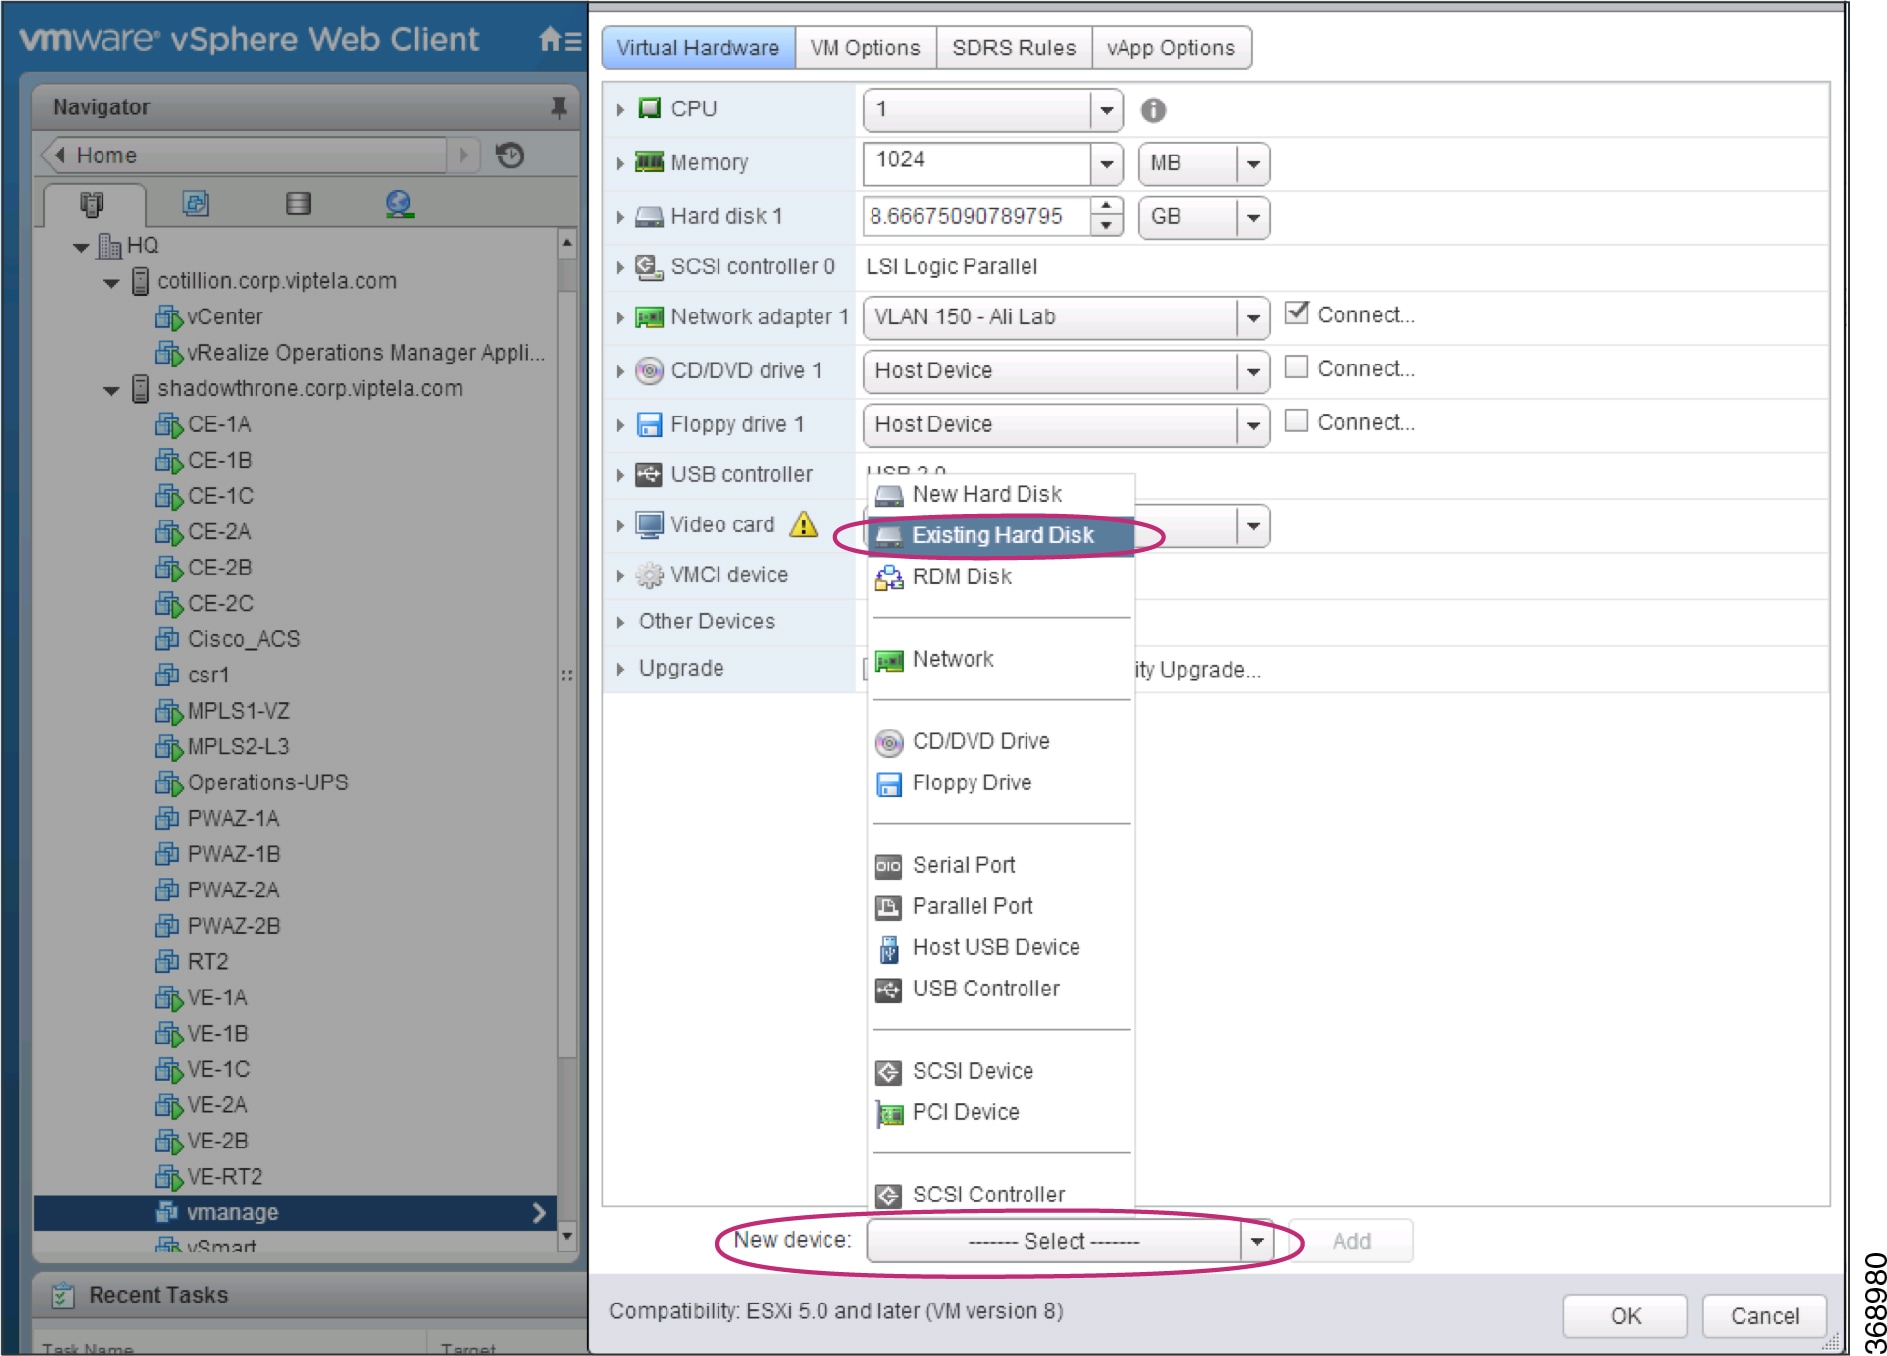
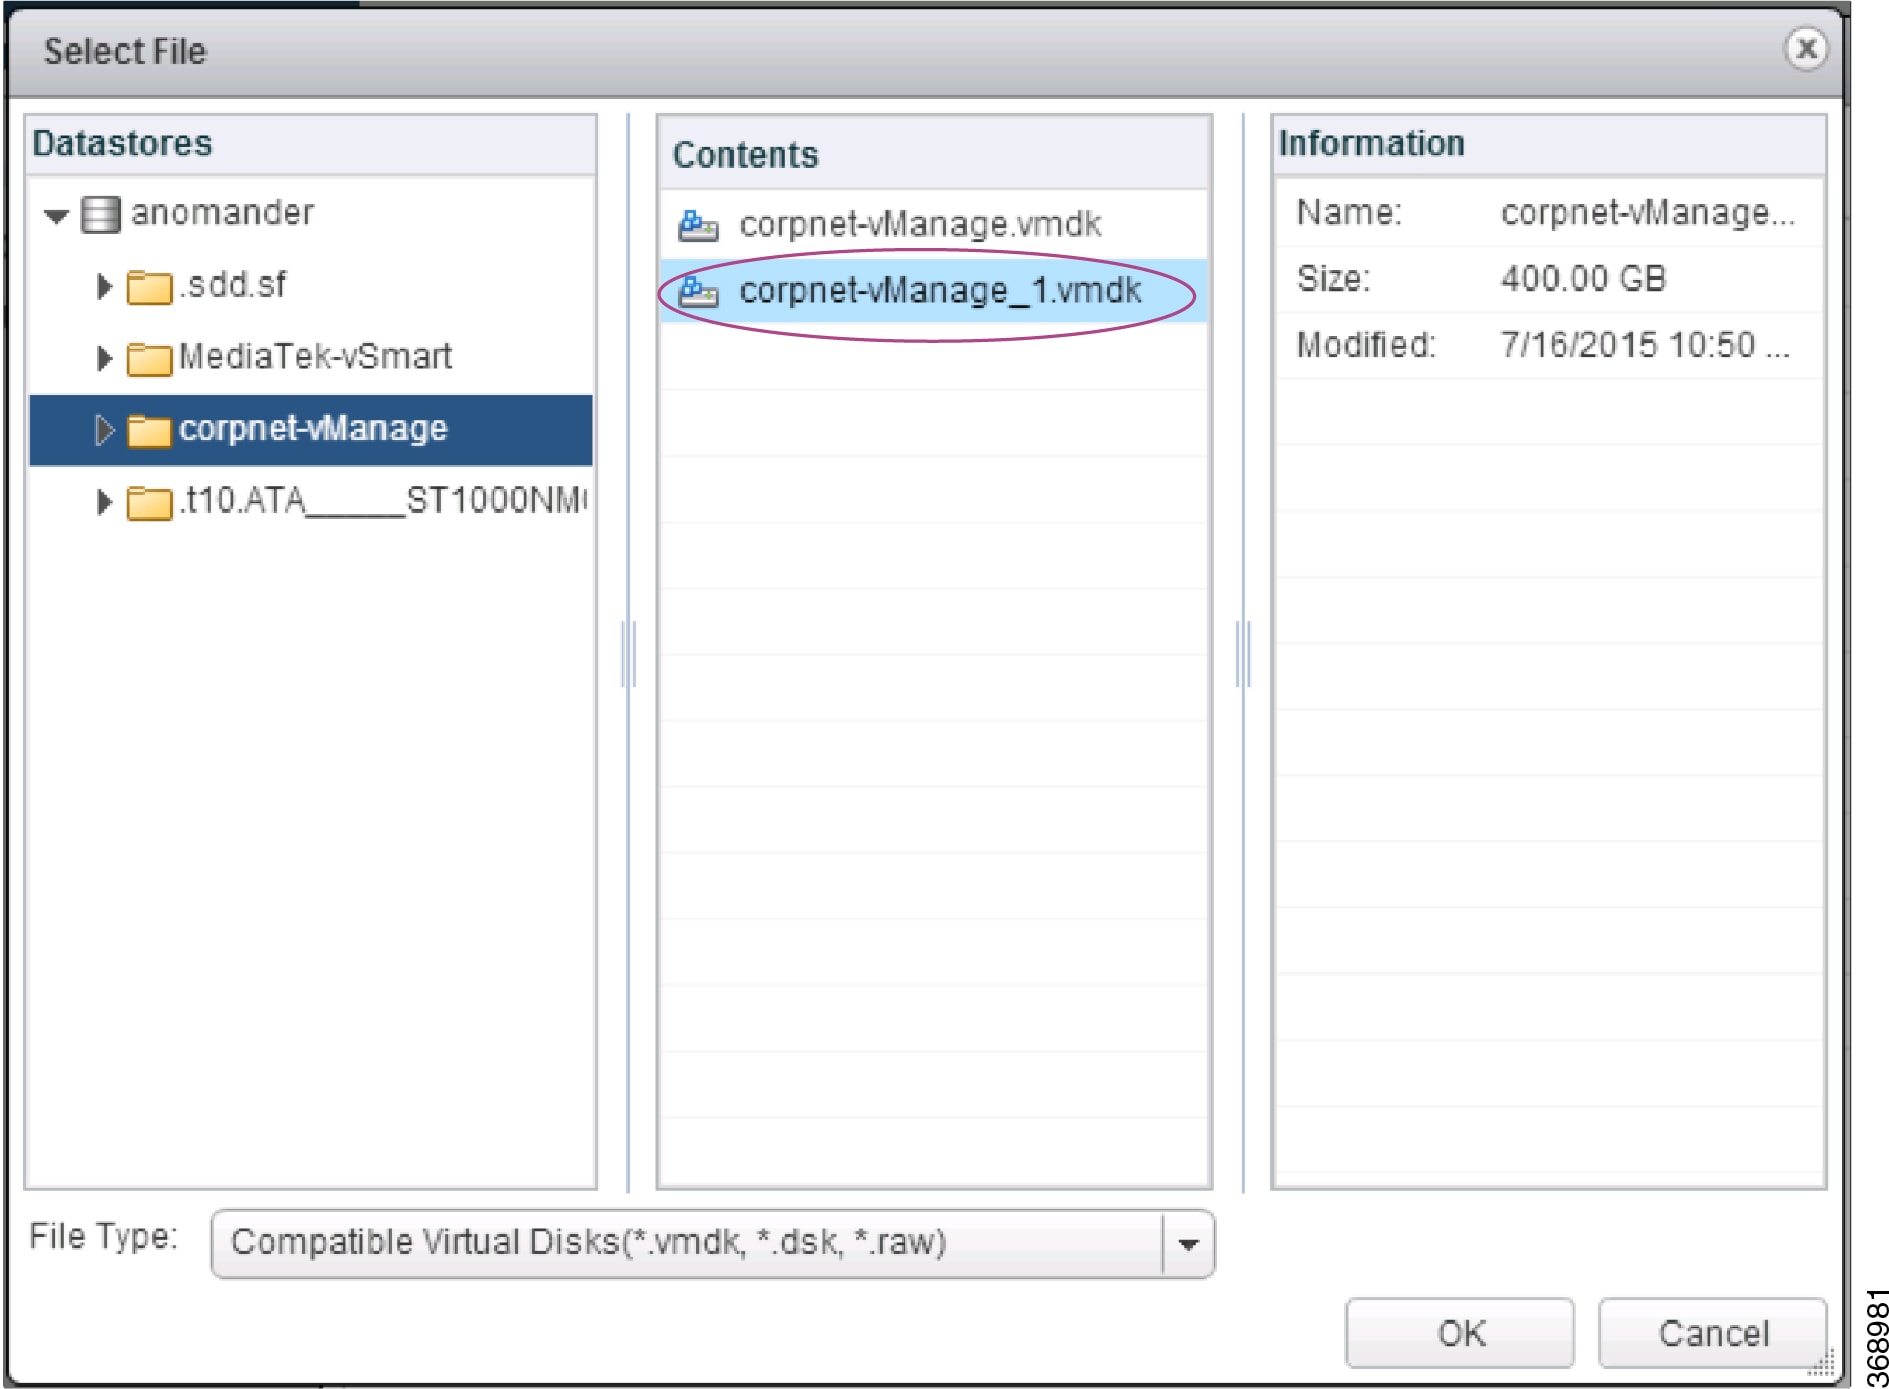
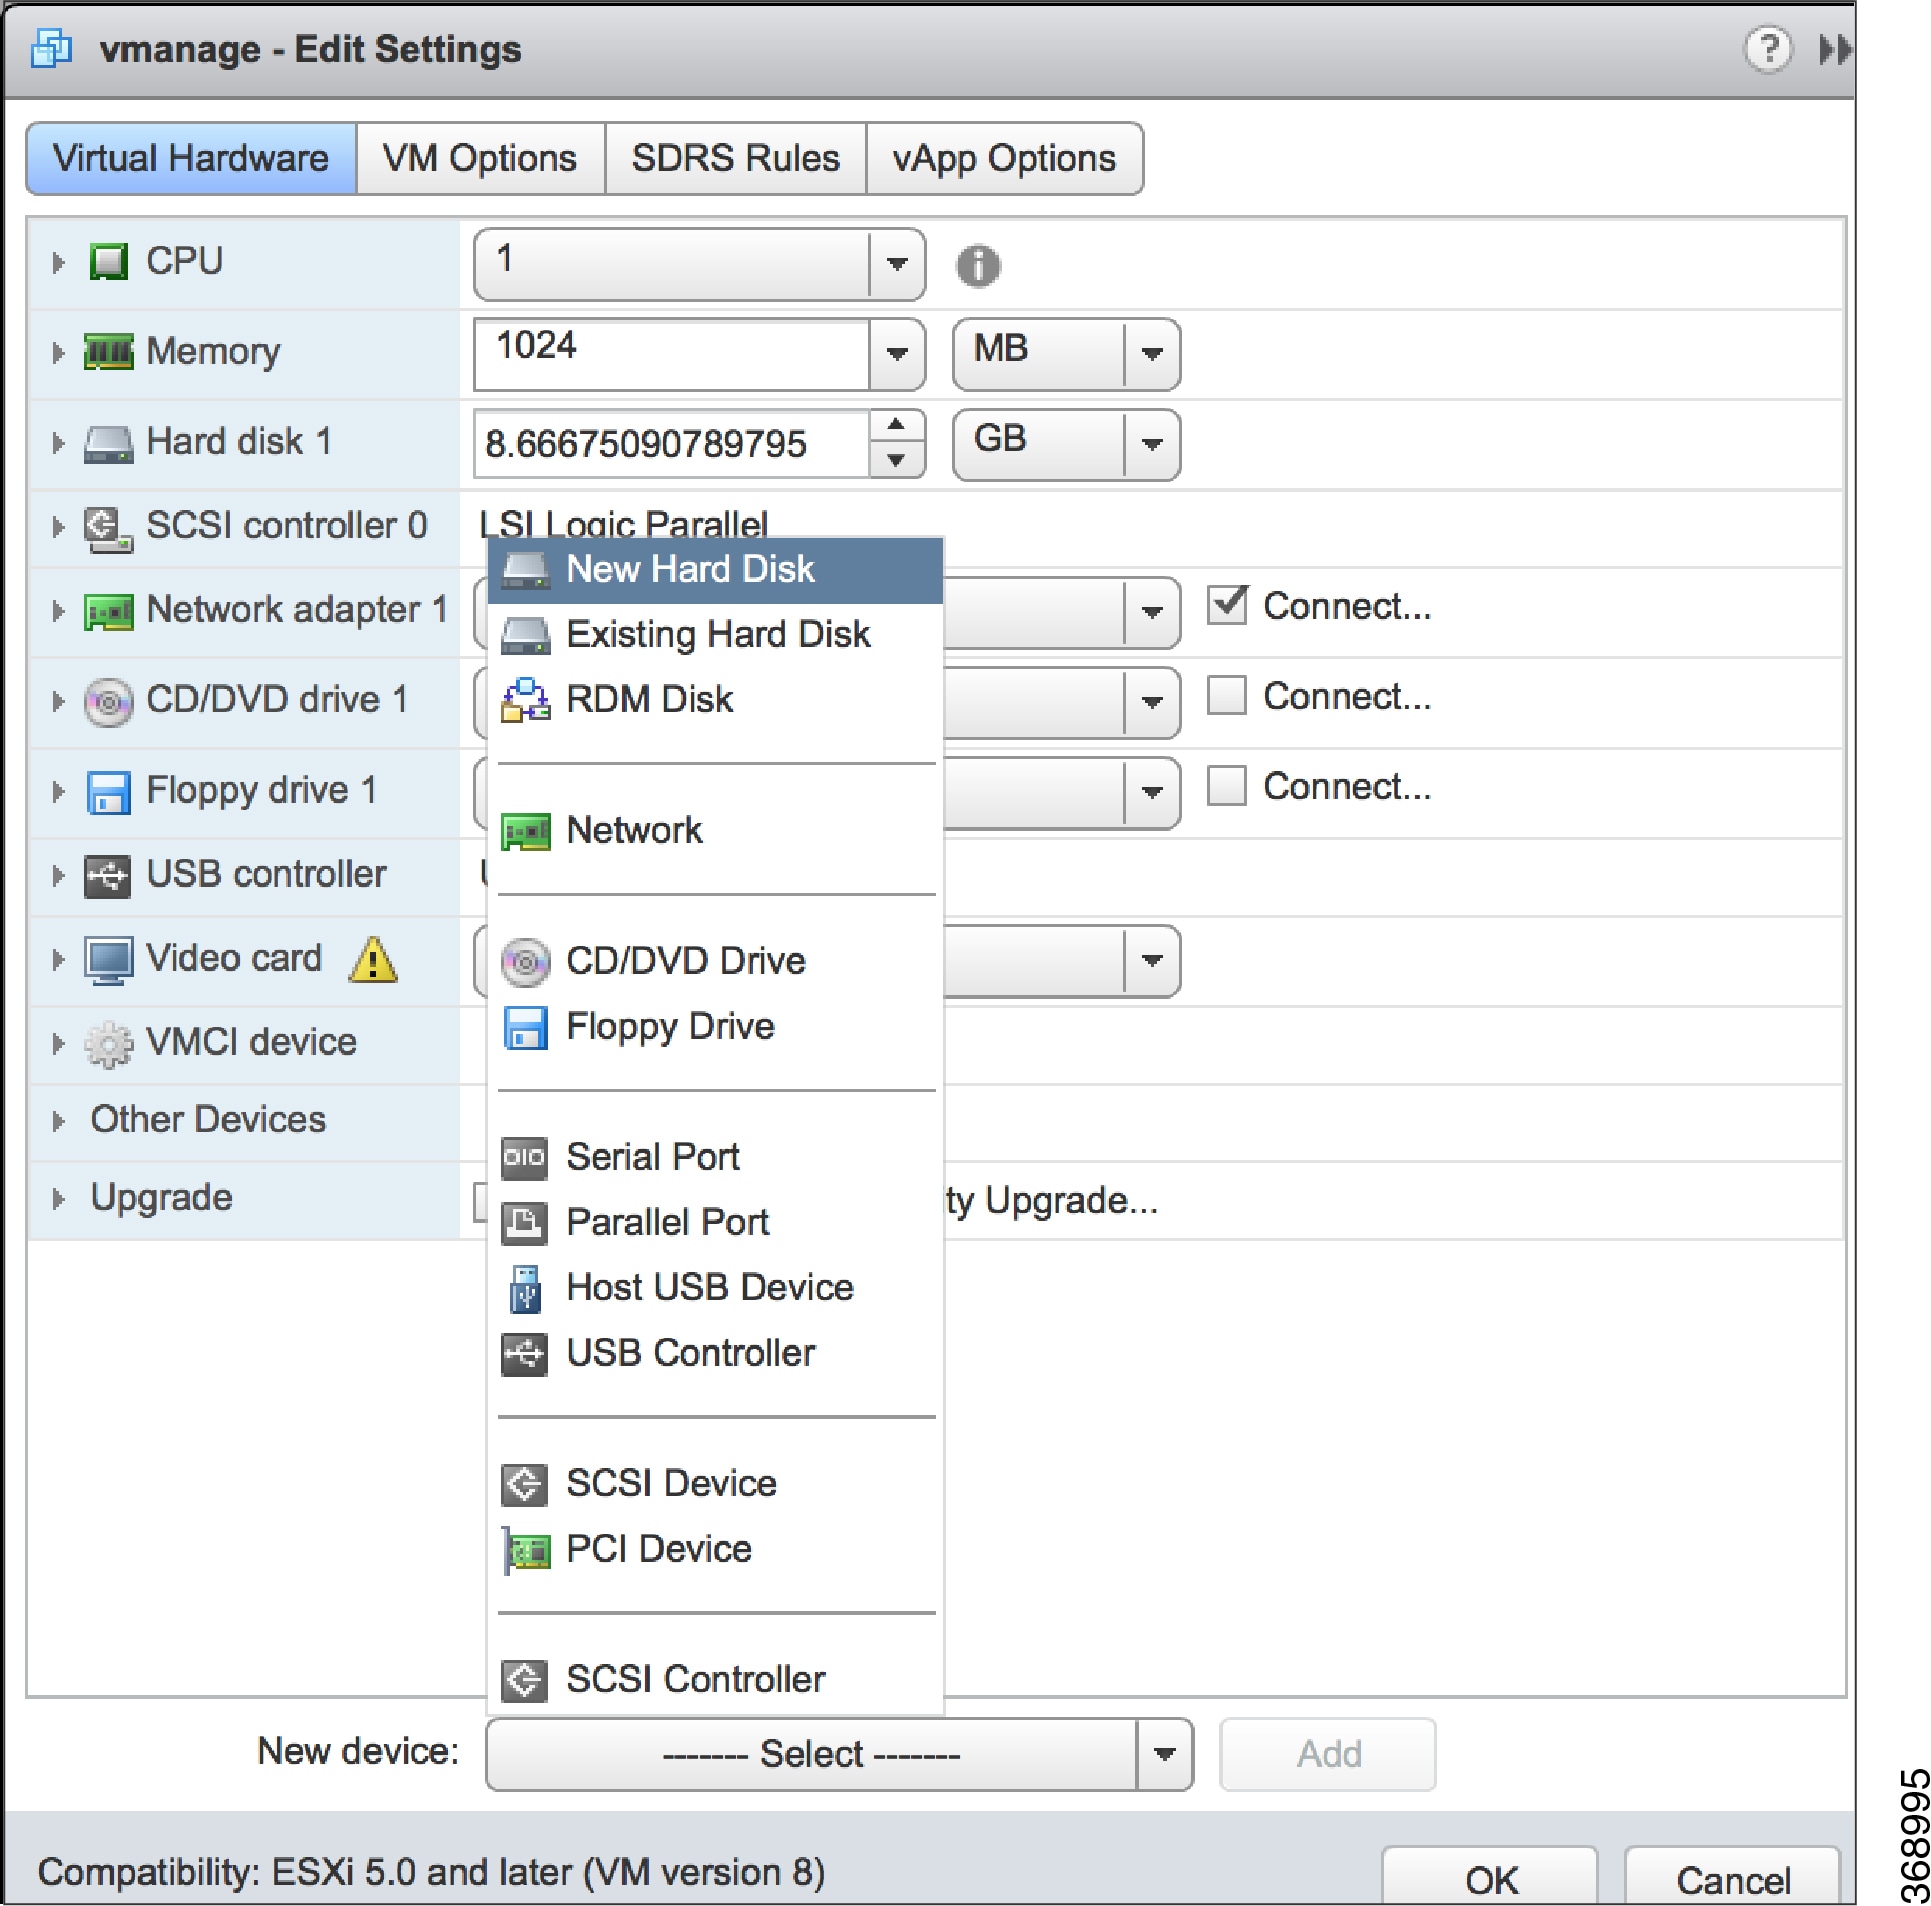
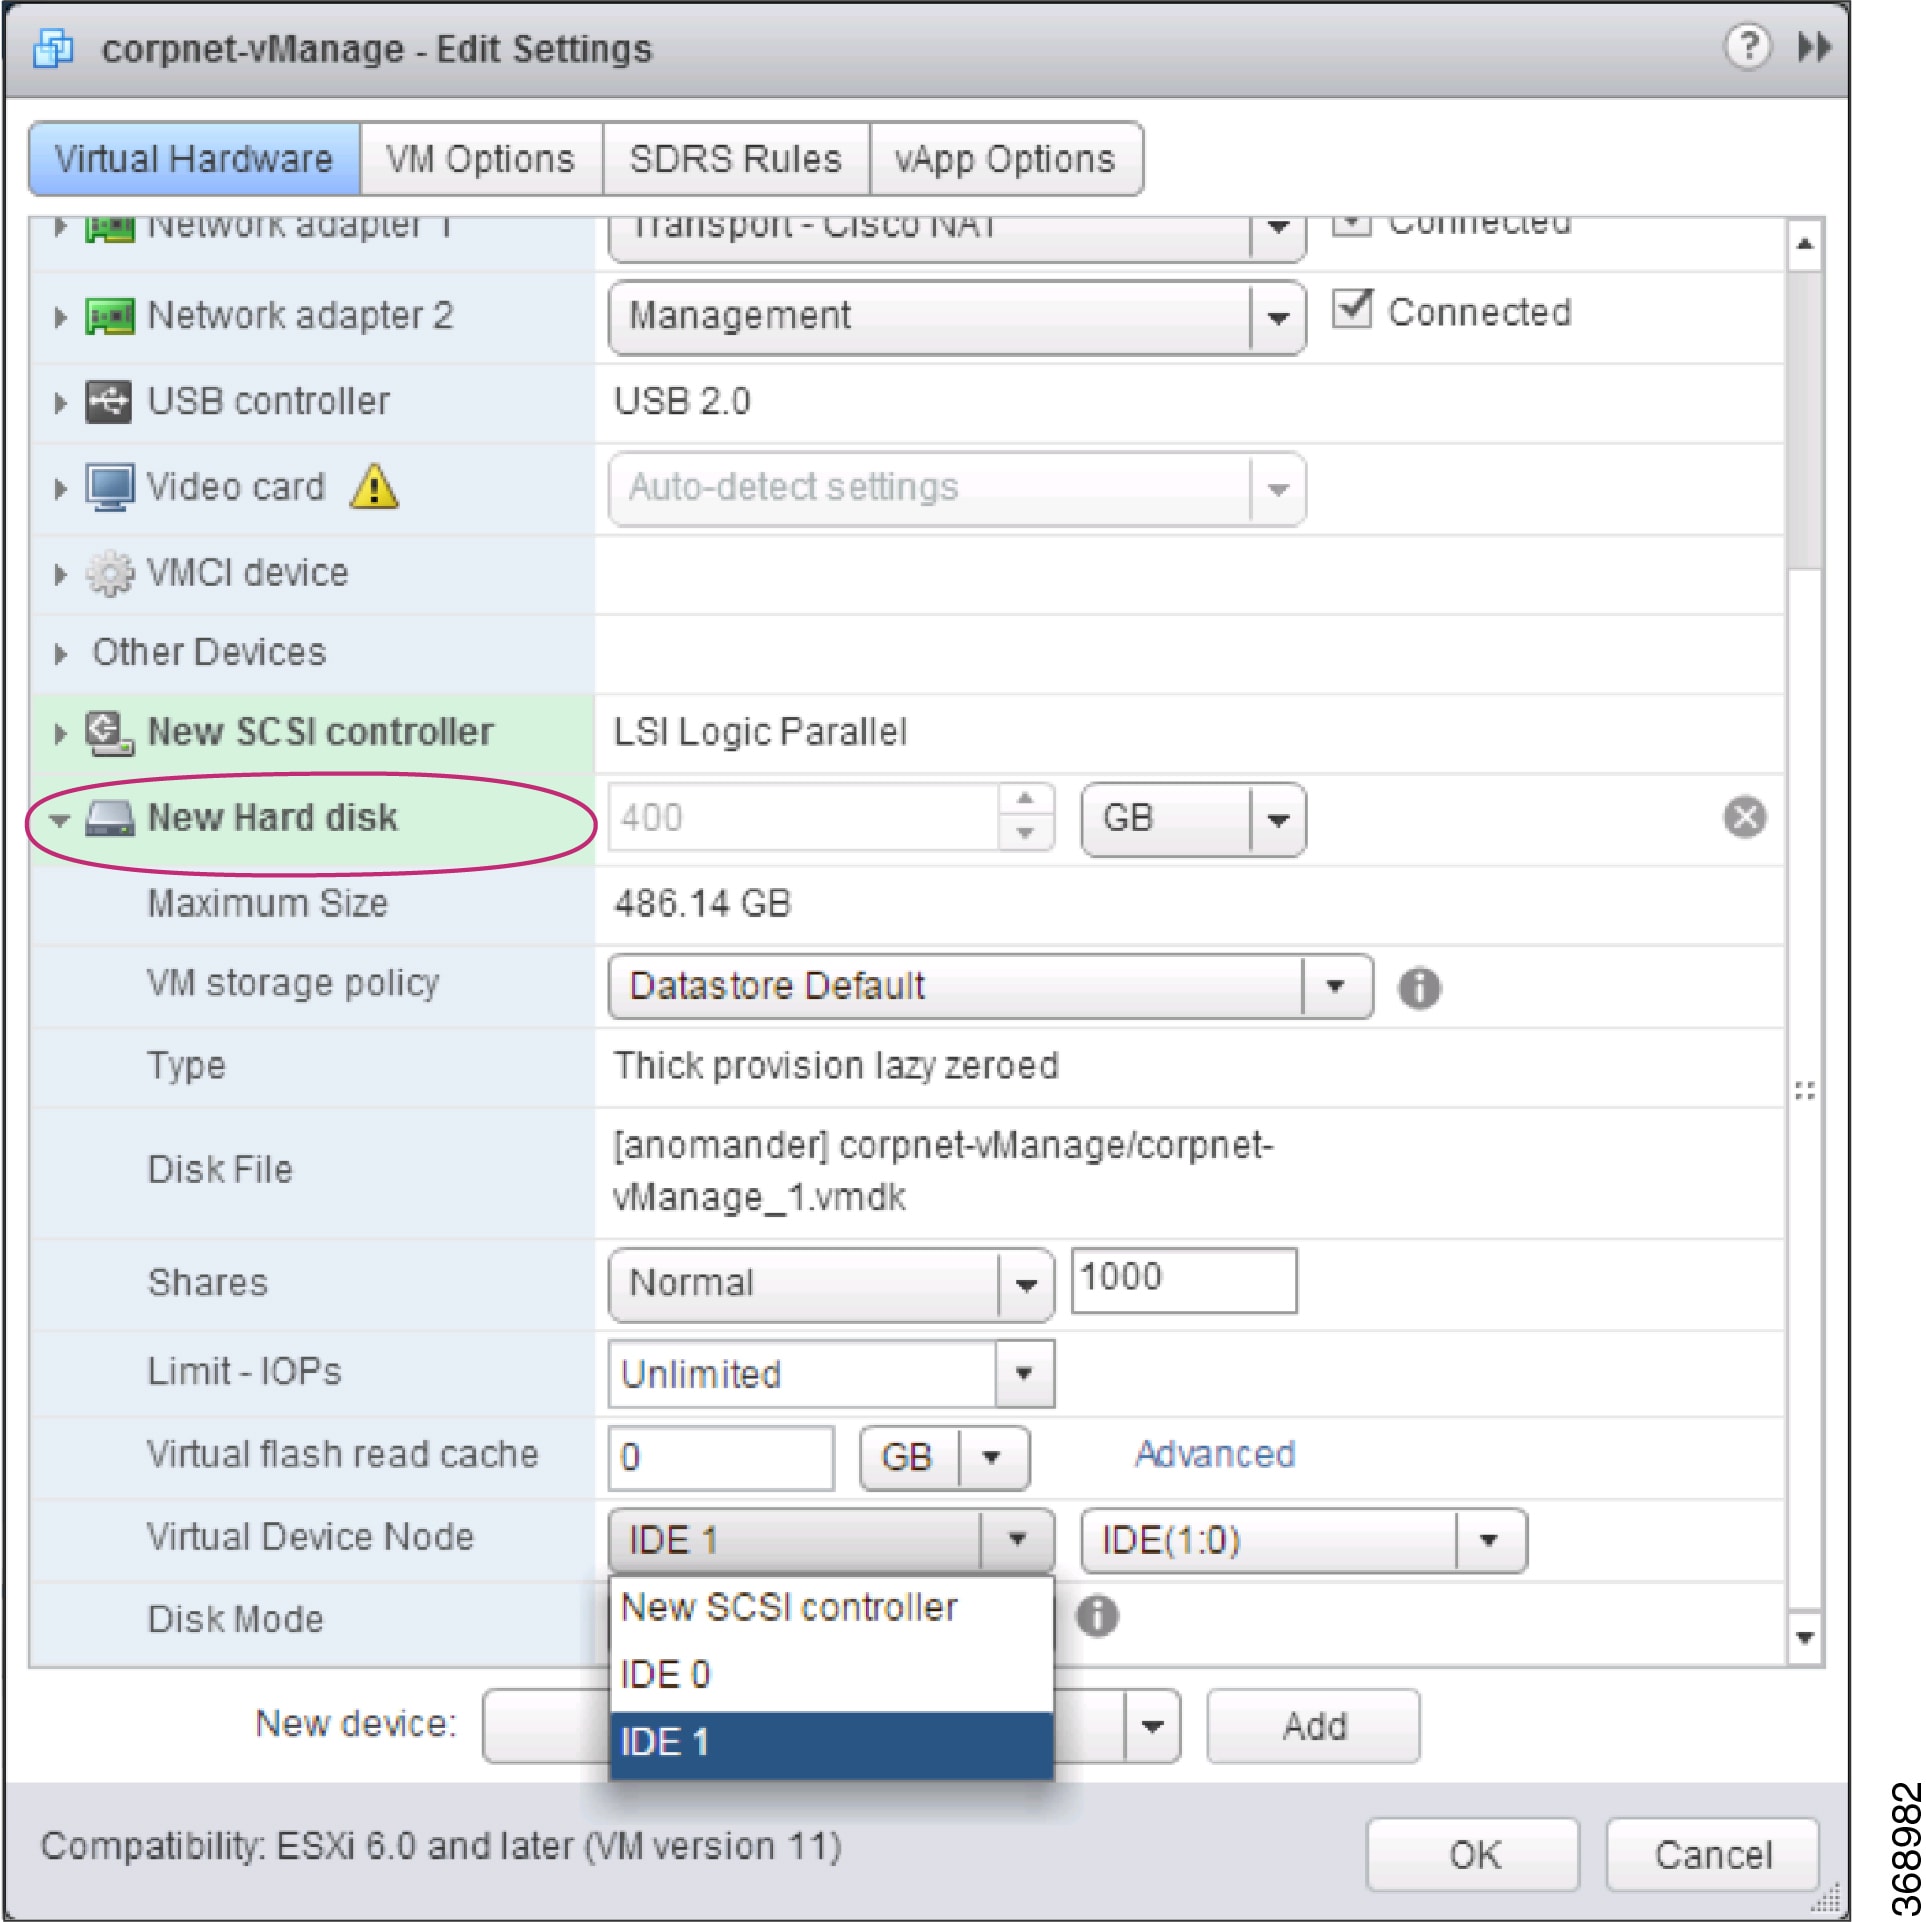
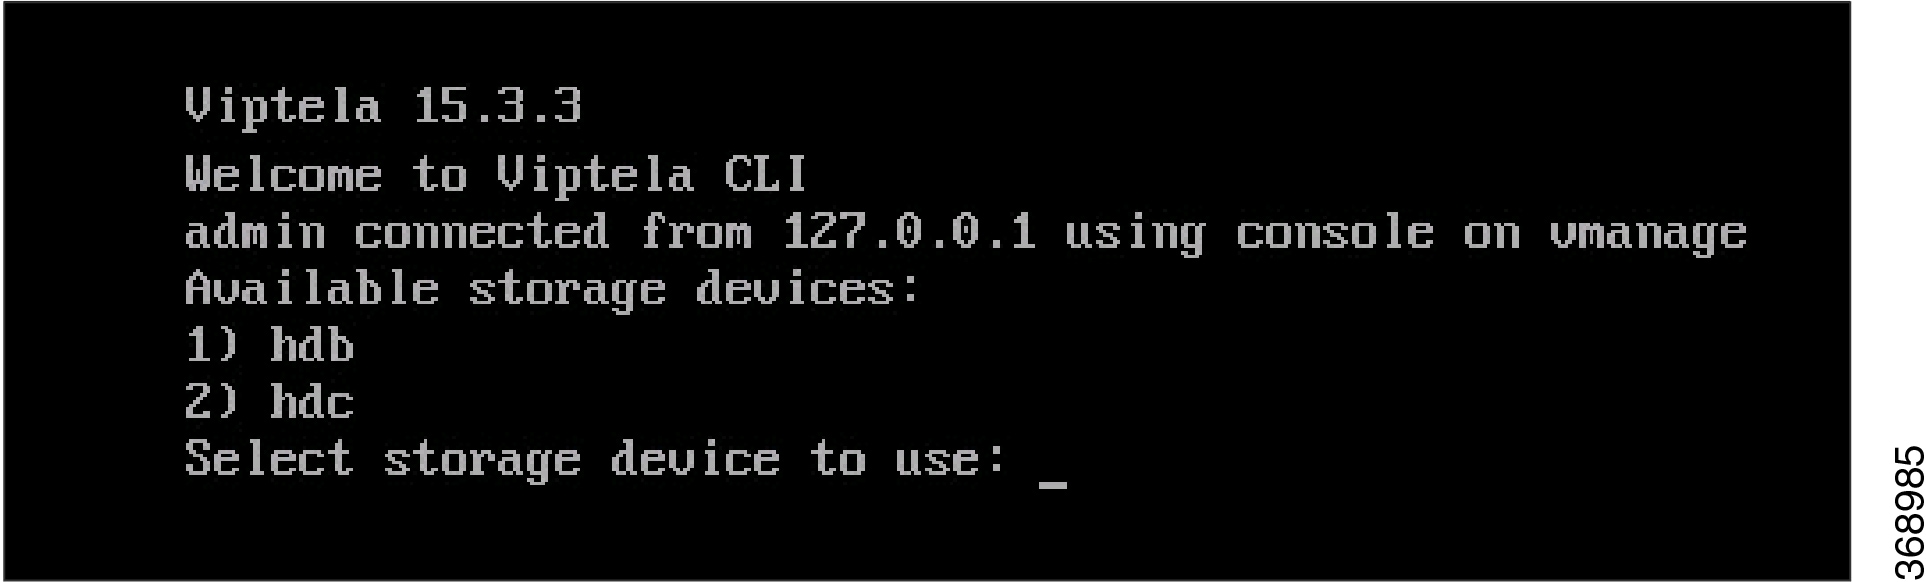
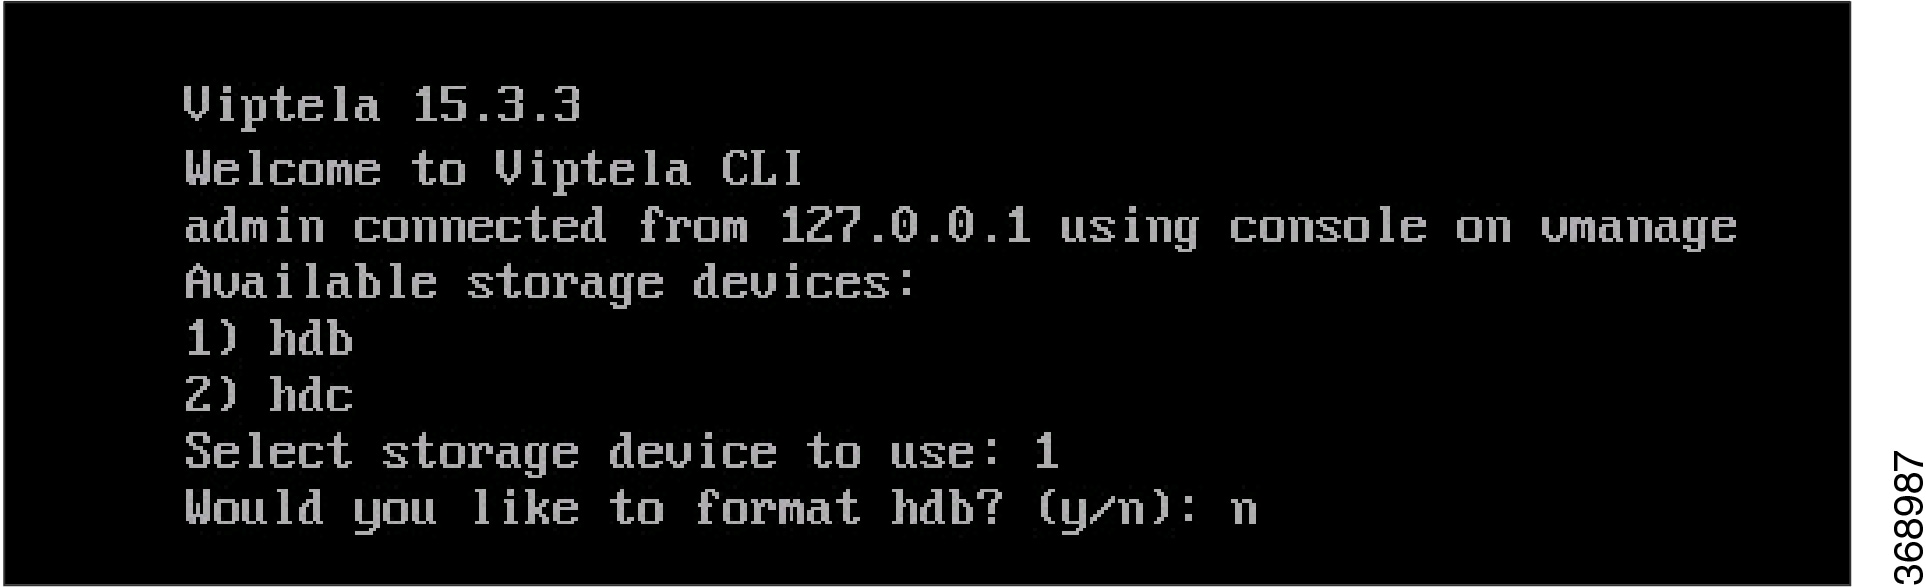
 Feedback