簡介
本檔案說明所有Uniform Resource Locator (URL)在4G網路上的使用者資料瀏覽問題。
必要條件
思科建議您瞭解以下節點的功能:
- 服務封包資料閘道(SPGW)
- 控制和使用者平面分離(CUPS)
症狀辨識

注意:在開始測試和日誌收集之前,您必須驗證這些詳細資訊。
1. 檢查問題出在哪種資料型別:IPv4/IPv6/IPv4v6
2. 檢查問題是否與任何特定「存取點名稱」(APN)或所有APN有關,因為問題可能與特定APN有關。
3. 檢查問題是否針對特定的Web URL或多個URL。
4. 檢查URL是企業URL/客戶應用URL還是某些常規服務URL,同時檢查問題是否與特定VPN有關。
5. 檢查直接從瀏覽器訪問URL時或訪問Web應用時是否出現問題。
6. 檢查問題本質上是間歇性的(例如手機重新啟動後或重新整理Web URL開始工作),還是問題一致,即使手機重新啟動後也不起作用。
7. 檢查觀察到的拒絕原因以及針對哪個評級組。
日誌收集/測試
注意:對於此類問題,您必須對有問題的使用者IMSI執行即時線上故障排除,然後才能相應地收集日誌/跟蹤。
繼續測試和日誌收集之前:
Flush the subscriber from the node and also clear browsing history/database from testing user handset so that it can freshly attach

clear subscriber imsi <IMSI number>  ------------------ to be executed in the node to clear the subscriber
- 首先測試一種PDP型別(例如IPv4),您會看到問題。
- 啟用這些調試日誌並記錄putty會話。確保會話不能終止(按tab鍵/每隔幾分鐘輸入一次,這樣會話就不會終止)。
On SPGW:
logging filter active facility sessmgr level debug
logging filter active facility acsmgr level debug
logging filter active facility npumgr-acl level debug
logging filter active facility firewall level debug
logging filter active facility vpn level debug
logging filter active facility vpnmgr level debug
logging active   ---------------- to enable the logging

after 5 mins
no logging active ---------------- to disable the logging

On CP:
logging filter active facility sessmgr level debug
logging filter active facility sxdemux level debug
logging filter active facility firewall level debug
logging filter active facility vpn level debug
logging filter active facility vpnmgr level debug
logging active ---------------- to enable the logging

after 5 mins
no logging active ---------------- to disable the logging

On UP:
logging filter active facility sessmgr level debug
logging filter active facility sxdemux level debug
logging filter active facility npumgr-acl level debug
logging filter active facility firewall level debug
logging filter active facility vpn level debug
logging filter active facility vpnmgr level debug
logging active ---------------- to enable the logging
no logging active ---------------- to disable the logging

Note :: These logging has to be enabled for short time depending on the CPU utilization because it
increase the utilization so while enabling logging need to keep a watch on CPU
3. 切換作業選項至組態模式,然後啟用訂戶的記錄日誌監視器。
config
logging monitor msid <imsi>
end
4. 打開另一台終端,記錄putty會話,然後使用詳細程度5啟動監控使用者並啟用以下選項:
SPGW:
Press + for times then it collects the logs verbosity 5 logs then select next options
+++++
X, A, Y, 19, 33, 34, 35, 22, 26, 75
Once option 75 is pressed then select 3,4,8 then press esc

CUPS::
on CP:
monitor subscriber imsi <IMSI> +++++        S, X,A,Y,56,26,33,34,19,37,35,88,89
on UP:
monitor subscriber imsi <IMSI> +++++        S,X,A,Y,56,26,33,34,19,37,35,88,89
5. 連線訂戶並連續瀏覽URL 3到5分鐘,瀏覽時多次執行這些命令並記錄putty會話。
ON SPGW/SAEGW:
show subscriber full imsi <>
show active-charging session full imsi <>
show subscriber pgw-only full imsi <>
show subscriber sgw-only full imsi <>
show subscribers data-rate summary imsi <>
show ims-authorization sessions full imsi <>
show subscribers debug-info msid <>

On CP node:
Show subscriber full imsi <imsi>
Show active-charging session full imsi <imsi>
show subscribers pgw-only full imsi <>
show subscribers sgw-only full imsi <>
show session subsystem facility sessmgr instance <> verbose
show logs

On UP node:
show sub user-plane-only full callid  <>
show sub user-plane-only callid <> urr full all
show sub user-plane-only callid <> far full all
show sub user-plane-only callid <> pdr full all
show subscribers user-plane-only callid <> far all
show subscribers user-plane-only callid <> far
show subs data-rate call <callid>
show subscribers user-plane-only flows
show user-plane-service statistics all
show user-plane-service statistic rulebase name <rulebase_name>
6. 瀏覽5分鐘後,在步驟3中打開的另一台終端中執行no logging active。
7. 停用訂戶的記錄監視器。
Config
no logging monitor msid <imsi>
end
8. 在您完成收集數字蹤跡之前,請勿停止mon sub並使其運行,但請密切關注CPU。
9. 執行此命令以獲取訂戶的呼叫方id,並記錄此使用者的putty會話。
Show subscriber full imsi <imsi>. -à get the call id
show logs callid <call_id>
show logs
如果呼叫方ID存在,則表明已收集訂戶會話日誌,如果沒有,您需要再次運行它。
已執行疑難排解
- 對Web URL伺服器IP地址執行ping操作並檢查是否有任何資料包丟棄。
ping <URL IP address> ------------ from Gi context
--- ping statistics ---
3 packets transmitted, 0 received, 100% packet loss, time 12160ms. >.>>>> There are packet drops, now we need to check were it is dropping
2.從GI環境執行traceroute,檢查是否有任何可接通性問題。
traceroute <peer ip address> src <local diameter origin host ip address>

Ex: traceroute 10.52.5.49 src 10.203.144.8
3. 檢查使用者統計資訊,以便檢查資料包丟包情況。
Show subscriber full imsi <imsi number>

input pkts: 455 output pkts: 474
input bytes: 75227 output bytes: 103267
input bytes dropped: 0 output bytes dropped: 0
input pkts dropped: 0 output pkts dropped: 0
input pkts dropped due to lorc : 0 output pkts dropped due to lorc : 0
input bytes dropped due to lorc : 0
in packet dropped suspended state: 0 out packet dropped suspended state: 0
in bytes dropped suspended state: 0 out bytes dropped suspended state: 0
in packet dropped sgw restoration state: 0 out packet dropped sgw restoration state: 0
in bytes dropped sgw restoration state: 0 out bytes dropped sgw restoration state: 0
pk rate from user(bps): 18547 pk rate to user(bps): 25330
ave rate from user(bps): 6182 ave rate to user(bps): 8443
sust rate from user(bps): 5687 sust rate to user(bps): 7768
pk rate from user(pps): 13 pk rate to user(pps): 14
ave rate from user(pps): 4 ave rate to user(pps): 4
sust rate from user(pps): 4 sust rate to user(pps): 4
link online/active percent: 92
ipv4 bad hdr: 0 ipv4 ttl exceeded: 0
ipv4 fragments sent: 0 ipv4 could not fragment: 0
ipv4 input acl drop: 0 ipv4 output acl drop: 0
ipv4 bad length trim: 0
ipv6 input acl drop: 0 ipv6 output acl drop: 0
ipv4 input css down drop: 0 ipv4 output css down drop: 0
ipv4 input css down drop: 0 ipv4 output css down drop: 0
ipv4 output xoff pkts drop: 0 ipv4 output xoff bytes drop: 0
ipv6 output xoff pkts drop: 0 ipv6 output xoff bytes drop: 0
ipv6 input ehrpd-access drop: 0 ipv6 output ehrpd-access drop: 0
input pkts dropped (0 mbr): 0 output pkts dropped (0 mbr): 0
ip source violations: 0 ipv4 output no-flow drop: 0
ipv6 egress filtered: 0
ipv4 proxy-dns redirect: 0 ipv4 proxy-dns pass-thru: 0
ipv4 proxy-dns drop: 0
ipv4 proxy-dns redirect tcp connection: 0
ipv6 bad hdr: 0 ipv6 bad length trim: 0
ip source violations no acct: 0
ip source violations ignored: 0
dormancy total: 0 handoff total: 0
ipv4 icmp packets dropped: 0
APN AMBR Input Pkts Drop: 0 APN AMBR Output Pkts Drop: 0
APN AMBR Input Bytes Drop: 0 APN AMBR Output Bytes Drop: 0
APN AMBR UE Overload Input Pkts Drop: 0 APN AMBR UE Overload Output Pkts Drop: 0
APN AMBR UE Overload Input Bytes Drop: 0 APN AMBR UE Overload Output Bytes Drop: 0
Access-flows:0
Num Auxiliary A10s:0
4. 檢查show active charging輸出以瞭解訂戶流量影響。
Show active-charging session full imsi <imsi num>

PP Dropped Packets: 0
CC Dropped Uplink Packets: 0 CC Dropped Uplink Bytes: 0
CC Dropped Downlink Packets: 0 CC Dropped Downlink Bytes: 0
5. 檢查ECS/ACS級別資料包丟棄的show active charging命令輸出,並檢查是否存在任何資料包丟棄。然後,檢查配置,檢查配置的操作。
Show active-charging session full imsi <imsi num> or show sub user-plane-only full callid  <>
 Ruledef Name Pkts-Down Bytes-Down Pkts-Up Bytes-Up Hits Match-Bypassed
-------------------- ---------- ---------- ---------- ---------- ---------- --------------
dns_free_covid 4 428 4 340 8 0
icmpv6 0 0 5 1423 5 0
ip-pkts 479 103670 432 74488 764 429
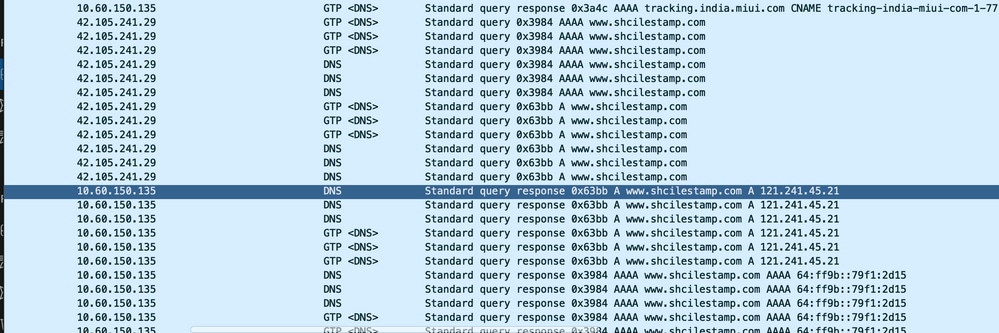
6. 檢查DNS解析是否成功。如果成功,則DNS沒有問題。
7. 檢查使用者裝置(UE)和伺服器之間的TCP連線是否已成功建立。
8. 如果在上述任何步驟中未觀察到丟包現象,則節點中不存在任何問題。
封包捨棄
1. 檢查訂戶版本統計資訊,以確定是否遇到了類似於此處所示的丟包現象。
 Total Dropped Packets : 132329995
Total Dropped Packet Bytes: 14250717212

Total PP Dropped Packets : 0
Total PP Dropped Packet Bytes: 0

R7Gx Rule-Matching Failure Stats:
Total Dropped Packets : 871921
Total Dropped Packet Bytes : 86859232

P2P random drop stats:
Total Dropped Packets : 0
Total Dropped Packet Bytes : 0
2. 檢查show subscriber輸出中觀察到的失敗百分比。如果封包捨棄率小於1%,很可能是偶然,沒有影響。
input pkts: 455 output pkts: 474
input bytes: 75227 output bytes: 103267
input bytes dropped: 0 output bytes dropped: 0
input pkts dropped: 0 output pkts dropped: 0
3. 如果您注意到RX分級組中的資料包丟棄和ITC資料包丟棄,則這很可能是由於頻寬問題和使用者包過期所致。
ITC Packets Drop: 47235019
4. 在「增強型計費服務(ECS)」級別,您必須檢查/驗證ECS配置,以瞭解如何定義規則/計費操作/規則庫,以及您是否具有任何阻止因子。在ECS級別有不同型別的丟棄,根據您需要的丟棄型別,您需要繼續執行下一個行動計畫。
5. 正在傳遞但未處理的資料包大小的MTU大小。
6. 可以透過TCP轉儲/使用者級跟蹤來辨識資料包被丟棄的中間路徑問題。
此類問題的恢復行動計畫並不相同,因為它隨問題的模式而變化。
 意見
意見