排除DMVPN第2階段分支到分支隧道故障
下載選項
無偏見用語
本產品的文件集力求使用無偏見用語。針對本文件集的目的,無偏見係定義為未根據年齡、身心障礙、性別、種族身分、民族身分、性別傾向、社會經濟地位及交織性表示歧視的用語。由於本產品軟體使用者介面中硬式編碼的語言、根據 RFP 文件使用的語言,或引用第三方產品的語言,因此本文件中可能會出現例外狀況。深入瞭解思科如何使用包容性用語。
關於此翻譯
思科已使用電腦和人工技術翻譯本文件,讓全世界的使用者能夠以自己的語言理解支援內容。請注意,即使是最佳機器翻譯,也不如專業譯者翻譯的內容準確。Cisco Systems, Inc. 對這些翻譯的準確度概不負責,並建議一律查看原始英文文件(提供連結)。
簡介
本文檔介紹當第2階段輻條到輻條DMVPN隧道未建立時,如何對其進行故障排除。
必要條件
需求
思科建議您瞭解以下主題:
- 動態多點虛擬私人網路(DMVPN)
- IKE/IPSEC通訊協定
- 下一個躍點解析通訊協定(NHRP)
採用元件
本檔案是根據以下軟體版本所編制:
- Cisco CSR1000V(VXE) — 版本17.03.08
本文中的資訊是根據特定實驗室環境內的裝置所建立。文中使用到的所有裝置皆從已清除(預設)的組態來啟動。如果您的網路運作中,請確保您瞭解任何指令可能造成的影響。
背景資訊
本文描述如何針對常見DMVPN問題配置和使用不同的故障排除工具。問題是第2階段DMVPN隧道的協商失敗,在該階段,源分支將顯示DMVPN狀態,同時具有到目標分支的正確非廣播多路訪問(NBMA)/隧道對映。但是,在目標分支上顯示不正確的對映。
理論背景
瞭解DMVPN第2階段設定時如何建立分支到分支隧道非常重要。這一部分提供了此階段NHRP過程的簡要理論總結。
在DMVPN第2階段,您可以按需建立動態分支到分支隧道。這是可能的,因為在DMVPN雲(集線器和分支)內的所有裝置上,隧道介面的模式將更改為通用路由封裝(GRE)多點。此階段的關鍵功能之一是,其它裝置不會將集線器視為下一跳。相反,所有輻條都具有彼此的路由資訊。在第2階段建立輻條到輻條隧道時,將觸發NHRP進程,其中輻條會獲取其他輻條的資訊,並在NBMA和隧道IP地址之間進行對映。
接下來的步驟將列出如何觸發NHRP解析過程:
- 當源分支嘗試到達目標分支的LAN時,它會執行路由查詢,觸發解析請求消息以獲取目標分支的NBMA地址。源分支向中心傳送此初始消息。
-
中心接收解析請求並將其轉發到目標分支。
-
目標分支將解析回覆傳送到源分支。如果通道配置連結了IPSEC配置檔案:
-
NHRP解析過程被延遲,直到IKE/IPSEC協定可以建立。
- 目標分支發起並建立IKE/IPSEC隧道。
-
然後,NHRP進程將恢復,並且目標分支使用IPSEC隧道作為傳輸方法向源分支傳送解決方案應答。
-
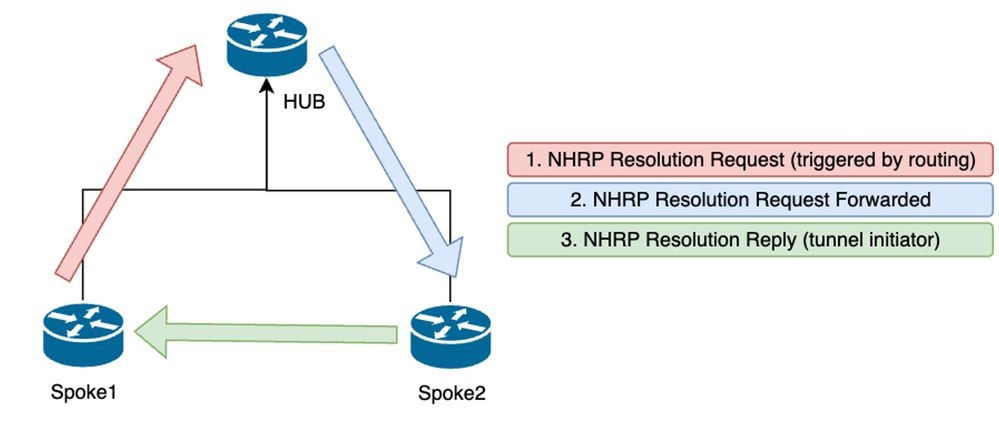 第2階段分支之間的NHRP消息流

附註:必須先在HUB中註冊所有分支,然後才能開始解析過程。
拓撲
此圖顯示用於此情景的拓撲:
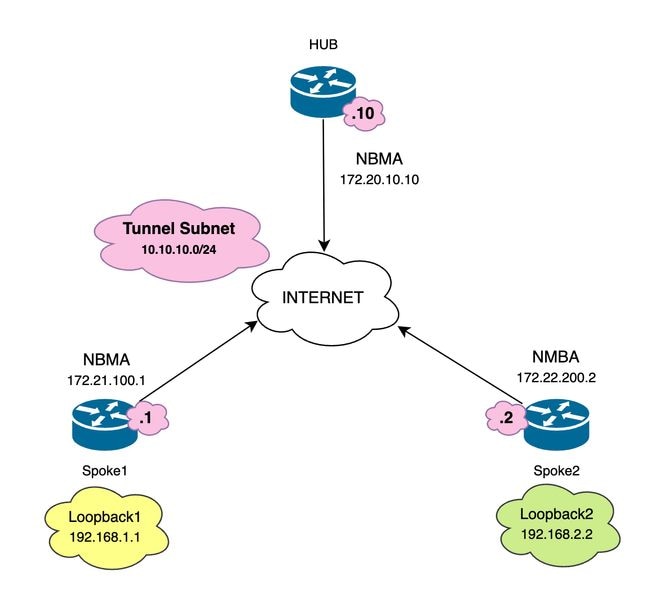 使用的網路圖和IP子網
疑難排解步驟
在此場景中,Spoke1和Spoke2之間未建立分支到分支隧道,由於它們無法互相訪問,因此影響了它們本地資源(由環回介面表示)之間的通訊。
SPOKE1#ping 192.168.2.2 source loopback1
Type escape sequence to abort.
Sending 5, 100-byte ICMP Echos to 192.168.2.2, timeout is 2 seconds:
.....
Success rate is 0 percent (0/5)
初始驗證
遇到此類情況時,首先驗證隧道配置並確保兩台裝置具有正確的值非常重要。要檢查隧道配置,請運行命令show running-config interface tunnel<ID>。
分支1隧道配置:
SPOKE1#show running-config interface tunnel10
Building configuration...

Current configuration : 341 bytes
!
interface Tunnel10
ip address 10.10.10.1 255.255.255.0
no ip redirects
ip nhrp authentication DMVPN
ip nhrp map 10.10.10.10 172.20.10.10
ip nhrp map multicast 172.20.10.10
ip nhrp network-id 10
ip nhrp nhs 10.10.10.10
tunnel source GigabitEthernet1
tunnel mode gre multipoint
tunnel protection IPSEC profile IPSEC_Profile_1
end
分支2隧道配置:
SPOKE2#show running-config interface tunnel10
Building configuration...

Current configuration : 341 bytes
!
interface Tunnel10
ip address 10.10.10.2 255.255.255.0
no ip redirects
ip nhrp authentication DMVPN
ip nhrp map 10.10.10.10 172.20.10.10
ip nhrp map multicast 172.20.10.10
ip nhrp network-id 10
ip nhrp nhs 10.10.10.10
tunnel source GigabitEthernet1
tunnel mode gre multipoint
tunnel protection IPSEC profile IPSEC_Profile_1
end
在配置中,您需要驗證到HUB的對映是否正確,裝置之間的NHRP身份驗證字串是否匹配,兩個分支配置了相同的DMVPN階段,如果使用IPSEC保護,請驗證是否應用了正確的加密配置。
如果配置正確並且包括IPSEC保護,則必須驗證IKE和IPSEC協定是否正常工作。這是因為NHRP使用IPSEC通道作為傳輸方法完全協商。要驗證IKE/IPSEC協定的狀態,請運行命令show crypto IPSEC sa peer x.x.x.x(其中x.x.x.x是您要嘗試建立隧道的輻條的NBMA IP地址)。
附註:若要確認IPSEC通道是否已啟動,傳入和傳出封裝安全負載(ESP)部分必須具有通道資訊(SPI、轉換集等)。 此部分上顯示的所有值在兩端必須匹配。
附註:如果發現IKE/IPSEC有任何問題,故障排除必須側重於這些協定。
Spoke1上的IKE/IPSEC通道狀態:
SPOKE1#show crypto IPSEC sa peer 172.22.200.2

interface: Tunnel10
Crypto map tag: Tunnel10-head-0, local addr 172.21.100.1

protected vrf: (none)
local ident (addr/mask/prot/port): (172.21.100.1/255.255.255.255/47/0)
remote ident (addr/mask/prot/port): (172.22.200.2/255.255.255.255/47/0)
current_peer 172.22.200.2 port 500
PERMIT, flags={origin_is_acl,}
#pkts encaps: 0, #pkts encrypt: 0, #pkts digest: 0
#pkts decaps: 0, #pkts decrypt: 0, #pkts verify: 0
#pkts compressed: 0, #pkts decompressed: 0
#pkts not compressed: 0, #pkts compr. failed: 0
#pkts not decompressed: 0, #pkts decompress failed: 0
#send errors 0, #recv errors 0

local crypto endpt.: 172.21.100.1, remote crypto endpt.: 172.22.200.2
plaintext mtu 1458, path mtu 1500, ip mtu 1500, ip mtu idb GigabitEthernet1
current outbound spi: 0x6F6BF94A(1869347146)
PFS (Y/N): N, DH group: none

inbound esp sas:
spi: 0x84502A19(2219846169)
transform: esp-256-aes esp-sha256-hmac ,
in use settings ={Transport, }
conn id: 2049, flow_id: CSR:49, sibling_flags FFFFFFFF80000008, crypto map: Tunnel10-head-0
sa timing: remaining key lifetime (k/sec): (4608000/28716)
IV size: 16 bytes
replay detection support: Y
Status: ACTIVE(ACTIVE)

inbound ah sas:

inbound pcp sas:

outbound esp sas:
spi: 0x6F6BF94A(1869347146)
transform: esp-256-aes esp-sha256-hmac ,
in use settings ={Transport, }
conn id: 2050, flow_id: CSR:50, sibling_flags FFFFFFFF80000008, crypto map: Tunnel10-head-0
sa timing: remaining key lifetime (k/sec): (4608000/28716)
IV size: 16 bytes
replay detection support: Y
Status: ACTIVE(ACTIVE)

outbound ah sas:

outbound pcp sas:
Spoke2上的IKE/IPSEC通道狀態:
SPOKE2#show crypto IPSEC sa peer 172.21.100.1

interface: Tunnel10
Crypto map tag: Tunnel10-head-0, local addr 172.22.200.2

protected vrf: (none)
local ident (addr/mask/prot/port): (172.22.200.2/255.255.255.255/47/0)
remote ident (addr/mask/prot/port): (172.21.100.1/255.255.255.255/47/0)
current_peer 172.21.100.1 port 500
PERMIT, flags={origin_is_acl,}
#pkts encaps: 16, #pkts encrypt: 16, #pkts digest: 16
#pkts decaps: 0, #pkts decrypt: 0, #pkts verify: 0
#pkts compressed: 0, #pkts decompressed: 0
#pkts not compressed: 0, #pkts compr. failed: 0
#pkts not decompressed: 0, #pkts decompress failed: 0
#send errors 0, #recv errors 0

local crypto endpt.: 172.22.200.2, remote crypto endpt.: 172.21.100.1
plaintext mtu 1458, path mtu 1500, ip mtu 1500, ip mtu idb GigabitEthernet1
current outbound spi: 0x84502A19(2219846169)
PFS (Y/N): N, DH group: none

inbound esp sas:
spi: 0x6F6BF94A(1869347146)
transform: esp-256-aes esp-sha256-hmac ,
in use settings ={Transport, }
conn id: 2045, flow_id: CSR:45, sibling_flags FFFFFFFF80004008, crypto map: Tunnel10-head-0
sa timing: remaining key lifetime (k/sec): (4608000/28523)
IV size: 16 bytes
replay detection support: Y
Status: ACTIVE(ACTIVE)

inbound ah sas:

inbound pcp sas:

outbound esp sas:
spi: 0x84502A19(2219846169)
transform: esp-256-aes esp-sha256-hmac ,
in use settings ={Transport, }
conn id: 2046, flow_id: CSR:46, sibling_flags FFFFFFFF80004008, crypto map: Tunnel10-head-0
sa timing: remaining key lifetime (k/sec): (4607998/28523)
IV size: 16 bytes
replay detection support: Y
Status: ACTIVE(ACTIVE)

outbound ah sas:

outbound pcp sas:
輸出顯示,兩個分支上的IPSEC通道均已啟動,但Spoke2顯示加密的封包(封裝),但沒有解密的封包(解封)。 同時,Spoke1不會顯示流經IPSEC隧道的任何資料包。這表示問題可能出在NHRP通訊協定上。
疑難排解工具
執行初始驗證並證實配置和IKE/IPSEC協定(如果需要)未導致通訊問題後,您可以使用本節中提供的工具繼續故障排除。
有用的命令
show dmvpn interface tunnel<ID>指令會為您提供特定於DMVPN的作業階段資訊(NBMA/通道IP位址、通道的狀態、開啟/關閉時間及屬性)。 您可以使用detail關鍵字顯示加密會話/套接字的詳細資訊。必須提一下,通道兩端的狀態必須相符。
分支1 show dmvpn interface tunnel<ID>輸出:
SPOKE1#show dmvpn interface tunnel10
Legend: Attrb --> S - Static, D - Dynamic, I - Incomplete
N - NATed, L - Local, X - No Socket
T1 - Route Installed, T2 - Nexthop-override, B - BGP
C - CTS Capable, I2 - Temporary
# Ent --> Number of NHRP entries with same NBMA peer
NHS Status: E --> Expecting Replies, R --> Responding, W --> Waiting
UpDn Time --> Up or Down Time for a Tunnel
==========================================================================

Interface: Tunnel10, IPv4 NHRP Details
Type:Spoke, NHRP Peers:1,

# Ent Peer NBMA Addr Peer Tunnel Add  State UpDn Tm  Attrb
----- --------------- --------------- ----- -------- -----
   2   172.20.10.10     10.10.10.2      UP  00:00:51  I2
                        10.10.10.10     UP  02:53:27  S
分支2 show dmvpn interface tunnel<ID> 輸出:
SPOKE2#show dmvpn interface tunnel10
Legend: Attrb --> S - Static, D - Dynamic, I - Incomplete
N - NATed, L - Local, X - No Socket
T1 - Route Installed, T2 - Nexthop-override, B - BGP
C - CTS Capable, I2 - Temporary
# Ent --> Number of NHRP entries with same NBMA peer
NHS Status: E --> Expecting Replies, R --> Responding, W --> Waiting
UpDn Time --> Up or Down Time for a Tunnel
==========================================================================

Interface: Tunnel10, IPv4 NHRP Details
Type:Spoke, NHRP Peers:2,

# Ent Peer NBMA Addr Peer Tunnel Add State UpDn Tm Attrb
----- --------------- --------------- ----- -------- -----
  1    172.21.100.1     10.10.10.1     UP  00:03:53   D
  1    172.20.10.10     10.10.10.10    UP  02:59:14   S
每個裝置上的輸出顯示每個分支的不同資訊。在Spoke1表中,可以看到Spoke 2的條目不包含正確的NBMA IP地址,並且屬性顯示為不完整(I2)。 另一方面,Spoke2表顯示正確的對映(NBMA/隧道IP地址)和狀態為up,表示隧道已完全協商。
以下命令在故障排除過程中非常有用:
- show ip nhrp:顯示NHRP對映資訊。
- show ip nhrp traffic interface tunnel10: 顯示NHRP流量統計資訊。
附註:有關命令規範(語法、說明、關鍵字、示例),請參閱Command Reference: Cisco IOS Security Command Reference:命令S到Z
偵錯
在驗證先前資訊並確認隧道遇到協商問題後,必須啟用調試以觀察如何交換NHRP資料包。必須在所有相關的裝置上啟用下一次調試:
- debug dmvpn condition peer NBMA x.x.x.x(其中x.x.x.x是遠端裝置IP地址)。
- debug dmvpn all:此命令啟用ISAKMP、IKEv2、IPSEC、DMVPN和NHRP調試命令。

提示:每次啟用偵錯時,建議使用peer condition命令,以便可以看到該特定隧道的協商。
要檢視完整的NHRP流程,每台裝置上都使用了下一個debugs命令:
輻條1
debug dmvpn condition peer NBMA 172.22.200.2
debug dmvpn condition peer NBMA 172.20.10.10
debug dmvpn all all
集線器
debug dmvpn condition peer NBMA 172.21.100.1
debug dmvpn condition peer NBMA 172.22.200.2
debug dmvpn all all
輻條2
debug dmvpn condition peer NBMA 172.21.100.1
debug dmvpn condition peer NBMA 172.20.10.10
debug dmvpn all all
附註:必須在涉及的所有裝置上同時啟用和收集調試。
所有裝置上啟用的調試均會顯示命令show debug:
ROUTER#show debug
IOSXE Conditional Debug Configs:

Conditional Debug Global State: Stop


IOSXE Packet Tracing Configs:


Packet Infra debugs:

Ip Address Port
------------------------------------------------------|----------

NHRP:
NHRP protocol debugging is on
NHRP activity debugging is on
NHRP detail debugging is on
NHRP extension processing debugging is on
NHRP cache operations debugging is on
NHRP routing debugging is on
NHRP rate limiting debugging is on
NHRP errors debugging is on
NHRP events debugging is on

Cryptographic Subsystem:
Crypto ISAKMP debugging is on
Crypto ISAKMP Error debugging is on
Crypto IPSEC debugging is on
Crypto IPSEC Error debugging is on
Crypto secure socket events debugging is on
IKEV2:
IKEv2 error debugging is on
IKEv2 default debugging is on
IKEv2 packet debugging is on
IKEv2 packet hexdump debugging is on
IKEv2 internal debugging is on
Tunnel Protection Debugs:
Generic Tunnel Protection debugging is on

DMVPN:
DMVPN error debugging is on
DMVPN UP/DOWN event debugging is on
DMVPN detail debugging is on
DMVPN packet debugging is on
DMVPN all level debugging is on
收集完所有調試後,必須開始分析源分支(分支1)上的調試。 這樣,您就可以從頭開始跟蹤協商。
Spoke1調試輸出:
-------------------- [IKE/IPSEC DEBUG OUTPUTS OMITTED]--------------------

*Feb 1 01:31:34.657: ISAKMP: (1016):Old State = IKE_QM_R_QM2 New State = IKE_QM_PHASE2_COMPLETE
*Feb 1 01:31:34.657: IPSEC(key_engine): got a queue event with 1 KMI message(s)
*Feb 1 01:31:34.657: IPSEC(key_engine_enable_outbound): rec'd enable notify from ISAKMP
*Feb 1 01:31:34.657: CRYPTO_SS(TUNNEL SEC): Sending MTU Changed message
*Feb 1 01:31:34.661: IPSEC-IFC MGRE/Tu10(172.21.100.1/172.22.200.2): Got MTU message mtu 1458
*Feb 1 01:31:34.661: IPSEC-IFC MGRE/Tu10(172.21.100.1/172.22.200.2): connection lookup returned 80007F2B7055F5A8
*Feb 1 01:31:34.662: CRYPTO_SS(TUNNEL SEC): Sending Socket Up message
*Feb 1 01:31:34.662: IPSEC-IFC MGRE/Tu10(172.21.100.1/172.22.200.2): connection lookup returned 80007F2B7055F5A8
*Feb 1 01:31:34.662: IPSEC-IFC MGRE/Tu10(172.21.100.1/172.22.200.2): tunnel_protection_socket_up
*Feb 1 01:31:34.662: IPSEC-IFC MGRE/Tu10(172.21.100.1/172.22.200.2): Signalling NHRP
*Feb 1 01:31:36.428: NHRP: Checking for delayed event NULL/10.10.10.2 on list (Tunnel10 vrf: global(0x0))
*Feb 1 01:31:36.429: NHRP: No delayed event node found.
*Feb 1 01:31:36.429: NHRP: There is no VPE Extension to construct for the request
*Feb 1 01:31:36.429: NHRP: Sending NHRP Resolution Request for dest: 10.10.10.2 to nexthop: 10.10.10.2 using our src: 10.10.10.1 vrf: global(0x0)
*Feb 1 01:31:36.429: NHRP: Attempting to send packet through interface Tunnel10 via DEST dst 10.10.10.2
*Feb 1 01:31:36.429: NHRP-DETAIL: First hop route lookup for 10.10.10.2 yielded 10.10.10.2, Tunnel10
*Feb 1 01:31:36.429: NHRP: Send Resolution Request via Tunnel10 vrf: global(0x0), packet size: 85
*Feb 1 01:31:36.429: src: 10.10.10.1, dst: 10.10.10.2
*Feb 1 01:31:36.429: (F) afn: AF_IP(1), type: IP(800), hop: 255, ver: 1
*Feb 1 01:31:36.429: shtl: 4(NSAP), sstl: 0(NSAP)
*Feb 1 01:31:36.429: pktsz: 85 extoff: 52
*Feb 1 01:31:36.429: (M) flags: "router auth src-stable nat ", reqid: 10
*Feb 1 01:31:36.429: src NBMA: 172.21.100.1
*Feb 1 01:31:36.429: src protocol: 10.10.10.1, dst protocol: 10.10.10.2
*Feb 1 01:31:36.429: (C-1) code: no error(0), flags: none
*Feb 1 01:31:36.429: prefix: 0, mtu: 9976, hd_time: 600
*Feb 1 01:31:36.429: addr_len: 0(NSAP), subaddr_len: 0(NSAP), proto_len: 0, pref: 255
*Feb 1 01:31:36.429: Responder Address Extension(3):
*Feb 1 01:31:36.429: Forward Transit NHS Record Extension(4):
*Feb 1 01:31:36.429: Reverse Transit NHS Record Extension(5):
*Feb 1 01:31:36.429: Authentication Extension(7):
*Feb 1 01:31:36.429: type:Cleartext(1), data:DMVPN
*Feb 1 01:31:36.429: NAT address Extension(9):
*Feb 1 01:31:36.430: NHRP: Encapsulation succeeded. Sending NHRP Control Packet NBMA Address: 172.20.10.10
*Feb 1 01:31:36.430: NHRP: 109 bytes out Tunnel10
*Feb 1 01:31:36.430: NHRP-RATE: Retransmitting Resolution Request for 10.10.10.2, reqid 10, (retrans ivl 4 sec)
*Feb 1 01:31:39.816: NHRP: Checking for delayed event NULL/10.10.10.2 on list (Tunnel10 vrf: global(0x0))
*Feb 1 01:31:39.816: NHRP: No delayed event node found.
*Feb 1 01:31:39.816: NHRP: There is no VPE Extension to construct for the request
*Feb 1 01:31:39.817: NHRP: Sending NHRP Resolution Request for dest: 10.10.10.2 to nexthop: 10.10.10.2 using our src: 10.10.10.1 vrf: global(0x0)
*Feb 1 01:31:39.817: NHRP: Attempting to send packet through interface Tunnel10 via DEST dst 10.10.10.2
*Feb 1 01:31:39.817: NHRP-DETAIL: First hop route lookup for 10.10.10.2 yielded 10.10.10.2, Tunnel10
*Feb 1 01:31:39.817: NHRP: Send Resolution Request via Tunnel10 vrf: global(0x0), packet size: 85
*Feb 1 01:31:39.817: src: 10.10.10.1, dst: 10.10.10.2
*Feb 1 01:31:39.817: (F) afn: AF_IP(1), type: IP(800), hop: 255, ver: 1
*Feb 1 01:31:39.817: shtl: 4(NSAP), sstl: 0(NSAP)
*Feb 1 01:31:39.817: pktsz: 85 extoff: 52
*Feb 1 01:31:39.817: (M) flags: "router auth src-stable nat ", reqid: 10
*Feb 1 01:31:39.817: src NBMA: 172.21.100.1
*Feb 1 01:31:39.817: src protocol: 10.10.10.1, dst protocol: 10.10.10.2
*Feb 1 01:31:39.817: (C-1) code: no error(0), flags: none
*Feb 1 01:31:39.817: prefix: 0, mtu: 9976, hd_time: 600
*Feb 1 01:31:39.817: addr_len: 0(NSAP), subaddr_len: 0(NSAP), proto_len: 0, pref: 255
*Feb 1 01:31:39.817: Responder Address Extension(3):
*Feb 1 01:31:39.817: Forward Transit NHS Record Extension(4):
*Feb 1 01:31:39.817: Reverse Transit NHS Record Extension(5):
*Feb 1 01:31:39.817: Authentication Extension(7):
*Feb 1 01:31:39.817: type:Cleartext(1), data:DMVPN
*Feb 1 01:31:39.817: NAT address Extension(9):
*Feb 1 01:31:39.817: NHRP: Encapsulation succeeded. Sending NHRP Control Packet NBMA Address: 172.20.10.10
*Feb 1 01:31:39.818: NHRP: 109 bytes out Tunnel10
*Feb 1 01:31:39.818: NHRP-RATE: Retransmitting Resolution Request for 10.10.10.2, reqid 10, (retrans ivl 8 sec)
*Feb 1 01:31:46.039: NHRP: Checking for delayed event NULL/10.10.10.2 on list (Tunnel10 vrf: global(0x0))
*Feb 1 01:31:46.040: NHRP: No delayed event node found.
*Feb 1 01:31:46.040: NHRP: There is no VPE Extension to construct for the request
Spoke1 NHRP進程開始後,日誌顯示裝置正在傳送NHRP解析請求。資料包包含一些重要資訊,例如src NMBA和src協定,它們是源分支(Spoke1)的NBMA IP地址和隧道IP地址。 您還可以看到具有目標分支(Spoke2)的隧道IP地址的dst協定值。 這表示Spoke1正在請求Spoke2的NBMA地址以完成對映。此外,在資料包上,您可以找到可幫助您跟蹤路徑中資料包的請求值。此值在整個過程中將保持不變,並有助於跟蹤NHRP協商的特定流程。封包具有其他對交涉重要的值,例如NHRP驗證字串。
裝置傳送NHRP解析請求後,日誌顯示已傳送重新傳輸。這是因為裝置未看到NHRP解析響應,因此它會再次傳送資料包。由於Spoke1沒有看到響應,因此有必要在路徑中的下一個裝置(即HUB)上跟蹤該資料包。
HUB調試輸出:
*Feb 1 01:31:34.262: NHRP: Receive Resolution Request via Tunnel10 vrf: global(0x0), packet size: 85
*Feb 1 01:31:34.262: (F) afn: AF_IP(1), type: IP(800), hop: 255, ver: 1
*Feb 1 01:31:34.262: shtl: 4(NSAP), sstl: 0(NSAP)
*Feb 1 01:31:34.263: pktsz: 85 extoff: 52
*Feb 1 01:31:34.263: (M) flags: "router auth src-stable nat ", reqid: 10
*Feb 1 01:31:34.263: src NBMA: 172.21.100.1
*Feb 1 01:31:34.263: src protocol: 10.10.10.1, dst protocol: 10.10.10.2
*Feb 1 01:31:34.263: (C-1) code: no error(0), flags: none
*Feb 1 01:31:34.263: prefix: 0, mtu: 9976, hd_time: 600
*Feb 1 01:31:34.263: addr_len: 0(NSAP), subaddr_len: 0(NSAP), proto_len: 0, pref: 255
*Feb 1 01:31:34.263: Responder Address Extension(3):
*Feb 1 01:31:34.263: Forward Transit NHS Record Extension(4):
*Feb 1 01:31:34.263: Reverse Transit NHS Record Extension(5):
*Feb 1 01:31:34.263: Authentication Extension(7):
*Feb 1 01:31:34.263: type:Cleartext(1), data:DMVPN
*Feb 1 01:31:34.263: NAT address Extension(9):
*Feb 1 01:31:34.263: NHRP-DETAIL: netid_in = 10, to_us = 0
*Feb 1 01:31:34.263: NHRP-DETAIL: Resolution request for afn 1 received on interface Tunnel10 , for vrf: global(0x0) label: 0
*Feb 1 01:31:34.263: NHRP-DETAIL: Multipath IP route lookup for 10.10.10.2 in vrf: global(0x0) yielded Tunnel10, pfx:10.10.10.0/24 (netid_in:10 if_in:Tunnel10)
*Feb 1 01:31:34.263: NHRP: Route lookup for destination 10.10.10.2 in vrf: global(0x0) yielded interface Tunnel10, prefixlen 24
*Feb 1 01:31:34.263: NHRP-DETAIL: netid_out 10, netid_in 10
*Feb 1 01:31:34.263: NHRP: Forwarding request due to authoritative request.
*Feb 1 01:31:34.263: NHRP-ATTR: NHRP Resolution Request packet is forwarded to 10.10.10.2 using vrf: global(0x0)
*Feb 1 01:31:34.263: NHRP: Attempting to forward to destination: 10.10.10.2 vrf: global(0x0)
*Feb 1 01:31:34.264: NHRP: Forwarding: NHRP SAS picked source: 10.10.10.10 for destination: 10.10.10.2
*Feb 1 01:31:34.264: NHRP: Attempting to send packet through interface Tunnel10 via DEST dst 10.10.10.2
*Feb 1 01:31:34.264: NHRP-DETAIL: First hop route lookup for 10.10.10.2 yielded 10.10.10.2, Tunnel10
*Feb 1 01:31:34.264: NHRP: Forwarding Resolution Request via Tunnel10 vrf: global(0x0), packet size: 105
*Feb 1 01:31:34.264: src: 10.10.10.10, dst: 10.10.10.2
*Feb 1 01:31:34.264: (F) afn: AF_IP(1), type: IP(800), hop: 254, ver: 1
*Feb 1 01:31:34.264: shtl: 4(NSAP), sstl: 0(NSAP)
*Feb 1 01:31:34.264: pktsz: 105 extoff: 52
*Feb 1 01:31:34.264: (M) flags: "router auth src-stable nat ", reqid: 10
*Feb 1 01:31:34.264: src NBMA: 172.21.100.1
*Feb 1 01:31:34.264: src protocol: 10.10.10.1, dst protocol: 10.10.10.2
*Feb 1 01:31:34.264: (C-1) code: no error(0), flags: none
*Feb 1 01:31:34.264: prefix: 0, mtu: 9976, hd_time: 600
*Feb 1 01:31:34.264: addr_len: 0(NSAP), subaddr_len: 0(NSAP), proto_len: 0, pref: 255
*Feb 1 01:31:34.264: Responder Address Extension(3):
*Feb 1 01:31:34.264: Forward Transit NHS Record Extension(4):
*Feb 1 01:31:34.264: (C-1) code: no error(0), flags: none
*Feb 1 01:31:34.264: prefix: 0, mtu: 9976, hd_time: 600
*Feb 1 01:31:34.264: addr_len: 4(NSAP), subaddr_len: 0(NSAP), proto_len: 4, pref: 255
*Feb 1 01:31:34.264: client NBMA: 172.20.10.10
*Feb 1 01:31:34.264: client protocol: 10.10.10.10
*Feb 1 01:31:34.264: Reverse Transit NHS Record Extension(5):
*Feb 1 01:31:34.264: Authentication Extension(7):
*Feb 1 01:31:34.264: type:Cleartext(1), data:DMVPN
*Feb 1 01:31:34.265: NAT address Extension(9):
*Feb 1 01:31:34.265: NHRP: Encapsulation succeeded. Sending NHRP Control Packet NBMA Address: 172.22.200.2
*Feb 1 01:31:34.265: NHRP: 129 bytes out Tunnel10
使用請求的值,您可以觀察到HUB收到Spoke1傳送的解析度請求。在資料包中,src NBMA和src協定的值是來自Spoke1的資訊,dst協定的值是Spoke2的隧道IP,如在Spoke1的調試中所見。當HUB收到解析請求時,它將執行路由查詢並將資料包轉發到Spoke2。在轉發的資料包中,HUB新增了一個包含其自身資訊(NBMA IP地址和隧道IP地址)的擴展。
前面的調試顯示HUB正將解析請求正確轉發到分支2。因此,下一步是確認Spoke2正在接收該請求,正確處理該請求,並將解析應答傳送給Spoke1。
Spoke2調試輸出:
-------------------- [IKE/IPSEC DEBUG OUTPUTS OMITTED]--------------------

*Feb 1 01:31:34.647: ISAKMP: (1015):Old State = IKE_QM_IPSEC_INSTALL_AWAIT New State = IKE_QM_PHASE2_COMPLETE
*Feb 1 01:31:34.647: NHRP: Process delayed resolution request src:10.10.10.1 dst:10.10.10.2 vrf: global(0x0)
*Feb 1 01:31:34.648: NHRP-DETAIL: Resolution request for afn 1 received on interface Tunnel10 , for vrf: global(0x0) label: 0
*Feb 1 01:31:34.648: NHRP-DETAIL: Multipath IP route lookup for 10.10.10.2 in vrf: global(0x0) yielded Tunnel10, pfx:10.10.10.0/24 (netid_in:10 if_in:Tunnel10)
*Feb 1 01:31:34.648: NHRP: Route lookup for destination 10.10.10.2 in vrf: global(0x0) yielded interface Tunnel10, prefixlen 24
*Feb 1 01:31:34.648: NHRP-ATTR: smart spoke feature and attributes are not configured
*Feb 1 01:31:34.648: NHRP: Request was to us. Process the NHRP Resolution Request.
*Feb 1 01:31:34.648: NHRP-DETAIL: Multipath IP route lookup for 10.10.10.2 in vrf: global(0x0) yielded Tunnel10, pfx:10.10.10.0/24 (netid_in:10 if_in:Tunnel10)
*Feb 1 01:31:34.648: NHRP: nhrp_rtlookup for 10.10.10.2 in vrf: global(0x0) yielded interface Tunnel10, prefixlen 24, label none(0)
*Feb 1 01:31:34.648: NHRP: Request was to us, responding with ouraddress
*Feb 1 01:31:34.648: NHRP: Checking for delayed event 10.10.10.1/10.10.10.2 on list (Tunnel10 vrf: global(0x0))
*Feb 1 01:31:34.648: NHRP: No delayed event node found.
*Feb 1 01:31:34.648: IPSEC-IFC MGRE/Tu10: Checking to see if we need to delay for src 172.22.200.2 dst 172.21.100.1
*Feb 1 01:31:34.648: IPSEC-IFC MGRE/Tu10: crypto_ss_listen_start already listening
*Feb 1 01:31:34.648: IPSEC-IFC MGRE/Tu10(172.22.200.2/172.21.100.1): Opening a socket with profile IPSEC_Profile_1
*Feb 1 01:31:34.648: IPSEC-IFC MGRE/Tu10(172.22.200.2/172.21.100.1): connection lookup returned 80007F1CE6348C68
*Feb 1 01:31:34.648: IPSEC-IFC MGRE/Tu10(172.22.200.2/172.21.100.1): Socket is already open. Ignoring.
*Feb 1 01:31:34.648: IPSEC-IFC MGRE/Tu10(172.22.200.2/172.21.100.1): connection lookup returned 80007F1CE6348C68
*Feb 1 01:31:34.648: IPSEC-IFC MGRE/Tu10(172.22.200.2/172.21.100.1): tunnel is already open!
*Feb 1 01:31:34.648: NHRP: No need to delay processing of resolution event NBMA src:172.22.200.2 NBMA dst:172.21.100.1
*Feb 1 01:31:34.648: NHRP-MEF: No vendor private extension in NHRP packet
*Feb 1 01:31:34.649: NHRP-CACHE: Tunnel10: Cache update for target 10.10.10.1/32 vrf: global(0x0) label none next-hop 10.10.10.1
*Feb 1 01:31:34.649: 172.21.100.1 (flags:0x2080)
*Feb 1 01:31:34.649: NHRP: Adding Tunnel Endpoints (VPN: 10.10.10.1, NBMA: 172.21.100.1)
*Feb 1 01:31:34.649: IPSEC-IFC MGRE/Tu10: crypto_ss_listen_start already listening
*Feb 1 01:31:34.649: IPSEC-IFC MGRE/Tu10(172.22.200.2/172.21.100.1): Opening a socket with profile IPSEC_Profile_1
*Feb 1 01:31:34.649: IPSEC-IFC MGRE/Tu10(172.22.200.2/172.21.100.1): connection lookup returned 80007F1CE6348C68
*Feb 1 01:31:34.649: IPSEC-IFC MGRE/Tu10(172.22.200.2/172.21.100.1): Found an existing tunnel endpoint
*Feb 1 01:31:34.649: IPSEC-IFC MGRE/Tu10(172.22.200.2/172.21.100.1): tunnel_protection_stop_pending_timer 80007F1CE6348C68
*Feb 1 01:31:34.649: IPSEC-IFC MGRE/Tu10(172.22.200.2/172.21.100.1): Socket is already open. Ignoring.
*Feb 1 01:31:34.653: NHRP: Successfully attached NHRP subblock for Tunnel Endpoints (VPN: 10.10.10.1, NBMA: 172.21.100.1)
*Feb 1 01:31:34.653: NHRP: Peer capability:0
*Feb 1 01:31:34.653: NHRP-CACHE: Inserted subblock node(1 now) for cache: Target 10.10.10.1/32 nhop 10.10.10.1
*Feb 1 01:31:34.653: NHRP-CACHE: Converted internal dynamic cache entry for 10.10.10.1/32 interface Tunnel10 vrf: global(0x0) to external
*Feb 1 01:31:34.653: NHRP-EVE: NHP-UP: 10.10.10.1, NBMA: 172.21.100.1
*Feb 1 01:31:34.653: NHRP-MEF: No vendor private extension in NHRP packet
*Feb 1 01:31:34.653: NHRP-CACHE: Tunnel10: Internal Cache add for target 10.10.10.2/32 vrf: global(0x0) label none next-hop 10.10.10.2
*Feb 1 01:31:34.653: 172.22.200.2 (flags:0x20)
*Feb 1 01:31:34.653: NHRP: Attempting to send packet through interface Tunnel10 via DEST dst 10.10.10.1
*Feb 1 01:31:34.654: NHRP-DETAIL: First hop route lookup for 10.10.10.1 yielded 10.10.10.1, Tunnel10
*Feb 1 01:31:34.654: NHRP: Send Resolution Reply via Tunnel10 vrf: global(0x0), packet size: 133
*Feb 1 01:31:34.654: src: 10.10.10.2, dst: 10.10.10.1
*Feb 1 01:31:34.654: (F) afn: AF_IP(1), type: IP(800), hop: 255, ver: 1
*Feb 1 01:31:34.654: shtl: 4(NSAP), sstl: 0(NSAP)
*Feb 1 01:31:34.654: pktsz: 133 extoff: 60
*Feb 1 01:31:34.654: (M) flags: "router auth dst-stable unique src-stable nat ", reqid: 10
*Feb 1 01:31:34.654: src NBMA: 172.21.100.1
*Feb 1 01:31:34.654: src protocol: 10.10.10.1, dst protocol: 10.10.10.2
*Feb 1 01:31:34.654: (C-1) code: no error(0), flags: none
*Feb 1 01:31:34.654: prefix: 32, mtu: 9976, hd_time: 599
*Feb 1 01:31:34.654: addr_len: 4(NSAP), subaddr_len: 0(NSAP), proto_len: 4, pref: 255
*Feb 1 01:31:34.654: client NBMA: 172.22.200.2
*Feb 1 01:31:34.654: client protocol: 10.10.10.2
*Feb 1 01:31:34.654: Responder Address Extension(3):
*Feb 1 01:31:34.654: (C) code: no error(0), flags: none
*Feb 1 01:31:34.654: prefix: 0, mtu: 9976, hd_time: 600
*Feb 1 01:31:34.654: addr_len: 4(NSAP), subaddr_len: 0(NSAP), proto_len: 4, pref: 255
*Feb 1 01:31:34.654: client NBMA: 172.22.200.2
*Feb 1 01:31:34.654: client protocol: 10.10.10.2
*Feb 1 01:31:34.654: Forward Transit NHS Record Extension(4):
*Feb 1 01:31:34.654: (C-1) code: no error(0), flags: none
*Feb 1 01:31:34.654: prefix: 0, mtu: 9976, hd_time: 600
*Feb 1 01:31:34.654: addr_len: 4(NSAP), subaddr_len: 0(NSAP), proto_len: 4, pref: 255
*Feb 1 01:31:34.654: client NBMA: 172.20.10.10
*Feb 1 01:31:34.654: client protocol: 10.10.10.10
*Feb 1 01:31:34.654: Reverse Transit NHS Record Extension(5):
*Feb 1 01:31:34.654: Authentication Extension(7):
*Feb 1 01:31:34.654: type:Cleartext(1), data:DMVPN
*Feb 1 01:31:34.655: NAT address Extension(9):
*Feb 1 01:31:34.655: NHRP: Encapsulation succeeded. Sending NHRP Control Packet NBMA Address: 172.21.100.1
*Feb 1 01:31:34.655: NHRP: 157 bytes out Tunnel10
*Feb 1 01:31:34.655: IPSEC-IFC MGRE/Tu10(172.22.200.2/172.21.100.1): connection lookup returned 80007F1CE6348C68
*Feb 1 01:31:34.655: NHRP-DETAIL: Deleted delayed event on interfaceTunnel10 dest: 172.21.100.1
reqid與前面輸出中顯示的值相匹配。已確認Spoke1傳送的NHRP解析請求資料包到達Spoke2。此資料包在Spoke2上觸發路由查詢,並意識到解析請求是屬於自己的,因此Spoke2將來自Spoke1的資訊新增到其NHRP表中。在將解析應答資料包傳送回Spoke1之前,裝置會新增自己的資訊(NBMA IP地址和隧道IP地址),以便Spoke1能夠使用該資料包將該資訊新增到其資料庫中。
根據所有可見的調試,從Spoke2傳送的NHRP解析應答沒有到達Spoke1。HUB可以放棄此問題,因為它正在按預期接收和轉發NHRP解析請求資料包。因此,下一步是在Spoke1和Spoke2之間捕獲資料,以獲取有關此問題的更多詳細資訊。
嵌入式封包擷取
嵌入式資料包捕獲功能允許您分析通過裝置的流量。配置它的第一步是建立一個訪問清單,其中包括要在兩個通訊流(入站和出站)上捕獲的流量。
在此案例中,使用NBMA IP地址:
ip access-list extended filter
10 permit ip host 172.21.100.1 host 172.22.200.2
20 permit ip host 172.22.200.2 host 172.21.100.1
然後,使用monitor capture <CAPTURE_NAME> access-list <ACL_NAME> buffer size 10 interface <WAN_INTERFACE> 命令配置捕獲,並使用monitor capture <CAPTURE_NAME> start命令啟動捕獲。
在Spoke1和Spoke2上捕獲配置:
monitor capture CAP access-list filter buffer size 10 interface GigabitEthernet1 both
monitor capture CAP start
要顯示捕獲的輸出,請使用命令show monitor capture <CAPTURE_NAME> buffer brief。
Capture output Spoke1:
SPOKE1#show monitor capture CAP buffer brief
----------------------------------------------------------------------------
#   size   timestamp     source             destination      dscp    protocol
----------------------------------------------------------------------------
   0  210    0.000000   172.22.200.2    ->  172.21.100.1     48 CS6  UDP
   1  150    0.014999   172.21.100.1    ->  172.22.200.2     48 CS6  UDP
   2  478    0.028990   172.22.200.2    ->  172.21.100.1     48 CS6  UDP
   3  498    0.049985   172.21.100.1    ->  172.22.200.2     48 CS6  UDP
   4  150    0.069988   172.22.200.2    ->  172.21.100.1     48 CS6  UDP
   5  134    0.072994   172.21.100.1    ->  172.22.200.2     48 CS6  UDP
   6  230    0.074993   172.22.200.2    ->  172.21.100.1     48 CS6  UDP
   7  230    0.089992   172.21.100.1    ->  172.22.200.2     48 CS6  UDP
   8  118    0.100993   172.22.200.2    ->  172.21.100.1     48 CS6  UDP
   9  218    0.108988   172.22.200.2    ->  172.21.100.1     48 CS6  ESP
  10   70    0.108988   172.21.100.1    ->  172.22.200.2     0  BE   ICMP
  11  218    1.907994   172.22.200.2    ->  172.21.100.1     48 CS6  ESP
  12   70    1.907994   172.21.100.1    ->  172.22.200.2     0  BE   ICMP
  13  218    5.818003   172.22.200.2    ->  172.21.100.1     48 CS6  ESP
  14   70    5.818003   172.21.100.1    ->  172.22.200.2     0  BE   ICMP
  15  218   12.559969   172.22.200.2    ->  172.21.100.1     48 CS6  ESP
  16   70   12.559969   172.21.100.1    ->  172.22.200.2     0  BE   ICMP
  17  218   26.859001   172.22.200.2    ->  172.21.100.1     48 CS6  ESP
  18   70   26.859001   172.21.100.1    ->  172.22.200.2     0  BE   ICMP
  19  218   54.378978   172.22.200.2    ->  172.21.100.1     48 CS6  ESP
  20   70   54.378978   172.21.100.1    ->  172.22.200.2     0  BE   ICMP
Capture output Spoke2:
SPOKE2#show monitor capture CAP buffer brief
----------------------------------------------------------------------------
#   size   timestamp     source             destination      dscp    protocol
----------------------------------------------------------------------------
   0  210    0.000000   172.22.200.2    ->  172.21.100.1     48 CS6  UDP
   1  150    0.015990   172.21.100.1    ->  172.22.200.2     48 CS6  UDP
   2  478    0.027998   172.22.200.2    ->  172.21.100.1     48 CS6  UDP
   3  498    0.050992   172.21.100.1    ->  172.22.200.2     48 CS6  UDP
   4  150    0.069988   172.22.200.2    ->  172.21.100.1     48 CS6  UDP
   5  134    0.072994   172.21.100.1    ->  172.22.200.2     48 CS6  UDP
   6  230    0.074993   172.22.200.2    ->  172.21.100.1     48 CS6  UDP
   7  230    0.089992   172.21.100.1    ->  172.22.200.2     48 CS6  UDP
   8  118    0.099986   172.22.200.2    ->  172.21.100.1     48 CS6  UDP
  9  218    0.108988   172.22.200.2    ->  172.21.100.1     48 CS6  ESP
  10   70    0.108988   172.21.100.1    ->  172.22.200.2     0  BE   ICMP
  11  218    1.907994   172.22.200.2    ->  172.21.100.1     48 CS6  ESP
  12   70    1.909001   172.21.100.1    ->  172.22.200.2     0  BE   ICMP
  13  218    5.817011   172.22.200.2    ->  172.21.100.1     48 CS6  ESP
  14   70    5.818002   172.21.100.1    ->  172.22.200.2     0  BE   ICMP
  15  218   12.559968   172.22.200.2    ->  172.21.100.1     48 CS6  ESP
  16   70   12.560960   172.21.100.1    ->  172.22.200.2     0  BE   ICMP
  17  218   26.858009   172.22.200.2    ->  172.21.100.1     48 CS6  ESP
  18   70   26.859001   172.21.100.1    ->  172.22.200.2     0  BE   ICMP
  19  218   54.378978   172.22.200.2    ->  172.21.100.1     48 CS6  ESP
  20   70   54.379970   172.21.100.1    ->  172.22.200.2     0  BE   ICMP
捕獲的輸出顯示初始資料包為UDP流量,指示IKE/IPSEC協商。然後,Spoke2將解析回覆傳送到Spoke1,該回覆被視為ESP流量(資料包9)。 在此之後,預期的流量為ESP,但下一個資料包是從Spoke1到Spoke2的ICMP流量。
要深入分析資料包,可以通過運行show monitor capture <CAPTURE_NAME>緩衝區轉儲命令從裝置匯出pcap檔案。然後使用解碼器工具將轉儲輸出轉換為pcap檔案,以便使用Wireshark將其開啟。
附註:思科擁有資料包分析器,您可以在其中找到捕獲配置示例和解碼器:Cisco TAC工具 — 資料包捕獲配置生成器和分析器
Wireshark輸出:
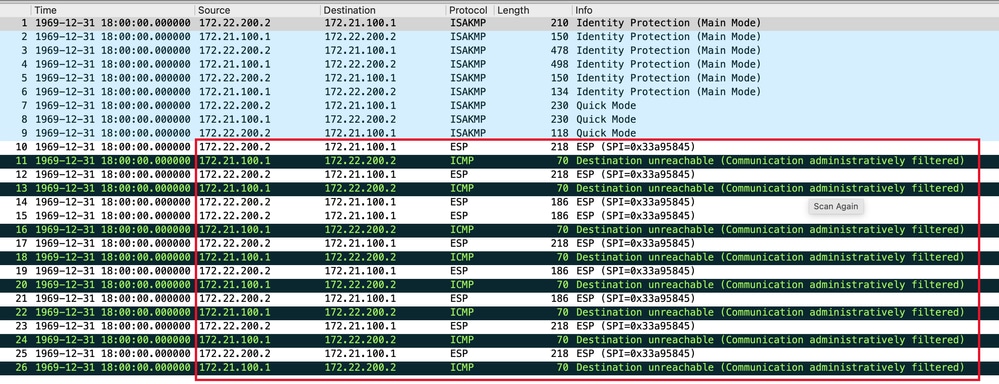 在Wireshark上捕獲輸出
ICMP封包的內容顯示錯誤訊息「Destination unreachable(Communication administratively filtered)」。 這表示存在某種過濾器,例如路由器ACL或防火牆,影響路徑上的流量。大多數情況下,在傳送資料包的裝置(本例中為Spoke1)上配置過濾器,但中間裝置也可傳送該資料包。
附註:兩個分支上的Wireshark輸出相同。
Cisco IOS® XE資料路徑資料包跟蹤功能
Cisco IOS XE資料路徑資料包跟蹤功能用於分析裝置如何處理流量。要配置它,您需要建立一個訪問清單,其中包括要在兩個通訊流(入站和出站)上捕獲的流量。
在此場景中,使用NBMA IP地址。
ip access-list extended filter
10 permit ip host 172.21.100.1 host 172.22.200.2
20 permit ip host 172.22.200.2 host 172.21.100.1
然後,配置fia-trace功能並將調試條件設定為使用訪問清單。最後,開始條件。
debug platform packet-trace packet 1024 fia-trace
debug platform condition ipv4 access-list filter both
debug platform condition start
- debug platform packet-trace packet <count> fia-trace:啟用詳細的fia跟蹤,在捕獲已配置的資料包數量後停止跟蹤。
- debug platform condition ipv4 access-list <ACL-NAME> both:使用之前配置的訪問清單在裝置上設定條件。
- debug platform condition start:啟動條件。
要檢視fia-trace的輸出,請使用以下命令。
show platform packet-trace statistics
show platform packet-trace summary
show platform packet-trace packet <number>
Spoke1 show platform packet-trace statistics output:
SPOKE1#show platform packet-trace statistics
Packets Summary
  Matched  18
  Traced   18
Packets Received
  Ingress  11
  Inject   7
    Count       Code  Cause
    4           2     QFP destination lookup
    3           9     QFP ICMP generated packet
Packets Processed
  Forward  7
  Punt     8
    Count       Code  Cause
    5           11    For-us data
    3           26    QFP ICMP generated packet
  Drop     3
    Count       Code  Cause
    3           8     Ipv4Acl
  Consume  0

          PKT_DIR_IN
             Dropped       Consumed       Forwarded
INFRA            0             0             0
TCP              0             0             0
UDP              0             0             5
IP               0             0             5
IPV6             0             0             0
ARP              0             0             0

         PKT_DIR_OUT
             Dropped       Consumed       Forwarded
INFRA            0             0             0
TCP              0             0             0
UDP              0             0             0
IP               0             0             0
IPV6             0             0             0
ARP              0             0             0
在show platform packet-trace statistics輸出中,可以看到裝置處理的資料包的計數器。這麼做可以看出inbound和outbound封包,並檢查裝置是否捨棄任何封包以及捨棄原因。
在圖中所示的輸出中,Spoke1正在丟棄某些描述為Ipv4Acl的資料包。要進一步分析這些資料包,可以使用show platform packet-trace summary命令。
Spoke1 show platform packet-trace summary output:
SPOKE1#show platform packet-trace summary
Pkt   Input                     Output                    State  Reason
0     Gi1                       internal0/0/rp:0          PUNT   11  (For-us data)
1     INJ.2                     Gi1                       FWD
2     Gi1                       internal0/0/rp:0          PUNT   11  (For-us data)
3     INJ.2                     Gi1                       FWD
4     Gi1                       internal0/0/rp:0          PUNT   11  (For-us data)
5     INJ.2                     Gi1                       FWD
6     Gi1                       internal0/0/rp:0          PUNT   11  (For-us data)
7     INJ.2                     Gi1                       FWD
8     Gi1                       internal0/0/rp:0          PUNT   11  (For-us data)
9     Gi1                       Gi1                       DROP   8   (Ipv4Acl)
10    Gi1                       internal0/0/recycle:0     PUNT   26  (QFP ICMP generated packet)
11    INJ.9                     Gi1                       FWD
12    Gi1                       Gi1                       DROP   8   (Ipv4Acl)
13    Gi1                       internal0/0/recycle:0     PUNT   26  (QFP ICMP generated packet)
14    INJ.9                     Gi1                       FWD
15    Gi1                       Gi1                       DROP   8   (Ipv4Acl)
16    Gi1                       internal0/0/recycle:0     PUNT   26  (QFP ICMP generated packet)
17    INJ.9                     Gi1                       FWD
18    Gi1                       Gi1                       DROP   8   (Ipv4Acl)
19    Gi1                       internal0/0/recycle:0     PUNT   26  (QFP ICMP generated packet)
20    INJ.9                     Gi1                       FWD
21    Gi1                       Gi1                       DROP   8   (Ipv4Acl)
22    Gi1                       internal0/0/recycle:0     PUNT   26  (QFP ICMP generated packet)
23    INJ.9                     Gi1                       FWD
24    Gi1                       Gi1                       DROP   8   (Ipv4Acl)
25    Gi1                       internal0/0/recycle:0     PUNT   26  (QFP ICMP generated packet)
26    INJ.9                     Gi1                       FWD
透過此輸出,您可以看到每個封包到達和離開裝置,以及輸入和輸出介面。系統還會顯示封包的狀態,並指明該封包是已轉送、捨棄還是已在內部處理(punt)。
在此範例中,此輸出有助於識別裝置捨棄的封包。使用命令show platform packet-trace packet <PACKET_NUMBER>,可以看到裝置如何處理該特定資料包。
Spoke1 show platform packet-trace packet <PACKET_NUMBER> 輸出:
SPOKE1#show platform packet-trace packet 9
Packet: 9 CBUG ID: 9
Summary
Input : GigabitEthernet1
Output : GigabitEthernet1
State : DROP 8 (Ipv4Acl)
Timestamp
Start : 366032715676920 ns (02/01/2024 04:30:15.708990 UTC)
Stop : 366032715714128 ns (02/01/2024 04:30:15.709027 UTC)
Path Trace
  Feature: IPV4(Input)
     Input : GigabitEthernet1
     Output : <unknown>
     Source : 172.22.200.2
     Destination : 172.21.100.1
     Protocol : 50 (ESP)
  Feature: DEBUG_COND_INPUT_PKT
     Entry : Input - 0x812707d0
     Input : GigabitEthernet1
     Output :
     Lapsed time : 194 ns
  Feature: IPV4_INPUT_DST_LOOKUP_ISSUE
     Entry : Input - 0x8129bf74
     Input : GigabitEthernet1
     Output :
     Lapsed time : 769 ns
  Feature: IPV4_INPUT_ARL_SANITY
     Entry : Input - 0x812725cc
     Input : GigabitEthernet1
     Output :
     Lapsed time : 307 ns
  Feature: EPC_INGRESS_FEATURE_ENABLE
     Entry : Input - 0x812782d0
     Input : GigabitEthernet1
     Output :
     Lapsed time : 6613 ns
  Feature: IPV4_INPUT_DST_LOOKUP_CONSUME
     Entry : Input - 0x8129bf70
     Input : GigabitEthernet1
     Output :
     Lapsed time : 272 ns
  Feature: STILE_LEGACY_DROP
     Entry : Input - 0x812a7650
     Input : GigabitEthernet1
     Output :
     Lapsed time : 278 ns
  Feature: INGRESS_MMA_LOOKUP_DROP
     Entry : Input - 0x812a1278
     Input : GigabitEthernet1
     Output :
     Lapsed time : 697 ns
  Feature: INPUT_DROP_FNF_AOR
     Entry : Input - 0x81297278
     Input : GigabitEthernet1
     Output :
     Lapsed time : 676 ns
  Feature: INPUT_FNF_DROP
     Entry : Input - 0x81280f24
     Input : GigabitEthernet1
     Output :
     Lapsed time : 1018 ns
  Feature: INPUT_DROP_FNF_AOR_RELEASE
     Entry : Input - 0x81297274
     Input : GigabitEthernet1
     Output :
     Lapsed time : 174 ns
  Feature: INPUT_DROP
     Entry : Input - 0x8126e568
     Input : GigabitEthernet1
     Output :
     Lapsed time : 116 ns
  Feature: IPV4_INPUT_ACL
     Entry : Input - 0x81271f70
     Input : GigabitEthernet1
     Output :
     Lapsed time : 12915 ns
在第一部分,您可以看到輸入和輸出介面,以及封包的狀態.接下來是輸出的第二部分,您可以在其中找到源IP地址和目標IP地址以及協定。
每個後續階段都顯示裝置如何處理此特定資料包。這樣可以深入瞭解網路地址轉換(NAT)或訪問清單等任何配置或可能影響該配置的其他因素。
在這種情況下,可以確定資料包的協定是ESP,源IP是Spoke2的NBMA IP地址,目標IP是Spoke1的NBMA IP地址。這表明這是NHRP協商中缺少的資料包。此外,還觀察到,在任何階段都沒有指定輸出介面,這表明有些內容在轉發流量之前影響了流量。在倒數第二階段,您可以看到裝置正在丟棄指定介面(GigabitEthernet1)上的入站流量。 最後一個階段顯示輸入存取清單,表示介面上的某些組態可能會造成捨棄。
注意:如果在使用本文檔中列出的所有故障排除工具後,協商中涉及的輻條未顯示它們正在丟棄或影響流量的任何跡象,則這些裝置的故障排除即告結束。
下一步必須是檢查它們之間的中間裝置,例如防火牆、交換機和ISP。
解決方案
如果出現這種情況,下一步是檢查前面輸出中顯示的介面。這包括檢查配置以驗證是否存在影響流量的內容。
WAN介面配置:
SPOKE1#show running-configuration interface gigabitEthernet1
Building configuration...

Current configuration : 150 bytes
!
interface GigabitEthernet1
ip address 172.21.100.1 255.255.255.0
ip access-group ESP_TRAFFIC in
negotiation auto
no mop enabled
no mop sysid
end
作為其配置的一部分,介面應用了訪問組。確認存取清單上設定的主機不會干擾用於NHRP交涉的流量,這非常重要。
SPOKE1#show access-lists ESP_TRAFFIC
Extended IP access list ESP_TRAFFIC
10 deny esp host 172.21.100.1 host 172.22.200.2
20 deny esp host 172.22.200.2 host 172.21.100.1 (114 matches)
30 permit ip any any (22748 matches)
訪問清單的第二個語句是拒絕Spoke2的NBMA IP地址與Spoke1的NBMA IP地址之間的通訊,導致以前看到的丟棄。從介面中刪除訪問組後,兩個分支之間的通訊成功:
SPOKE1#ping 192.168.2.2 source loopback1
Type escape sequence to abort.
Sending 5, 100-byte ICMP Echos to 192.168.2.2, timeout is 2 seconds:
Packet sent with a source address of 192.168.1.1
.!!!!
Success rate is 80 percent (4/5), round-trip min/avg/max = 1/2/3 ms
IPSEC通道已啟動,現在顯示兩台裝置上的封裝和解除封裝:
輻射點1:
SPOKE1#show crypto IPSEC sa peer 172.22.200.2

interface: Tunnel10
    Crypto map tag: Tunnel10-head-0, local addr 172.21.100.1

   protected vrf: (none)
   local  ident (addr/mask/prot/port): (172.21.100.1/255.255.255.255/47/0)
   remote ident (addr/mask/prot/port): (172.22.200.2/255.255.255.255/47/0)
   current_peer 172.22.200.2 port 500
     PERMIT, flags={origin_is_acl,}
    #pkts encaps: 6, #pkts encrypt: 6, #pkts digest: 6
    #pkts decaps: 7, #pkts decrypt: 7, #pkts verify: 7
    #pkts compressed: 0, #pkts decompressed: 0
    #pkts not compressed: 0, #pkts compr. failed: 0
    #pkts not decompressed: 0, #pkts decompress failed: 0
    #send errors 0, #recv errors 0

     local crypto endpt.: 172.21.100.1, remote crypto endpt.: 172.22.200.2
     plaintext mtu 1458, path mtu 1500, ip mtu 1500, ip mtu idb GigabitEthernet1
     current outbound spi: 0x9392DA81(2475874945)
     PFS (Y/N): N, DH group: none

     inbound esp sas:
      spi: 0xBF8F523D(3213840957)
        transform: esp-256-aes esp-sha256-hmac ,
        in use settings ={Transport, }
        conn id: 2073, flow_id: CSR:73, sibling_flags FFFFFFFF80000008, crypto map: Tunnel10-head-0
         sa timing: remaining key lifetime (k/sec): (4607998/28783)
        IV size: 16 bytes
        replay detection support: Y
        Status: ACTIVE(ACTIVE)

     inbound ah sas:

     inbound pcp sas:

     outbound esp sas:
      spi: 0x9392DA81(2475874945)
        transform: esp-256-aes esp-sha256-hmac ,
        in use settings ={Transport, }
        conn id: 2074, flow_id: CSR:74, sibling_flags FFFFFFFF80000008, crypto map: Tunnel10-head-0
         sa timing: remaining key lifetime (k/sec): (4607999/28783)
        IV size: 16 bytes
        replay detection support: Y
        Status: ACTIVE(ACTIVE)

     outbound ah sas:

     outbound pcp sas:
輻射點2:
SPOKE2#show crypto IPSEC sa peer 172.21.100.1

interface: Tunnel10
    Crypto map tag: Tunnel10-head-0, local addr 172.22.200.2

   protected vrf: (none)
   local  ident (addr/mask/prot/port): (172.22.200.2/255.255.255.255/47/0)
   remote ident (addr/mask/prot/port): (172.21.100.1/255.255.255.255/47/0)
   current_peer 172.21.100.1 port 500
     PERMIT, flags={origin_is_acl,}
    #pkts encaps: 7, #pkts encrypt: 7, #pkts digest: 7
    #pkts decaps: 6, #pkts decrypt: 6, #pkts verify: 6
    #pkts compressed: 0, #pkts decompressed: 0
    #pkts not compressed: 0, #pkts compr. failed: 0
    #pkts not decompressed: 0, #pkts decompress failed: 0
    #send errors 0, #recv errors 0

     local crypto endpt.: 172.22.200.2, remote crypto endpt.: 172.21.100.1
     plaintext mtu 1458, path mtu 1500, ip mtu 1500, ip mtu idb GigabitEthernet1
     current outbound spi: 0xBF8F523D(3213840957)
     PFS (Y/N): N, DH group: none

     inbound esp sas:
      spi: 0x9392DA81(2475874945)
        transform: esp-256-aes esp-sha256-hmac ,
        in use settings ={Transport, }
        conn id: 2073, flow_id: CSR:73, sibling_flags FFFFFFFF80000008, crypto map: Tunnel10-head-0
         sa timing: remaining key lifetime (k/sec): (4607998/28783)
        IV size: 16 bytes
        replay detection support: Y
        Status: ACTIVE(ACTIVE)

     inbound ah sas:

     inbound pcp sas:

     outbound esp sas:
      spi: 0xBF8F523D(3213840957)
        transform: esp-256-aes esp-sha256-hmac ,
        in use settings ={Transport, }
        conn id: 2074, flow_id: CSR:74, sibling_flags FFFFFFFF80000008, crypto map: Tunnel10-head-0
         sa timing: remaining key lifetime (k/sec): (4607999/28783)
        IV size: 16 bytes
        replay detection support: Y
        Status: ACTIVE(ACTIVE)

     outbound ah sas:

     outbound pcp sas:
現在,Spoke1的DMVPN表顯示兩個條目上的正確對映:
SPOKE1#show dmvpn

Legend: Attrb --> S - Static, D - Dynamic, I - Incomplete
        N - NATed, L - Local, X - No Socket
        T1 - Route Installed, T2 - Nexthop-override, B - BGP
        C - CTS Capable, I2 - Temporary
        # Ent --> Number of NHRP entries with same NBMA peer
        NHS Status: E --> Expecting Replies, R --> Responding, W --> Waiting
        UpDn Time --> Up or Down Time for a Tunnel
==========================================================================

Interface: Tunnel10, IPv4 NHRP Details
Type:Spoke, NHRP Peers:2,

# Ent  Peer NBMA Addr Peer Tunnel Add State  UpDn Tm Attrb
----- --------------- --------------- ----- -------- -----
     1 172.22.200.2     10.10.10.2     UP   00:01:31   D
     1 172.20.10.10     10.10.10.10    UP    1d05h     S
修訂記錄
| 修訂 | 發佈日期 | 意見 |
|---|---|---|
2.0 |
07-Mar-2025
|
已更新語法和格式。 |
1.0 |
12-Feb-2024
|
初始版本 |
由思科工程師貢獻
- Diana Aguilar MartinezCisco Security Technical Consulting Engineer
 意見
意見