WAAS - HTTP AO故障排除
章節:排除HTTP AO故障
本文介紹如何對HTTP AO進行故障排除。
主要文章
瞭解WAAS架構和流量
WAAS初步故障排除
故障排除最佳化
應用加速故障排除
排除CIFS AO故障
排除HTTP AO故障
排除EPM AO故障
排除MAPI AO故障
排除NFS AO故障
排除SSL AO故障
影片AO故障排除
通用AO故障排除
過載故障排除
WCCP故障排除
AppNav故障排除
磁碟和硬體故障排除
串列內聯群集故障排除
vWAAS故障排除
WAAS Express故障排除
排除NAM整合故障
目錄
HTTP加速器故障排除
HTTP加速器使用以下技術最佳化HTTP和HTTPS(4.3.1版及更高版本中)流量:
- 跨WAN重複使用TCP連線。避免對同一客戶端請求的後續HTTP連線進行連線設定懲罰。(不適用於HTTPS流量。)
- HTTP後設資料快取。將快取某些HTTP響應及其URL和後設資料資訊,以便邊緣WAE可以在本地響應對相同URL的後續請求。(僅在4.2.1版及更高版本中可用。) 快取響應的三種型別如下:
- 301永久重定向
- 304未修改
- 401需要授權
- HTTPS後設資料快取。將快取某些HTTPS響應及其URL和後設資料資訊,以便邊緣WAE能夠在本地響應對相同URL的後續請求。(僅在4.3.1版及更高版本中可用。)
- HTTP禁止伺服器編碼。從HTTP和HTTPS請求中刪除Accept-Encoding標頭,使伺服器無法向WAN傳送壓縮資料。這允許WAE應用自己的壓縮,通常可獲得更好的壓縮比。(僅在4.2.1及更高版本中提供。)
- DRE提示。提供對DRE模組的特定提示,以根據分析第7層負載提供的HTTP協定的其他知識更好地壓縮HTTP和HTTPS流量:
- 跳過標題:指示DRE模組不壓縮HTTP/HTTPS標頭,從而更好地壓縮對象。
- 刷新:指示DRE模組在完全處理HTTP/HTTPS事務後立即開始壓縮。
- 跳過LZ:指示DRE模組不將LZ壓縮應用於原始伺服器已壓縮的所有對象,從而減少CPU開銷。
可以單獨配置HTTP後設資料快取、抑制伺服器編碼和DRE提示功能。啟用HTTP AO時,TCP連線重複使用功能始終處於活動狀態,且僅適用於HTTP流量。
您可以使用show accelerator和show license命令驗證常規AO配置和狀態,如應用程式加速故障排除一文中所述。HTTP加速器操作需要企業許可證。
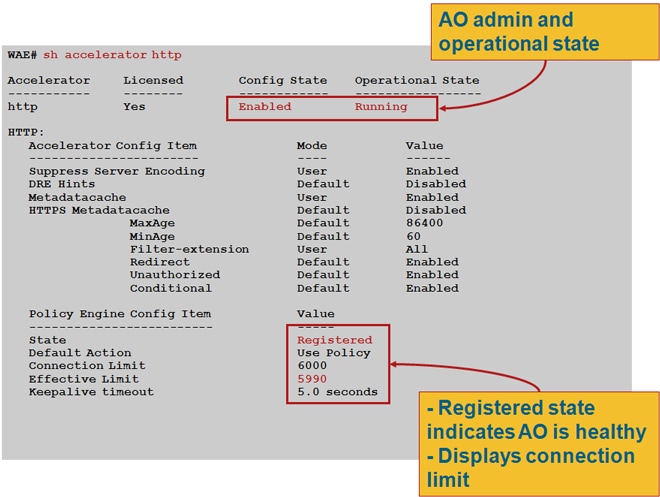
接下來,使用show accelerator http命令驗證特定於HTTP AO的狀態,如圖1所示。您想看到HTTP AO已啟用、正在運行和已註冊,並且顯示連線限制。如果Config State為Enabled,但Operational State為Shutdown,則表示存在許可問題。對於每個HTTP功能,顯示當前模式(使用者/預設)以及值(啟用、禁用或配置值)。 在4.2.1版中新增了Suppress Server Encoding和Metadatacache項,在4.3.1版中新增了DRE Hints和HTTPS Metadatacache項。
對於要通過SSL和HTTP AO進行最佳化的HTTPS流量,請確保啟用以下可選功能之一:HTTPS後設資料快取、suppress-server-encoding或DRE提示。
- 圖1.檢驗HTTP加速器狀態
使用show running-config命令以驗證HTTP/HTTPS流量策略是否正確配置以及啟用了哪些功能。您想要檢視加速http以執行Web應用程式操作,並且想要檢視HTTP分類器列出的相應匹配條件,如下所示:
WAE674# sh run | include HTTP

   accelerator http suppress-server-encoding enable                        <----- in 4.2.1 and later
   accelerator http metadatacache https enable                             <----- in 4.3.1 and later
   accelerator  http dre-hints enable                                      <----- in 4.3.1 and  later
                                                                                  at least one of these must be enabled

   classifier HTTP
   classifier HTTPS
      name Web classifier HTTP action optimize full accelerate http        <----- HTTP acceleration
      name Web classifier HTTPS action optimize DRE no compression none    <----- HTTPS static policy applies to traffic not
                                                                                  matching any SSL accelerated-services policy

WAE674# sh run | begin HTTP
...skipping
   classifier HTTP
      match dst port eq 80
      match dst port eq 8080
      match dst port eq 8000
      match dst port eq 8001
      match dst port eq 3128

WAE674# sh run | begin HTTPS
...skipping
   classifier HTTPS
      match dst port eq 443                                                <----- add here any nondefault HTTPS port
檢視HTTP統計資訊
使用show statistics accelerator http命令檢視以下統計資訊:
- HTTP AO節省了多少時間。您可以看到整個HTTP AO節省的總時間或每個功能節省的時間:
- 通過快速連線重複使用節省的時間
- 三個後設資料快取節省的時間
- 後設資料快取的快取命中/未命中數
- 對HTTP請求應用禁止伺服器編碼的次數
- 根據HTTP標頭的內容提供DRE提示的次數
- 已處理的HTTP事務(請求+響應)數
- HTTP標頭處理中的錯誤數
- 快取重新驗證數
WAE674# sh stat accel http

HTTP:
  Global Statistics
  -----------------
  Time Accelerator was started:                                      Tue Apr 6 06:04:06 2010
  Time Statistics were Last Reset/Cleared:                           Tue Apr 6 06:04:06 2010
  Total Handled Connections:                                         3743984
  Total Optimized Connections:                                       3743984
  Total Connections Handed-off with Compression Policies Unchanged:  0
  Total Dropped Connections:                                         0
  Current Active Connections:                                        48
  Current Pending Connections:                                       0
  Maximum Active Connections:                                        176
  Total Time Saved (ms):                                             35584437   <-----Should be incrementing
  Current Active Connections Free For Fast Connection Use:           2
  Total Connections Handed-off:                                      0
  Total Connections Handed-off with Compression Policies Disabled:   0
  Total Connections Handed-off to SSL:                               0
  Total Connection Hand-off Failures:                                0
  Total Fast Connection Successes:                                   3617244    <-----Should be incrementing
  Total Fast Connection Failures:                                    0
  Maximum Fast Connections on a Single Connection:                   100
  Total CONNECT Requests with Incomplete Message:                    0
  Percentage of Connection Time Saved:                               37
  Total Round Trip Time For All Connections (ms):                    4922767377
  Total Fast Connections Initiated by Peer:                          0
  Total SYN Timeouts:                                                0
  Total Time for Metadata Cache Miss (ms):                           2          <-----Output from here is in 4.2.1 and later only
  RTT saved by Redirect Metadata Cache (ms):                         5988       <-----Should be incrementing
  RTT saved by Authorization Redirect Metadata Cache (ms):           345        <-----Should be incrementing
  RTT saved by Content Refresh Check Metadata Cache (ms):            44987      <-----Should be incrementing
  Total Time Saved by Fast Connection Use (ms):                      456
  Total Locally Served Redirect Responses:                           453        <-----Should be incrementing
  Total Locally Served Unauthorized Responses:                       56         <-----Should be incrementing
  Total Locally Served Conditional Responses:                        4932       <-----Should be incrementing
  Total Remotely Served Redirect Responses:                          0
  Total Remotely Served Unauthorized Responses:                      0
  Total Remotely Served Conditional Responses:                       1
  Total Requests with URL Longer than 255 Characters:                0
  Total Requests with HTTP Pipelining:                               0
  Total Transactions Handled:                                        2          <-----Total number of HTTP transactions processed
  Total Server Compression Suppression:                              1          <-----Total number of Accept-Encoding removed
  Total Requests Requiring Server Content-Revalidation:              0
  Total Responses not to be Cached:                                  0
  Total Connections Expecting Authentication:                        0
  Total Connections with Unsupported HTTP Requests:                  0
  Total Connections with Unsupported HTTP Responses:                 0
  Total Hints Sent to DRE Layer to Flush Data:                       2
  Total Hints Sent to DRE Layer to Skip LZ:                          0
  Total Hints Sent to DRE Layer to Skip Header Information:          1
如果上述輸出中的Total Time Saved計數器沒有遞增或非常小,則表明HTTP AO未提供多少好處。如果三個後設資料快取中的一個所節省的總時間沒有增加或非常少,則表明相應的後設資料快取並沒有提供很多好處。
Total Server Compression Suppression計數器指示已刪除Accept-Encoding標頭的次數,以嘗試通過WAE裝置提供更好的壓縮。傳送到DRE層計數器的總提示指示每個DRE提示(刷新資料、跳過LZ、跳過報頭)已向DRE模組發出多少次,以嘗試更好地壓縮資料。
要在4.2.1及更高版本中檢視Central Manager中的類似資訊,請選擇WAE裝置,然後選擇Monitor > Acceleration > HTTP Acceleration Report,然後選擇Details頁籤以檢視以下圖表:
- 節省HTTP響應時間(快速連線重用、重定向、有條件快取和未授權快取)
- HTTP最佳化計數(已應用上述每個最佳化的次數)
- HTTP最佳化技術(適用於所有HTTP最佳化,包括後設資料快取、連線重用、DRE提示和抑制伺服器編碼)
要檢視有關HTTP報頭分析和錯誤條件的調試資訊,請使用show statistics accelerator http debug命令(在4.3.1及更高版本中)確定以下內容:
- 快取的301、304和401響應的數量
- HTTP標頭、版本和方法的數量
- 未快取HTTP響應的原因
- 正在快取的HTTP響應的總數
- 未從本地快取提供HTTP請求的原因
使用show statistics connection optimized http命令檢查WAAS裝置是否正在建立最佳化的HTTP連線。驗證HTTP連線的「Accel」列中是否出現「H」,這表示已使用HTTP AO,如下所示:
WAE674# sh stat conn opt http
Current Active Optimized Flows:                      2
   Current Active Optimized TCP Plus Flows:          2
   Current Active Optimized TCP Only Flows:          0
   Current Active Optimized TCP Preposition Flows:   0
Current Active Auto-Discovery Flows:                 0
Current Active Pass-Through Flows:                   0
Historical Flows:                                    100
D:DRE,L:LZ,T:TCP Optimization,
A:AOIM,C:CIFS,E:EPM,G:GENERIC,H:HTTP,M:MAPI,N:NFS,S:SSL,V:VIDEO
ConnID  Source IP:Port        Dest IP:Port          PeerID             Accel
5929    10.10.10.10:3446      10.10.100.100:80      00:14:5e:84:24:5f  THDL      <-------Look for "H"
可以使用show statistics connection closed http命令檢查已關閉連線的連線統計資訊。
要檢視Central Manager中的類似資訊,請選擇WAE裝置,然後選擇Monitor > Optimization > Connections Statistics。
- 圖2.使用HTTP的連線統計資訊報告
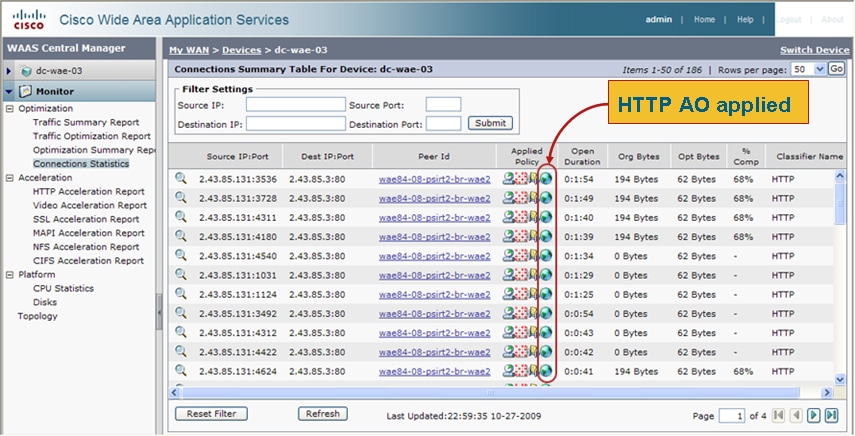
在Connection Statistics報告中,Applied Policy列中的全域性圖示顯示HTTP AO用於連線。(將游標置於圖示上以檢視其含義。)
您可以使用show statistics connection optimized http detail命令檢視HTTP連線統計資訊。在輸出中查詢「Fast connections」計數器。此計數器的正值表示HTTP AO通過重複使用持久連線來使客戶端受益,從而減少延遲。
WAE674# show stat conn opt http detail
Connection Id:            1496
   Peer Id:                  00:14:5e:84:24:5f
   Connection Type:          EXTERNAL CLIENT
   Start Time:               Wed Jul 15 05:09:52 2009
   Source IP Address:        10.10.10.10
   Source Port Number:       1760
   Destination IP Address:   10.10.100.100
   Destination Port Number:  80
   Application Name:         Web                               <-----Should see Web
   Classifier Name:          HTTP                              <-----Should see HTTP
   Map Name:                 basic
   Directed Mode:            FALSE
   Preposition Flow:         FALSE
   Policy Details:
          Configured:        TCP_OPTIMIZE + DRE + LZ
             Derived:        TCP_OPTIMIZE + DRE + LZ
                Peer:        TCP_OPTIMIZE + DRE + LZ
          Negotiated:        TCP_OPTIMIZE + DRE + LZ
             Applied:        TCP_OPTIMIZE + DRE + LZ
   Accelerator Details:
               Configured:   HTTP                              <-----Should see HTTP configured
                  Derived:   HTTP
                  Applied:   HTTP                              <-----Should see HTTP applied
                     Hist:   None

                                               Original            Optimized
                                   -------------------- --------------------
   Bytes Read:                                      266               139160
   Bytes Written:                                 82686                  128
. . .
HTTP : 1496

  Time Statistics were Last Reset/Cleared:                           Wed Jul 15
05:09:52 2009
  Total Bytes Read:                                                  3269
56367
  Total Bytes Written:                                               3269
56367
  Total Bytes Buffered:                                              0
0
  Total Internal Bytes Read:                                         92
  Total Internal Bytes Written:                                      92
  Bit Flags for I/O state:                                           1040
  Internal object pointer:                                           2046823200

  Fast connections:                                                  11        <-----Reused connections
. . .
檢視HTTPS統計資訊
(本節僅適用於4.3.1版及更高版本。)
使用show statistics accelerator http https命令檢視以下統計資訊:
- HTTP AO為HTTPS流量節省的時間。您可以看到整個HTTPS後設資料快取所節省的總時間,或者三個後設資料快取中的每一個所節省的時間
- 後設資料快取的快取命中/未命中數
- 對HTTPS請求應用禁止伺服器編碼的次數
- 根據HTTPS標頭內容提供DRE提示的次數
- 已處理的HTTPS事務(請求+響應)數
- HTTPS標頭處理中的錯誤數
- 快取重新驗證數
WAE674# sh stat accel http https

  HTTPS Statistics
  -----------------
  Total Optimized HTTPS Connections:                                 10     <-----Should be  incrementing
  Total Handled HTTPS Connections:                                   10     <-----Should be  incrementing
  Total Active HTTPS Connections:                                     2
  Total Proxy-Connect HTTPS Connections:                              0
  Total Proxy-Connect HTTPS Insert Failures:                          0
  RTT saved by HTTPS Content Refresh Check Metadata Cache - (ms):    44     <-----Should be incrementing
  RTT saved by HTTPS Redirect Metadata Cache - (ms):                 10     <-----Should be incrementing
  RTT saved by HTTPS Authorization Required Metadata Cache - (ms):    5     <-----Should be incrementing
  Total Locally Served HTTPS Conditional Responses:                  44     <-----Should be incrementing
  Total Locally Served HTTPS Redirect Responses:                     10     <-----Should be incrementing
  Total Locally Served HTTPS Unauthorized Responses:                  5     <-----Should be incrementing
  Total Remotely Served HTTPS Conditional Responses:                 32
  Total Remotely Served HTTPS Redirect Responses:                     2
  Total Remotely Served HTTPS Unauthorized Responses:                 1
  Total Hints Sent to DRE Layer to Skip Header Information - HTTPS: 121
  Total Hints Sent to DRE Layer to Flush Data - HTTPS:              121
  Total Hints Sent to DRE Layer to Skip LZ - HTTPS:                   0
  Total Server Compression Suppression - HTTPS:                     110
  Total Time Saved from all HTTPS metadata cache hits:               59     <-----Should be incrementing
  Total Time HTTPS Cache Miss:                                        4
  Total HTTPS Requests Requiring Server Content-Revalidation:        32
  Total HTTPS Responses not to be Cached:                             0
  Total HTTPS Connections Bypassed due to URL Based Bypass List:      0
  Total HTTPS Connections Bypassed due to IP Based Bypass List:       0
如果上述輸出中的Total Time Saved計數器沒有增加或非常小,則表明HTTP AO沒有為HTTPS流量提供太多好處。如果三個後設資料快取中的一個所節省的總時間沒有增加或非常少,則表明相應的後設資料快取並沒有提供很多好處。
Total Server Compression Suppression計數器指示從HTTPS請求中刪除接受編碼標頭的次數,以嘗試由WAE裝置提供更好的壓縮。傳送到DRE層計數器的總提示指示每個DRE提示(刷新資料、跳過LZ、跳過報頭)已向DRE模組發出多少次,以嘗試更好地壓縮資料。
要在4.3.1及更高版本中檢視Central Manager中的類似資訊,請選擇WAE裝置,然後選擇Monitor > Acceleration > HTTPS Acceleration Report,然後選擇Details頁籤以檢視以下圖表:
- HTTPS響應時間節省(重定向、有條件快取和未授權快取)
- HTTPS最佳化計數(已應用上述每個最佳化的次數)
- HTTPS最佳化技術(適用於所有HTTPS最佳化,包括後設資料快取、DRE提示和抑制伺服器編碼)
要檢視有關HTTPS報頭分析和錯誤條件的調試資訊,請使用show statistics accelerator http debug命令確定以下內容:
- 快取的301、304和401響應的數量
- HTTP標頭、版本和方法的數量
- 未快取HTTP響應的原因
- 正在快取的HTTP響應的總數
- 未從本地快取提供HTTP請求的原因
使用show statistics connection optimized http命令檢查WAAS裝置是否正在建立最佳化的HTTPS連線。驗證HTTPS連線的「Accel」列中是否同時顯示「H」和「S」,這表示已使用HTTP和SSL AO,如下所示:
WAE674# sh stat conn opt  http
Current  Active Optimized Flows:                      2
   Current  Active Optimized TCP Plus Flows:          2
   Current  Active Optimized TCP Only Flows:          0
   Current  Active Optimized TCP Preposition Flows:   0
Current  Active Auto-Discovery  Flows:                 0
Current Active Pass-Through Flows:                    0
Historical Flows:                                     100
D:DRE,L:LZ,T:TCP Optimization,
A:AOIM,C:CIFS,E:EPM,G:GENERIC,H:HTTP,M:MAPI,N:NFS,S:SSL,V:VIDEO
ConnID   Source IP:Port        Dest IP:Port          PeerID             Accel
5929     10.10.10.10:3446      10.10.100.100:80      00:14:5e:84:24:5f  THSDL      <-------Look for "H" and "S"
可以使用show statistics connection closed http或show statistics connection closed ssl命令檢查已關閉連線的連線統計資訊。
要檢視Central Manager中的類似資訊,請選擇WAE裝置,然後選擇Monitor > Optimization > Connections Statistics。
- 圖3.使用HTTP和SSL的連線統計資訊報告
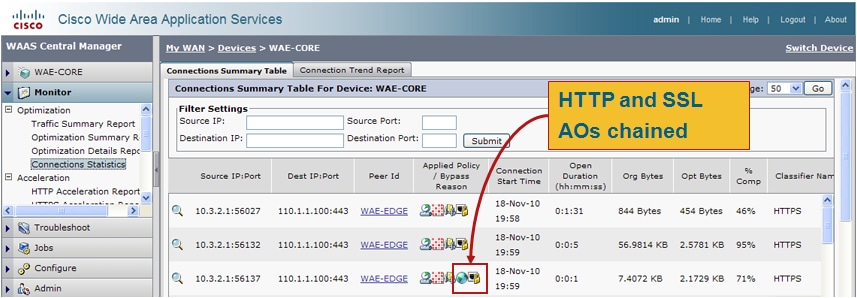
在Connection Statistics報告中,Applied Policy列中的全域性圖示顯示HTTP AO用於連線,鎖圖示表示已應用SSL AO。(將游標置於圖示上以檢視其含義。)
您可以使用show statistics connection optimized http detail和show statistics connection optimized ssl detail命令檢視HTTPS連線統計資訊。
WAE674# show stat conn opt http detail
Connection  Id:            34
   Peer Id:                  00:14:5e:cd:9c:c9
   Connection Type:          EXTERNAL CLIENT
   Start Time:               Thu Oct 28 14:47:56 2010
   Source IP Address:        10.3.2.1
   Source Port Number:       40829
   Destination IP Address:   110.1.1.100
   Destination Port Number:  443
   Application Name:         SSL                          <-----Should see SSL
   Classifier Name:          HTTPS                        <-----Should see HTTPS
   Map Name:                 basic
   Directed Mode:            FALSE
   Preposition Flow:         FALSE
   Policy Details:
          Configured:        TCP_OPTIMIZE
             Derived:        TCP_OPTIMIZE
                Peer:        TCP_OPTIMIZE
          Negotiated:        TCP_OPTIMIZE + DRE + LZ
             Applied:        TCP_OPTIMIZE + DRE + LZ
   Accelerator Details:
               Configured:   None
                  Derived:   None
                  Applied:   HTTP,SSL                     <-----Should see HTTP and SSL applied
                     Hist:   None


                                   Original            Optimized
                       -------------------- --------------------
   Bytes Read:                         5162                21874
   Bytes Written:                   1977819                 5108

   Total Reduction Ratio: 98.639%


HTTP : 34

  Time Statistics were Last Reset/Cleared:                           Thu Oct 28
14:47:56 2010
  Total Bytes Read:                                                  4620
1972570
  Total Bytes Written:                                               4620
1972570
. . .
SSL : 34

  Time Statistics were Last Reset/Cleared:                           Thu Oct 28
14:47:56 2010
  Total Bytes Read:                                                  0
0
  Total Bytes Written:                                               0
0
 . . .

  Hostname in HTTP CONNECT:                                     <------ the last three counters apply only to
  IP Address in HTTP CONNECT:                                           Proxy Connect type of HTTPS connections
  TCP Port in HTTP CONNECT:
檢視HTTP後設資料快取
要顯示三個HTTP後設資料快取(重定向、條件快取和未經授權)的內容,請使用show cache http-metadatacache all命令。僅顯示完整的URL和過期時間(以秒為單位)。您也可以使用以下命令分別顯示三個快取中的每一個快取的內容:
- show cache http-metadatacache redirect-response
- show cache http-metadatacache conditional-response
- show cache http-metadatacache unauthorized-response
上述命令的典型輸出如下:
Redirect Cache
Active entries: 1, Max Entries: 1500
URL: www.abcnews.com/, Expiration (sec): 3206
Conditional Cache
Active entries: 6, Max Entries: 10500
URL: www.cisco.com/web/fw/i/quicklinks-rnd-corners.gif, Expiration (sec): 3594
URL: www.cisco.com/web/fw/i/hp-sprites.gif, Expiration (sec): 3594
URL: www.cisco.com/en/US/home/images/ba-actsGreen-logo.jpg, Expiration (sec): 3594
URL: www.cisco.com/en/US/home/images/fp-eos3.jpg, Expiration (sec): 3594
URL: www.cisco.com/en/US/home/images/fp-AP541n.jpg, Expiration (sec): 3594
URL: www.cisco.com/web/fw/c/home.min.css, Expiration (sec): 3592
Unauthorized Cache
Active entries: 1, Max Entries: 3000
URL: l.yimg.com/index.html, Expiration (sec): 86393
您可以使用clear cache http-metadatacache all指令清除三個快取的內容。
如果要單獨清除每個快取記憶體的內容,可以使用以下命令:
- clear cache http-metadatacache redirect-response
- clear cache http-metadatacache conditional-response
- clear cache http-metadatacache unauthorized-response
如果要指定要刪除的URL,可以使用以下命令:
clear cache http-metadatacache {all|redirect|conditional|unauthorized} URL
檢視HTTPS後設資料快取
要顯示三種HTTPS後設資料快取(重定向、條件性和未授權)中的條目數,請使用show cache http-metadatacache https命令。與HTTP後設資料快取的相應命令不同,URL和過期時間不會顯示。您也可以使用以下命令分別顯示三個快取記憶體的條目數:
- show cache http-metadatacache https redirect-response
- show cache http-metadatacache https conditional-response
- show cache http-metadatacache https unauthorized-response
上述命令的典型輸出如下:
HTTPS Redirect Cache
Active HTTP entries: 0, Active HTTPS entries: 0 Max Entries: 3250
HTTPS Conditional Cache
Active HTTP entries: 0, Active HTTPS entries: 11 Max Entries: 22750
HTTPS Unauthorized Cache
Active HTTP entries: 0, Active HTTPS entries: 0 Max Entries: 6500
您可以使用clear cache http-metadatacache https指令清除三個快取的內容。
如果要單獨清除每個快取記憶體的內容,可以使用以下命令:
- clear cache http-metadatacache https redirect-response
- clear cache http-metadatacache https conditional-response
- clear cache http-metadatacache https unauthorized-response
後設資料快取快取控制行為
對於HTTP和HTTPS(4.3.1版)304響應,後設資料快取遵循所有快取控制指令(快取控制:no-cache、no-store、private、must-revalidate、proxy-revalidate、max-age=0、Pragma:無快取)。 有一個選項可以禁用此類快取控制檢查,這意味著所有304個包含指定不可快取性的快取控制標頭的響應都會被快取,並且所有包含指定不可快取性的快取控制標頭的請求都可以從本地快取中提供。
了解禁用快取控制檢查可能會增加後設資料快取的優點,因為某些瀏覽器或Web伺服器可能有一個預設選項,在所有響應中包括一個快取控制標頭,以便通過原始伺服器強制重新驗證對象。這將使後設資料快取對304個響應無效。
此選項可以獨立控制HTTP/S請求(快取查詢)和響應(快取插入)。
要禁用對HTTP/S 304請求的快取控制檢查,請使用以下命令:
WAE#accelerator http metadatacache request-ignore-no-cache enable
此命令強制後設資料快取忽略HTTP/S 304請求中的所有快取控制指令。(此命令的預設[no]形式強制後設資料快取執行HTTP/S 304請求中的所有快取控制指令。)
要禁用對HTTP/S 304響應的快取控制檢查,請使用以下命令:
WAE#accelerator http metadatacache response-ignore-no-cache enable
此命令強制後設資料快取忽略HTTP/S 304響應中的所有快取控制指令。(此命令的預設[no]形式強制後設資料快取執行HTTP/S 304響應中的所有快取控制指令。)
後設資料快取對301和401響應使用快取控制標頭。如果響應具有任何Cache-Control標頭(no-cache、no-store、private、must-revalidate、proxy-revalidate、max-age=0、Pragma:no-cache),則不對其進行快取。
後設資料快取異常
快取的內容存在某些例外。當HTTP AO遇到正在處理的HTTP/S請求/響應中的以下條件之一時,不會發生快取記憶體插入或查詢:
- 非RFC投訴請求和響應:報頭格式錯誤/無效、報頭重複、缺少報頭、意外正文、意外的分塊編碼
- URL大小超過255個字元
- HTTP管道化事務
- WebDav方法
- HEAD方法
- 具有cookie標頭的301/401響應
- 總報頭長度超過768位元組的301個響應
- 總報頭長度超過384位元組的401個響應
- 401個帶有分塊主體的響應
- 401個響應使用了不受支援的身份驗證方法(支援的方法包括:基本、NTLM、協商、Kerberos、摘要、Oauth)
- 可用於處理的部分HTTP報頭(報頭拆分)
HTTP AO記錄
以下日誌檔案可用於排除HTTP AO問題:
- 事務日誌檔案:/local1/logs/tfo/working.log(和/local1/logs/tfo/tfo_log_*.txt)
- 調試日誌檔案:/local1/errorlog/httpao-errorlog.current(和httpao-errorlog.*)
為了更輕鬆地進行調試,您應該首先設定ACL以限制資料包只訪問一台主機。
WAE674(config)# ip access-list extended 150 permit tcp host 10.10.10.10 any
WAE674(config)# ip access-list extended 150 permit tcp any host 10.10.10.10
要啟用事務日誌記錄,請使用transaction-logs configuration命令,如下所示:
wae(config)# transaction-logs flow enable
wae(config)# transaction-logs flow access-list 150
可以使用type-tail命令檢視事務日誌檔案的結尾,如下所示:
wae# type-tail tfo_log_10.10.11.230_20090715_130000.txt
Wed Jul 15 13:37:00 2009 :1529 :10.10.10.10 :2004 :10.10.100.100 :80 :OT :END :EXTERNAL CLIENT :(HTTP) :0 :0 :107 :117
Wed Jul 15 13:37:00 2009 :1529 :10.10.10.10 :1880 :10.10.100.100 :80 :SODRE :END  :14357 :8406 :2181 :2761 :0
Wed Jul 15 13:38:19 2009 :1533 :10.10.10.10 :2008 :10.10.100.101 :135 :OT :START :EXTERNAL CLIENT :00.14.5e.84.24.5f :basic
 :Other :MS-EndPointMapper :F :(TFO) (TFO) (TFO) (TFO) (TFO) :<None> :(EPM) (EPM) (EPM) :<None> :<None>  :0 :120
Wed Jul 15 13:38:19 2009 :1534 :10.10.10.10 :2009 :10.10.100.101 :1025 :OT :START :EXTERNAL CLIENT :00.14.5e.84.24.5f
 :uuide3514235-4b06-11d1-ab04-00c04fc2dcd2
要設定和啟用HTTP AO的調試日誌記錄,請使用以下命令。
附註:調試日誌記錄是CPU密集型,可以生成大量輸出。在生產環境中慎重而謹慎地使用它。
您可以對磁碟啟用詳細日誌記錄:
WAE674(config)# logging disk enable
WAE674(config)# logging disk priority detail
您可以在ACL中為連線啟用偵錯記錄:
WAE674# debug connection access-list 150
HTTP AO調試(4.2.1及更高版本)的選項如下:
WAE674# debug accelerator http ?
 all                       enable all HTTP accelerator debugs
 bypass-list               enable HTTP bypass-list debugs
 cli                       enable HTTP CLI debugs
 conditional-response      enable HTTP metadatacache conditional (304) response
                           debugs
 connection                enable HTTP connection debugs
 dre-hints                 enable HTTP dre-hints debugs
 metadatacache             enable HTTP metadatacache debugs
 prefetch                  enable HTTP prefetch debugs
 redirect-response         enable HTTP metadatacache redirect (301) response
                           debugs
 shell                     enable HTTP shell debugs
 suppress-server-encoding  enable HTTP suppress-server-encoding debugs
 transaction               enable HTTP transaction debugs
 unauthorized-response     enable HTTP auth-optimization debugs bugs
您可以為HTTP連線啟用調試日誌記錄,然後按如下方式顯示調試錯誤日誌的結束:
WAE674# debug accelerator http connection
WAE674# type-tail errorlog/httpao-errorlog.current follow
 意見
意見