- Preface
- Chapter 1 - Product Overview
- Chapter 2 - Preparing for Installation
- Chapter 3 - Installing the Client Adapter
- Chapter 4 - Enabling Security Features
- Chapter 5 - Advanced Configuration
- Chapter 6 - Performing Diagnostics
- Chapter 7 - Routine Procedures
- Chapter 8 - Troubleshooting
- Appendix A - Technical Specifications
- Appendix B - Translated Safety Warnings
- Appendix C - Declarations of Conformity and Regulatory Information
- Appendix D - Channels, Power Levels, and Antenna Gains
- Appendix E - Performing a Site Survey
- Glossary
- Index
Cisco Aironet Wireless LAN Client Adapters Installation and Configuration Guide for Windows CE, OL-1375-02
Bias-Free Language
The documentation set for this product strives to use bias-free language. For the purposes of this documentation set, bias-free is defined as language that does not imply discrimination based on age, disability, gender, racial identity, ethnic identity, sexual orientation, socioeconomic status, and intersectionality. Exceptions may be present in the documentation due to language that is hardcoded in the user interfaces of the product software, language used based on RFP documentation, or language that is used by a referenced third-party product. Learn more about how Cisco is using Inclusive Language.
- Updated:
- May 4, 2007
Chapter: Chapter 6 - Performing Diagnostics
Performing Diagnostics
This chapter explains how to use the client utilities to perform user-level diagnostics.
The following topics are covered in this chapter:
•![]() Overview of the Diagnostic Utilities
Overview of the Diagnostic Utilities
•![]() Viewing the Current Status of Your Client Adapter
Viewing the Current Status of Your Client Adapter
•![]() Viewing Statistics for Your Client Adapter
Viewing Statistics for Your Client Adapter
Overview of the Diagnostic Utilities
The diagnostic utilities enable you to assess the performance of your client adapter within the wireless network. These utilities perform the following functions:
•![]() Display your client adapter's current status
Display your client adapter's current status
•![]() Display statistics pertaining to your client adapter's transmission and reception of data
Display statistics pertaining to your client adapter's transmission and reception of data
Viewing the Current Status of Your Client Adapter
The Cisco Link Status (CLS) utility enables you to view the current status of your client adapter.
Step 1 ![]() To view your client adapter's status, select Start > Programs > Cisco > Cisco Link Status. The Cisco Link Status screen appears (see Figure 6-1).
To view your client adapter's status, select Start > Programs > Cisco > Cisco Link Status. The Cisco Link Status screen appears (see Figure 6-1).
Figure 6-1 Cisco Link Status Screen
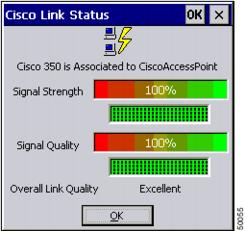
Table 6-1 interprets each element of the Cisco Link Status screen.
Step 2 ![]() Click OK to exit the utility.
Click OK to exit the utility.
Viewing Statistics for Your Client Adapter
The Client Statistics Utility (CSU) enables you to view statistics that indicate how data is being received and transmitted by your client adapter. It also shows message integrity check (MIC) statistics if your client adapter's driver and firmware support MIC and MIC is enabled on the access point.

Note ![]() The receive and transmit statistics are host statistics. That is, they show packets and errors received or sent by the Windows CE device. Link status tests from the access point or SST are performed at the firmware level; therefore, they have no effect on the statistics shown by this utility.
The receive and transmit statistics are host statistics. That is, they show packets and errors received or sent by the Windows CE device. Link status tests from the access point or SST are performed at the firmware level; therefore, they have no effect on the statistics shown by this utility.
Step 1 ![]() To view your client adapter's statistics, select Start > Programs > Cisco > Client Statistics Utility. The Receive Statistics screen appears (see Figure 6-2).
To view your client adapter's statistics, select Start > Programs > Cisco > Client Statistics Utility. The Receive Statistics screen appears (see Figure 6-2).
Figure 6-2 Receive Statistics Screen
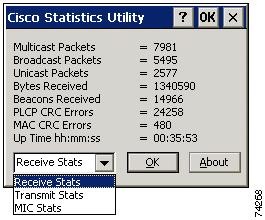
The statistics are calculated as soon as your client adapter is started.
Table 6-2 describes each receive statistic that is displayed for your client adapter.
Step 2 ![]() To view the transmit statistics for your client adapter, click the drop-down arrow in the bottom left corner of the screen and select Transmit Stats. The Transmit Statistics screen appears (see Figure 6-3).
To view the transmit statistics for your client adapter, click the drop-down arrow in the bottom left corner of the screen and select Transmit Stats. The Transmit Statistics screen appears (see Figure 6-3).
Figure 6-3 Transmit Statistics Screen
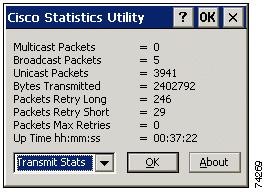
Table 6-3 describes each transmit statistic that is displayed for your client adapter.
Step 3 ![]() To view the MIC statistics for your client adapter, click the drop-down arrow in the bottom left corner of the screen and select MIC Stats. The MIC Statistics screen appears (see Figure 6-4).
To view the MIC statistics for your client adapter, click the drop-down arrow in the bottom left corner of the screen and select MIC Stats. The MIC Statistics screen appears (see Figure 6-4).
Note ![]() The MIC Stats option is available only if your client adapter's driver and firmware support MIC and MIC is enabled on the access point. See "Message Integrity Check (MIC)" section for additional information.
The MIC Stats option is available only if your client adapter's driver and firmware support MIC and MIC is enabled on the access point. See "Message Integrity Check (MIC)" section for additional information.
Figure 6-4 MIC Statistics Screen
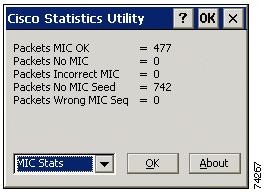
Table 6-4 describes each MIC statistic that is displayed for your client adapter.
Step 4 ![]() Click OK to exit the utility.
Click OK to exit the utility.
 Feedback