- Preface
- Overview
- Preparing for Installation
- Installing the Driver, Client Utility, and Client Adapter
- Security Features
- Advanced Configuration on Mac OS 9.x
- Advanced Configuration on Mac OS X
- Performing Diagnostics
- Routine Procedures
- Troubleshooting
- Technical Specifications
- Translated Safety Warnings
- Declarations of Conformity and Regulatory Information
- Channels and Antenna Settings
- Positioning Wireless Devices
- Glossary
- Index
Cisco Aironet Wireless LAN Client Adapters Installation and Configuration Guide for Mac OS, OL-1377-02
Bias-Free Language
The documentation set for this product strives to use bias-free language. For the purposes of this documentation set, bias-free is defined as language that does not imply discrimination based on age, disability, gender, racial identity, ethnic identity, sexual orientation, socioeconomic status, and intersectionality. Exceptions may be present in the documentation due to language that is hardcoded in the user interfaces of the product software, language used based on RFP documentation, or language that is used by a referenced third-party product. Learn more about how Cisco is using Inclusive Language.
- Updated:
- May 4, 2007
Chapter: Performing Diagnostics
Performing Diagnostics
This chapter describes the client utility tools that enable you to assess the operation and performance of the client adapter and the wireless network.
The following topics are covered in this chapter:
•![]() Diagnostic Tools for Mac OS 9.x
Diagnostic Tools for Mac OS 9.x
•![]() Diagnostic Tools for Mac OS X
Diagnostic Tools for Mac OS X
Diagnostic Tools for Mac OS 9.x
In addition to enabling you to configure your client adapter for use in various types of networks, the pcm3x0PPC client utility provides tools that enable you to assess the performance of the client adapter and other devices on the wireless network. ACU diagnostic tools perform the following functions:
•![]() Display your client adapter's current status and configured settings
Display your client adapter's current status and configured settings
•![]() Display statistics pertaining to your client adapter's transmission and reception of data
Display statistics pertaining to your client adapter's transmission and reception of data
•![]() Display the link status meter or run an RF link test to assess the performance of the RF link between your client adapter and its associated access point
Display the link status meter or run an RF link test to assess the performance of the RF link between your client adapter and its associated access point
Viewing the Current Status of Your Client Adapter
The pcm3x0PPC client utility enables you to view the current status of your client adapter as well as all of the settings configured for the adapter.
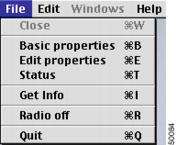
To view your client adapter's status and settings, select Status from the File pull-down menu (see Figure 7-1) and the Link Status tab.

Note ![]() Up to four Status screens can be open at a time.
Up to four Status screens can be open at a time.
Figure 7-1 File Pull-Down Menu
The Status Screen appears (see Figure 7-2).
Figure 7-2 Status Screen
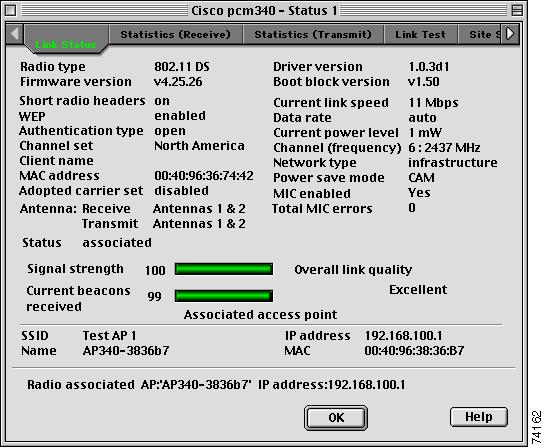
Table 7-1 describes each client adapter setting for which a status is displayed.
|
|
|
|---|---|
Radio Type |
A description of your client adapter's radio. For example, 802.11 DS indicates that the radio is an IEEE 802.11-compliant direct-sequence spread spectrum radio. |
Firmware Version |
The version of the firmware that is currently running on your client adapter. |
Driver Version |
The version of the driver that is currently installed on your computer. |
Boot Block Version |
The version of the boot block firmware that is currently in your client adapter. The boot block firmware contains identification information for the client adapter and functions to start up the radio and pass control to the main firmware, which (unlike the boot block) can be modified and upgraded by the user. |
Short Radio Headers |
Indicates whether your client adapter is set up to use short radio. headers. Value: On, Off, or Unknown Note |
WEP |
Your client adapter's current WEP status. Value: Enabled or Disabled Note |
Authentication type |
Indicates whether the client adapter must share the same WEP keys as the access point in order to communicate or can communicate with the access point regardless of its WEP settings. Value: Open, Shared Key, or Unknown Note |
Channel set |
The regulatory domain for which your client adapter is currently configured, such as North America. This value is not user selectable. Note |
Client name |
The name your client adapter uses when it associates to an access point. Note |
MAC address |
The MAC address assigned to your client adapter at the factory. |
Adopted carrier set |
When world mode is enabled and your client adapter has associated to an access point, this is the channel set adopted by the adapter from the access point. Value: Disabled, Unknown, North America, Europe, Japan, Spain, |
MIC enabled |
Indicates whether your client adapter is using message integrity check (MIC) to protect bit-flip attacks on encrypted packets. During a bit-flip attack, an intruder intercepts an encrypted message, alters it slightly, and retransmits it, and the receiver accepts the retransmitted message as legitimate. Client adapters using driver version 1.0.3 and firmware version 4.25.2x or greater support MIC; however, MIC can be used only if it is also enabled on the access point. Note Value: Yes—client adapter radio is MIC capable, MIC is enabled on No—client adapter radio is MIC capable, MIC is enabled on N/A—client adapter radio is not MIC capable. Disabled—client adapter radio is MIC capable, but MIC is |
Total MIC errors |
Indicates the total number of MIC errors that have occurred. |
Current link speed |
The rate at which your client adapter is currently transmitting data packets. Value: 1, 2, 5.5, or 11 Mbps |
Data rate |
The rate at which your client adapter has been configured to transmit or receive data packets. Value: 1 Mbps, 2 Mbps, 5.5 Mbps, 11 Mbps, or Auto Note |
Current power level |
The power level at which your client adapter is currently transmitting. The maximum level is dependent upon the radio installed in your client adapter and your country's regulatory agency. Value: 1, 5, 15, 20, 30, 50, or 100 mW (30 mW is the maximum Note Note |
Channel (frequency) |
The frequency that your client adapter is currently using as the channel for communications. Value: Dependent on regulatory domain Note |
Network type |
The type of network in which your client adapter is being used. Value: Infrastructure, Ad Hoc, or Unknown Note |
Power save mode |
The client adapter's current power consumption setting. Value: CAM, Fast Power Save, Max Power Save, or Unknown Note |
Antenna |
The antenna mode that your client adapter is currently using. Value: Antennas 1 and 2, Antenna 1 Only, Antenna 2 Only Note |
Status |
The operational mode of your client adapter. Value: Error, Configured, Associated, Not Associated, or |
Signal strength |
The signal strength for all received packets. The higher the value and the longer the green the bar graph is, the stronger the signal. Range: 0 to 100% |
Current beacons received |
The percentage of beacon packets received versus those expected to be received. The higher the value and the longer the green the bar graph is, the better the quality of the signal. Example: The access point sends out 10 beacons per second, so you would expect the client adapter to receive 50 beacon packets in 5 seconds. If it receives only 40 packets, the percentage of beacons received would be 80%. Range: 0 to 100% |
Overall link quality |
The client adapter's ability to communicate with the access point, which is determined by the combined result of the adapter's signal strength and signal quality. Value: Not Associated, Poor, Fair, Good, Excellent |
SSID |
The SSID that your client adapter is currently using if you are in infrastructure mode. Note |
Name |
The name of the access point to which your client adapter is associated. It is shown only if the access point was configured with a name and you are in infrastructure mode. |
IP address |
The IP address of the access point to which your client adapter is associated. It is shown only if the access point was configured with an IP address and you are in infrastructure mode. |
MAC |
The MAC address of the access point to which your client adapter is associated. It is shown only if you are in infrastructure mode. |
Viewing Statistics for Your Client Adapter
The pcm3x0PPC client utility allows you to view statistics that indicate how data is being received and transmitted by your client adapter.
Viewing Receive Statistics
To view your client adapter's receive statistics, select Status from the File pull-down menu (see Figure 7-2) and the Statistics (Receive) tab. The Receive Statistics screen appears (see Figure 7-3).
Note ![]() To view your client adapter's transmit statistics, go to the "Viewing Transmit Statistics" section.
To view your client adapter's transmit statistics, go to the "Viewing Transmit Statistics" section.
Figure 7-3 Receive Statistics Screen

The statistics are calculated as soon as your client adapter is started or the Clear Stats button is selected.
Table 7-2 describes each receive statistic that is displayed for your client adapter.
|
|
|
|---|---|
Multicast Pkts |
The number of multicast packets that were received successfully. |
Broadcast Pkts |
The number of broadcast packets that were received successfully. |
Unicast Pkts |
The number of unicast packets that were received successfully. |
Bytes |
The number of bytes of data that were received successfully. |
Beacons |
The number of beacon packets that were received successfully. |
Total Pkts OK |
The number of all packets that were received successfully. |
Duplicate Pkts |
The number of duplicate packets that were received successfully. |
Overrun Errs |
The number of packets received when no receive buffers were available. These errors usually occur when the host does not read the received packets from the client adapter fast enough. |
PLCP CRC Errs |
The number of times the client adapter started to receive an 802.11 physical layer convergence protocol (PLCP) header but the rest of the packet was ignored due to a cyclic redundancy check (CRC) error in the header. |
PLCP Format Errs |
The number of times an 802.11 PLCP header was received with a valid CRC but the rest of the packet was ignored due to an unknown value in the header. |
PLCP Length Errs |
The number of times an 802.11 PLCP header was received but the rest of the packet was ignored due to an illegal header length. |
MAC CRC Errs |
The number of packets that had a valid 802.11 PLCP header but contained a CRC error in the data portion of the packet. |
Partial Pkts |
The number of fragments that were discarded because the entire packet was not received successfully. |
SSID Mismatches |
The number of times the client adapter tried to associate to an access point but was unable to because the adapter's SSID was not the same as the access point's. |
AP Mismatches |
The number of times the client adapter tried to associate to an access point but was unable to because the access point was not the adapter's specified access point. Note |
Data Rate Mismatches |
The number of times the client adapter tried to associate to an access point but was unable to because the adapter's data rate was not supported by the access point. Note |
Authentication Rejects |
The number of times the client adapter tried to authenticate to an access point but was rejected. |
Authentication T/O |
The number of times the client adapter tried to authenticate to an access point but was unable to because the access point did not respond fast enough (timed out). |
Association Rejects |
The number of times the client adapter tried to associate to an access point but was rejected. |
Association T/O |
The number of times the client adapter tried to associate to an access point but was unable to because the access point did not respond fast enough (timed out). |
Packets Aged |
The number of packets received successfully but discarded by the client adapter because either all fragments were not received within 10 seconds or the host did not read the packet from the adapter within 10 seconds. |
Up Time (hh:mm:ss) |
The amount of time (in hours:minutes:seconds) since your client adapter was started or the Clear Stats button was selected. If the client adapter has been running for more than 24 hours, the time is displayed in days, hours:minutes:seconds. |
Viewing Transmit Statistics
To view your client adapter's transmit statistics, select Status from the File pull-down menu (see Figure 7-1) and the Statistics (Transmit) tab. The Transmit Statistics screen appears (see Figure 7-4).
Figure 7-4 Transmit Statistics Screen
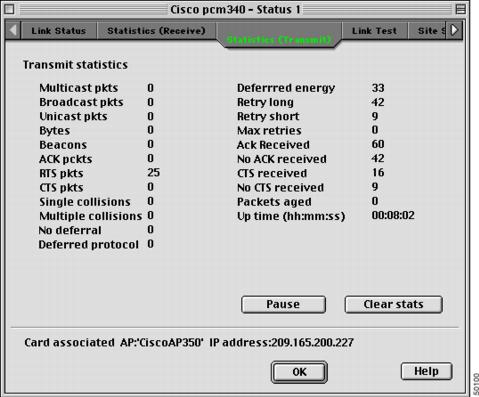
The statistics are calculated as soon as your client adapter is started or the Clear Stats button is selected.
Table 7-3 describes each transmit statistic that is displayed for your client adapter.
Assessing the RF Link
You can determine the performance of the RF link between your client adapter and its associated access point in two different ways:
•![]() You can use the link status meter (LSM) to view a graphical display of the signal strength and quality of the client adapter's radio signal. Go to the "Viewing the Link Status Meter" section below.
You can use the link status meter (LSM) to view a graphical display of the signal strength and quality of the client adapter's radio signal. Go to the "Viewing the Link Status Meter" section below.
•![]() You can run an RF link test that allows you to set the number and size of the packets to be transmitted and then to determine the success or failure of those packets. Go to the "Running an RF Link Test" section.
You can run an RF link test that allows you to set the number and size of the packets to be transmitted and then to determine the success or failure of those packets. Go to the "Running an RF Link Test" section.
Viewing the Link Status Meter
To access the Link Status Meter screen, select Status from the File pull-down menu (see Figure 7-1) and the Link Status Meter tab. The Link Status Meter screen appears (see Figure 7-5).
Figure 7-5 Link Status Meter Screen
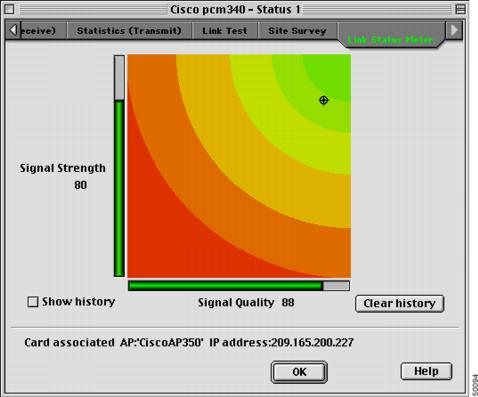
The Link Status Meter screen provides a graphical display of the following:
•![]() Signal strength - The strength of the client adapter's radio signal at the time packets are being received. It is displayed as a percentage along the vertical axis.
Signal strength - The strength of the client adapter's radio signal at the time packets are being received. It is displayed as a percentage along the vertical axis.
•![]() Signal quality—The quality of the client adapter's radio signal at the time packets are being received. It is displayed as a percentage along the horizontal axis.
Signal quality—The quality of the client adapter's radio signal at the time packets are being received. It is displayed as a percentage along the horizontal axis.
The combined result of the signal strength and signal quality is represented by a moving bull's-eye (see Figure 7-5). Where the bull's-eye falls on the graphical display determines the quality of the RF link between your client adapter and its associated access point. Differences in the quality of the RF link are indicated by the following colors: green (excellent), yellow (good), orange (fair), and red (poor).
This information can be used to determine the optimum number and placement of access points in your RF network. By using LSM to assess the RF link at various locations, you can avoid areas where performance is weak and eliminate the risk of losing the connection between your client adapter and the access point.
Selecting the Show History check box causes the graphical display to show a recent history of the RF performance between your client adapter and its associated access point. Black dots on the graphical display show the performance of the last 50 signals. These black dots can be cleared from the display by clicking the Clear History button.
Note ![]() The access point that is associated to your client adapter and its IP address are indicated at the bottom of the display.
The access point that is associated to your client adapter and its IP address are indicated at the bottom of the display.
Running an RF Link Test
The pcm3x0PPC client utility's link test tool sends out pings to assess the performance of the RF link. The test is designed to be performed multiple times at various locations throughout your area and is run at the data rate set in the Edit Properties - RF Network Parameters section of the utility (see the Data Rate parameter in the "Setting RF Network Parameters" section). The results of the link test can be used to determine RF network coverage and ultimately the required number and placement of access points in your network. The test also helps you to avoid areas where performance is weak, thereby eliminating the risk of losing the connection between your client adapter and its associated access point.
Because the link test operates above the RF level, it does more than test the RF link between two network devices. It also checks the status of wired sections of the network and verifies that TCP/IP and the proper drivers have been loaded.
Note ![]() A link test can also be run from an access point through a Telnet session. Refer to Chapter 4 of the Cisco Aironet Access Point Software Configuration Guide for information.
A link test can also be run from an access point through a Telnet session. Refer to Chapter 4 of the Cisco Aironet Access Point Software Configuration Guide for information.
The following prerequisites are required before you can run an RF link test:
•![]() The TCP/IP protocol must be installed on your system.
The TCP/IP protocol must be installed on your system.
•![]() An IP address must be configured for the access point.
An IP address must be configured for the access point.
Follow the steps below to run an RF link test.
Step 1 ![]() Select Status from the File pull-down menu (see Figure 7-1) and the Link Test tab. The Link Test screen appears (see Figure 7-6).
Select Status from the File pull-down menu (see Figure 7-1) and the Link Test tab. The Link Test screen appears (see Figure 7-6).
Figure 7-6 Link Test Screen
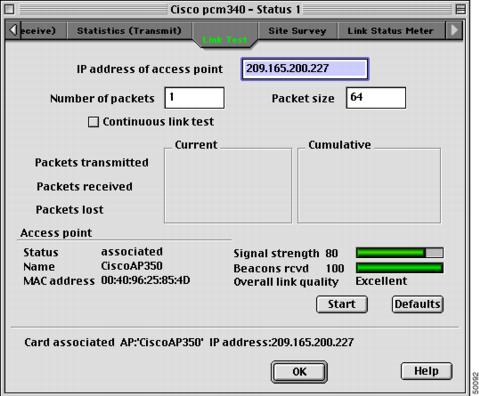
Step 2 ![]() In the IP Address of access point field, enter the IP address of the access point with which you want to test the RF link.
In the IP Address of access point field, enter the IP address of the access point with which you want to test the RF link.
Step 3 ![]() You can set the link test to run until it has attempted to send a specific number of packets or to run until you stop it. Follow one of the steps below to determine how long the link test will run:
You can set the link test to run until it has attempted to send a specific number of packets or to run until you stop it. Follow one of the steps below to determine how long the link test will run:
•![]() Type the number of packets that the link test should attempt to send in the Number of Packets field. (The Number of Packets parameter is ignored if the Continuous Link Test check box is selected.)
Type the number of packets that the link test should attempt to send in the Number of Packets field. (The Number of Packets parameter is ignored if the Continuous Link Test check box is selected.)
Range: 1 to 1000
Default: 1
•![]() Select the Continuous Link Test check box to allow the link test to run continuously.
Select the Continuous Link Test check box to allow the link test to run continuously.
Default: Deselected
Step 4 ![]() Type the size of the data packet that is to be sent to the access point in the Packet Size field.
Type the size of the data packet that is to be sent to the access point in the Packet Size field.
Range: 64 to 1514
Default: 64
Step 5 ![]() Click the Start button to run the link test. While the test is running, statistics are displayed and updated periodically.
Click the Start button to run the link test. While the test is running, statistics are displayed and updated periodically.
Figure 7-7 shows the Link Test screen while it is running.
Figure 7-7 Link Test Screen (While Running)
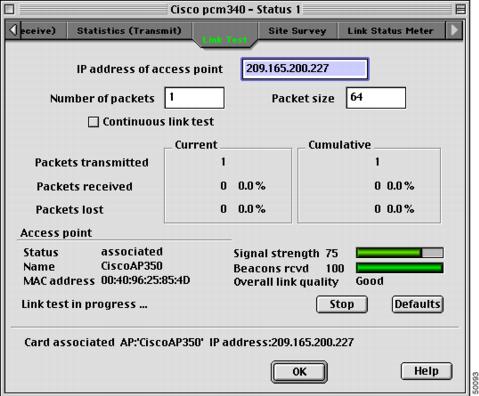
Table 7-4 interprets the statistics that are displayed on the Link Test screen while the link test is running.
Step 6 ![]() If you did not set the link test to run continuously, the test ends after the specified number of packets is sent, and the Stop button changes back to the Start button. To stop the link test at any time, click Stop.
If you did not set the link test to run continuously, the test ends after the specified number of packets is sent, and the Stop button changes back to the Start button. To stop the link test at any time, click Stop.
Diagnostic Tools for Mac OS X
In addition to allowing you to configure your client adapter for use in various types of networks, the client utility provides tools that allow you to assess the operation of the client adapter and other devices on the wireless network. The client utility's diagnostic tools to perform the following functions:
•![]() Display your client adapter's current status and configured settings
Display your client adapter's current status and configured settings
•![]() Run a link test to assess the operation of the RF link between your client adapter and its associated access point
Run a link test to assess the operation of the RF link between your client adapter and its associated access point
•![]() Run a link test to assess the operation of the wired link between your access point and a wired device
Run a link test to assess the operation of the wired link between your access point and a wired device
•![]() Obtain information on local access points (configured for broadcast SSID)
Obtain information on local access points (configured for broadcast SSID)
Viewing the Current Status of Your Client Adapter
To view your client adapter's status and settings, select the Status tab on the advanced properties screen. The status screen is displayed (see Figure 7-8).
Figure 7-8 Client Utility Advanced Properties Status Screen
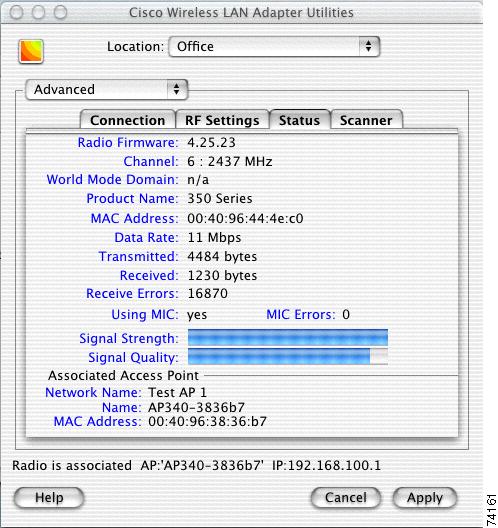
Table 7-5 describes the parameters on the status screen.
|
|
|
|---|---|
Firmware Version |
The version of the radio firmware that is currently running on your client adapter. |
Channel |
Specifies which frequency your client adapter will use as the channel for communications. These channels conform to the IEEE 802.11 Standard for your regulatory domain. • • Range: Dependent on regulatory domain Note |
World Mode Domain |
When world mode is enabled and your client adapter has associated to an access point, this is the channel set adopted by the adapter from the access point. Value: Disabled, Unknown, North America, Europe, Japan, Spain, France, Belgium, Israel, Canada, Australia |
Product Name |
Identifies the type of client adapter you are using. Value: 340 Series, 350 Series, or 4800 Series |
MAC Address |
The MAC address assigned to your client adapter at the factory. |
Data Rate |
The rate at which your client adapter is currently transmitting data packets. Value: 1 Mbps, 2 Mbps, 5.5 Mbps, or 11 Mbps |
Transmitted |
The number of packets that have been transmitted successfully. |
Received |
The number of packets that have been received successfully. |
Receive Errors |
The total number of errors on receive packets. |
Using MIC |
Indicates whether your client adapter is using message integrity check (MIC) to protect bit-flip attacks on encrypted packets. During a bit-flip attack, an intruder intercepts an encrypted message, alters it slightly, and retransmits it, and the receiver accepts the retransmitted message as legitimate. Client adapters using driver version 1.0.3 and firmware version 4.25.2x or greater support MIC; however, MIC can be used only if it is also enabled on the access point. Note Value: Yes—client adapter radio is MIC capable, MIC is enabled on No—client adapter radio is MIC capable, MIC is enabled on N/A—client adapter radio is not MIC capable. Disabled—client adapter radio is MIC capable, but MIC is |
MIC Errors |
Indicates the total number of MIC errors that have occurred. |
Signal Strength |
The signal strength for received packets. The longer the bar graph is, the stronger the signal. |
Signal Quality |
The signal quality for received packets. The longer the bar graph is, the better the signal quality. |
Network Name |
The network name or SSID of your wireless network. Note |
Name |
The name of the access point to which your client adapter is associated. It is shown only if the access point was configured with a name and you are in infrastructure mode. |
MAC Address |
The MAC address of the access point or wireless device to which your client adapter is associated. |
Assessing the Wireless and Wired Links
You can determine the operation of the wireless and wired links from your client adapter in two different ways:
•![]() You can use the link status meter to view a graphical display of the signal strength and quality of the radio signals from the local access points (configured for broadcast SSID). Go to the "Viewing the Link Status Meter" section below.
You can use the link status meter to view a graphical display of the signal strength and quality of the radio signals from the local access points (configured for broadcast SSID). Go to the "Viewing the Link Status Meter" section below.
•![]() You can run a link test with an access point or a wired device. Go to the "Running a Link Test" section.
You can run a link test with an access point or a wired device. Go to the "Running a Link Test" section.
Viewing the Link Status Meter
To access the Link Status Meter (LSM) screen, click the LSM icon on the upper left of the Client Utility Advanced Properties Screen (see Figure 7-9).
Figure 7-9 LSM Icon on Client Utility Advanced Properties Screen
When you click the LSM icon, the LSM screen typically appears on the right side of the client utility screen. If there is insufficient space on the right side of the client utility screen, the LSM screen appears on the left side.
The LSM screen is shown in Figure 7-10.
Figure 7-10 LSM Screen
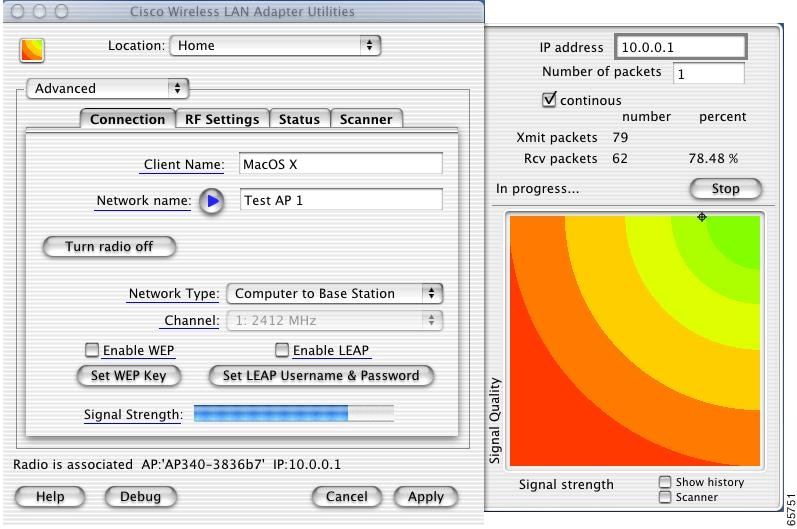
The LSM screen provides a graphical display of the following:
•![]() Signal quality—The quality of the access point's radio signal at the time packets are being received. It is displayed as a percentage along the vertical axis.
Signal quality—The quality of the access point's radio signal at the time packets are being received. It is displayed as a percentage along the vertical axis.
•![]() Signal strength—The strength of the radio signal received from the associated access point. It is displayed as a percentage along the horizontal axis.
Signal strength—The strength of the radio signal received from the associated access point. It is displayed as a percentage along the horizontal axis.
The combined result of the signal strength and signal quality is represented by a moving mark (see Figure 7-10). Where the mark falls on the graphical display determines the quality of the RF link between your client adapter and its associated access point. Differences in the quality of the RF link are indicated by the following colors: green (excellent), yellow (good), orange (fair), and red (poor).
This information can be used to determine the optimum number and placement of access points in your RF network. By using LSM to assess the RF link at various locations, you can avoid areas where performance is weak and eliminate the risk of losing the connection between your client adapter and the access point.
Selecting the Show History check box causes the graphical display to show a recent history of the RF performance between your client adapter and its associated access point. Black dots on the graphical display show the performance of the last 20 measurements.
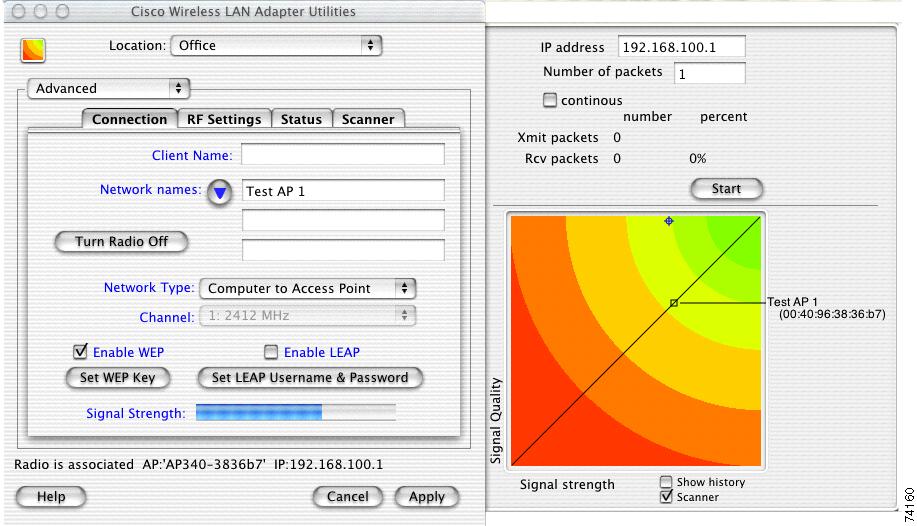
Selecting the scanner check box causes the graphical display to show the signal strength of detected access points on a diagonal line. Each access point is identified by Network Name or SSID. If the Network Name is not available, the access point MAC address is displayed. The graphical scanner display provides a quick visual indication of the access point signals.
Note ![]() When the scanner check box is checked, only access points configured for broadcast SSID are displayed. Typically, access points configured for security are not shown.
When the scanner check box is checked, only access points configured for broadcast SSID are displayed. Typically, access points configured for security are not shown.
Running a Link Test
The client utility's link test tool is designed to allow you to quickly evaluate the operation of the RF link between your client adapter and the associated access point. The test can also be used to check the operation of the wired link connected to the access point. The link test sends out TCP/IP Ping packets to assess the operation of the link (RF link and wired link) between your client adapter and the destination device specified by the IP address. Initially, the IP address of the associated access point is automatically placed in the IP address field.
The link test does more than test the link between two network devices. It verifies that TCP/IP software and the proper drivers have been loaded and are operating properly.
The following prerequisites are required before you can run a link test:
•![]() The TCP/IP protocol must be installed and operational on your Macintosh computer.
The TCP/IP protocol must be installed and operational on your Macintosh computer.
•![]() Your Macintosh computer and the access point must have an IP address.
Your Macintosh computer and the access point must have an IP address.
Follow the steps below to run a link test:
Step 1 ![]() Click the LSM icon on the upper left of the Client Utility Advanced Properties Screen (see Figure 7-9). The LSM screen appears (see Figure 7-10).
Click the LSM icon on the upper left of the Client Utility Advanced Properties Screen (see Figure 7-9). The LSM screen appears (see Figure 7-10).
Step 2 ![]() In the IP Address field, you can enter a device IP address or use the IP address of the associated access point that is automatically placed in the field.
In the IP Address field, you can enter a device IP address or use the IP address of the associated access point that is automatically placed in the field.
Note ![]() You can specify the IP address of a device on the wired link connected to the access point. This allows the link test to check both the wireless and wired links.
You can specify the IP address of a device on the wired link connected to the access point. This allows the link test to check both the wireless and wired links.
Step 3 ![]() You can set the link test to run until it has completed a specific number of packets or to continuously run until you stop it. Follow one of the steps below to determine how long the link test will run:
You can set the link test to run until it has completed a specific number of packets or to continuously run until you stop it. Follow one of the steps below to determine how long the link test will run:
•![]() Specify the number of packets (from 1 to 1000) that the link test sends by typing the number in the Number of Packets field. (The Number of Packets parameter is ignored if the Continuous check box is selected.)
Specify the number of packets (from 1 to 1000) that the link test sends by typing the number in the Number of Packets field. (The Number of Packets parameter is ignored if the Continuous check box is selected.)
•![]() Click the Continuous check box to allow the link test to run continuously.
Click the Continuous check box to allow the link test to run continuously.
Step 4 ![]() Click the Start button to run the link test. While the test is running, statistics are displayed and updated periodically. For additional information, see Table 7-6.
Click the Start button to run the link test. While the test is running, statistics are displayed and updated periodically. For additional information, see Table 7-6.
Step 5 ![]() If you did not set the link test to run continuously, the test ends after the specified number of packets is sent, and the Stop button changes back to the Start button. To stop the link test at any time, click Stop.
If you did not set the link test to run continuously, the test ends after the specified number of packets is sent, and the Stop button changes back to the Start button. To stop the link test at any time, click Stop.
Table 7-6 interprets the statistics that are displayed on the LSM screen while the link test is running.
Determining Local Access Points
The client utility provides two methods used to detect local access points:
•![]() Scanner Tab
Scanner Tab
•![]() LSM Scanner
LSM Scanner
Scanner Tab
When you click the Scanner tab on the client utility advanced properties screen, the Scanner Details Screen is displayed (see Figure 7-11).
Figure 7-11 Scanner Details Screen
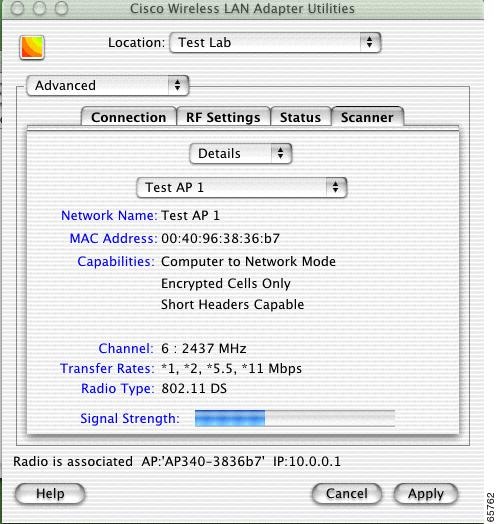
The scanner function displays information on the detected access points, which can be used to configure your client adapter to associate to an access point.
Note ![]() The client utility scanner displays only local access points that are configured for broadcast SSID. Typically, broadcast SSID is deactivated on access points configured for security.
The client utility scanner displays only local access points that are configured for broadcast SSID. Typically, broadcast SSID is deactivated on access points configured for security.
Table 7-7 lists and describes the parameters on the scanner details screen.
|
|
|
|---|---|
Screen Format |
Selects the scanner screen format. Two options are supported: Details or Summary. The Details option displays information on a single access point. The Summary option displays a tabular list of all detected access points (see Figure 7-12). Use the up and down arrows on the right of the field to select the screen format options. Range: Details or Summary Default: Details |
Detected Access Points |
Selects an access point from a drop-down list of detected access points. Use the up and down arrows on the right of the field to display the drop-down list of access points. Only available in the Details screen format. |
Network Name |
The network name or SSID of the access point. |
MAC Address |
The MAC address of the access point. Only available in the Details screen format. |
Capabilities |
The detected capabilities of the access point, such as network type, encrypted cell, and short header. Only available in the Details screen format. |
Channel |
The operating frequency and channel that the access point is using for communications. |
Transfer Rates |
The data rates supported by the access point. |
Radio Type |
The type of radio used by the access point. |
Signal Strength |
The signal strength of received signals from the access point. On the Details screen format, the longer the bar graph is, the stronger the signal. |
When you select the scanner summary screen format option, the client utility provides scanner information in a list format (see Figure 7-12).
Figure 7-12 Scanner Summary Screen
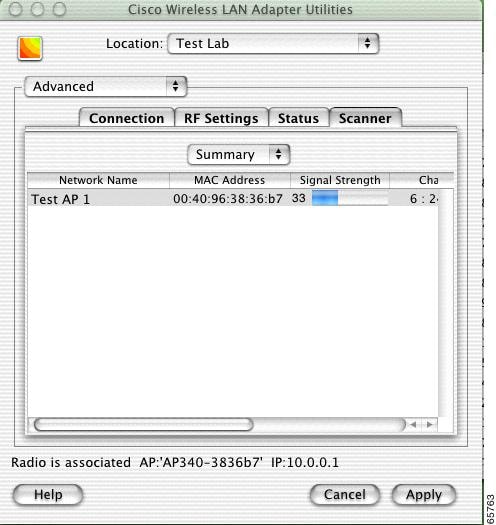
Note ![]() You can use the scroll bar at the bottom of the Scanner Summary Screen to view the other fields.
You can use the scroll bar at the bottom of the Scanner Summary Screen to view the other fields.
The scanner summary screen provides the following information fields:
•![]() Network Name
Network Name
•![]() Mac Address
Mac Address
•![]() Signal Strength
Signal Strength
•![]() Channel
Channel
•![]() Data Rates
Data Rates
•![]() Radio Type
Radio Type
See Table 7-7 for a description of the parameters displayed on the Scanner Summary Screen.
LSM Scanner
Selecting the scanner check box on the bottom of the LSM screen provides a graphical scanner display that shows the signal strength of detected access points on a diagonal line. Each access point is identified by network name or SSID. If the network name is not available, the access point MAC address is displayed. The graphical scanner display provides a quick visual indication of the access point signals (see Figure 7-13).
Note ![]() The LSM scanner only displays access points configured for broadcast SSID. Typically, broadcast SSID is deactivated on access points that are configured for security.
The LSM scanner only displays access points configured for broadcast SSID. Typically, broadcast SSID is deactivated on access points that are configured for security.
Figure 7-13 LSM Scanner Screen
 Feedback