- Preface
- Chapter 1: Overview
- Chapter 2: Licensing
- Chapter 3: Synchronizing Mobility Services Engines
- Chapter 4: Configuring High Availability
- Chapter 5: MSE Delivery Modes
- Chapter 6: Configuring and Viewing System Properties
- Chapter 7: Managing Users and Groups
- Chapter 8: Configuring Event Notifications
- Chapter 9: Context-Aware Service Planning and Verification
- Chapter 10: Working with Maps
- Chapter 11: Monitoring the System and Services
- Chapter 12: MSAP
- Chapter 13: Performing Maintenance Operations
- Appendix A
- Index
Cisco Context-Aware Service Configuration Guide, Release 7.3.101.0
Bias-Free Language
The documentation set for this product strives to use bias-free language. For the purposes of this documentation set, bias-free is defined as language that does not imply discrimination based on age, disability, gender, racial identity, ethnic identity, sexual orientation, socioeconomic status, and intersectionality. Exceptions may be present in the documentation due to language that is hardcoded in the user interfaces of the product software, language used based on RFP documentation, or language that is used by a referenced third-party product. Learn more about how Cisco is using Inclusive Language.
- Updated:
- June 16, 2014
Chapter: Chapter 11: Monitoring the System and Services
Monitoring the System and Services
This chapter describes how to monitor the mobility services engine by configuring and viewing alarms, events, and logs as well as how to generate reports on system use and element counts (tags, clients, rogue clients, interferers, and access points).
It also describes how to use the Prime Infrastructure to monitor clients (wired and wireless), tags, chokepoints, and Wi-Fi TDOA receivers.
This chapter contains the following sections:
Working with Alarms
This section describes how to view, assign, and clear alarms and events on a mobility services engine using the Prime Infrastructure. It also describes how to define alarm notifications (all, critical, major, minor, warning) and detail how to e-mail those alarm notifications.
This section contains the following topics:
•![]() Viewing the MSE Alarm Details
Viewing the MSE Alarm Details
•![]() Assigning and Unassigning Alarms
Assigning and Unassigning Alarms
•![]() E-mailing Alarm Notifications
E-mailing Alarm Notifications
Guidelines and Limitations
Once the severity is cleared, the alarm is deleted from the Prime Infrastructure after 30 days.
Viewing Alarms
To view mobility services engine alarms, follow these steps:
Step 1 ![]() Choose Monitor > Alarms.
Choose Monitor > Alarms.

Note ![]() Alarms are displayed only in the root domain. For the non-root virtual domain, alarms belonging to the mobility services category are not displayed in Monitor > Alarms page. In the Alarms Summary page, the count of the mobility services alarm remains zero in the non-root virtual domain.
Alarms are displayed only in the root domain. For the non-root virtual domain, alarms belonging to the mobility services category are not displayed in Monitor > Alarms page. In the Alarms Summary page, the count of the mobility services alarm remains zero in the non-root virtual domain.
Step 2 ![]() Click the Advanced Search link in the navigation bar. A configurable search dialog box for alarms appears.
Click the Advanced Search link in the navigation bar. A configurable search dialog box for alarms appears.
Step 3 ![]() Choose Alarms from the Search Category drop-down list.
Choose Alarms from the Search Category drop-down list.
Step 4 ![]() Choose the Severity of Alarms from the Severity drop-down list to display. The options are All Severities, Critical, Major, Minor, Warning, or Clear.
Choose the Severity of Alarms from the Severity drop-down list to display. The options are All Severities, Critical, Major, Minor, Warning, or Clear.
Step 5 ![]() Choose Mobility Service from the Alarm Category drop-down list.
Choose Mobility Service from the Alarm Category drop-down list.
Step 6 ![]() Choose the Condition from the Condition combo box. Alternatively, you can also enter the condition in the Condition in the combo box.
Choose the Condition from the Condition combo box. Alternatively, you can also enter the condition in the Condition in the combo box.
Step 7 ![]() From the Time Period drop-down list, choose the time frame for which you want to review alarms.
From the Time Period drop-down list, choose the time frame for which you want to review alarms.
The options range from minutes (5, 15, and 30) to hours (1 and 8) to days (1 and 7). To display all, choose Any time.
Step 8 ![]() Select the Acknowledged State check box to exclude the acknowledged alarms and their count in the Alarm Summary page.
Select the Acknowledged State check box to exclude the acknowledged alarms and their count in the Alarm Summary page.
Step 9 ![]() Select the Assigned State check box to exclude the assigned alarms and their count in the Alarm Summary page.
Select the Assigned State check box to exclude the assigned alarms and their count in the Alarm Summary page.
Step 10 ![]() From the Items per page drop-down list, choose the number of alarms to display in each page.
From the Items per page drop-down list, choose the number of alarms to display in each page.
Step 11 ![]() To save the search criteria for later use, select the Save Search check box and enter a name for the search.
To save the search criteria for later use, select the Save Search check box and enter a name for the search.
Note ![]() You can initiate the search thereafter by clicking the Saved Search link.
You can initiate the search thereafter by clicking the Saved Search link.
Step 12 ![]() Click Go. The alarms summary dialog box appears with search results.
Click Go. The alarms summary dialog box appears with search results.
Note ![]() Click the column headings (Severity, Failure Source, Owner, Date/Time, Message, and Acknowledged) to sort alarms.
Click the column headings (Severity, Failure Source, Owner, Date/Time, Message, and Acknowledged) to sort alarms.
Step 13 ![]() Repeat Step 2 to Step 12 to see Context-Aware Service notifications for the mobility services engine. Enter Context Aware Notifications as the alarm category in Step 5.
Repeat Step 2 to Step 12 to see Context-Aware Service notifications for the mobility services engine. Enter Context Aware Notifications as the alarm category in Step 5.
Viewing the MSE Alarm Details
To view MSE alarm details, follow these steps:
Step 1 ![]() Choose Monitor > Alarms.
Choose Monitor > Alarms.
Step 2 ![]() Click an MSE in the Failure Source column to access the alarm details for a particular MSE.
Click an MSE in the Failure Source column to access the alarm details for a particular MSE.
Alternatively, you can choose the Services > Services > MSE Name > System > Status > Prime Infrastructure Alarms page and click a particular MSE item in the Failure Source column to access the alarm details for a particular MSE (see Figure 11-1).
Figure 11-1 MSE Alarm
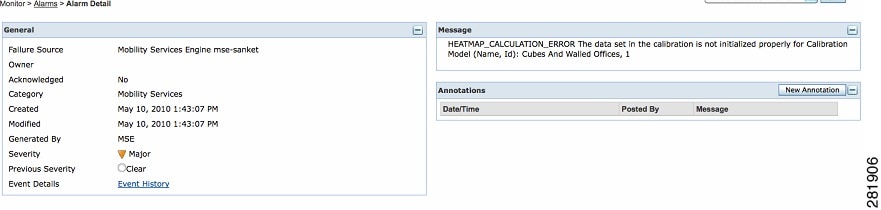
Table 11-1 lists the various fields in the Alarm Detail page for an MSE.
Note ![]() The General information may vary depending on the type of alarm. For example, some alarm details may include location and switch port tracing information.
The General information may vary depending on the type of alarm. For example, some alarm details may include location and switch port tracing information.
•![]() Annotations—Enter any new notes in this text box and click Add to update the alarm. Notes appear in the Annotations display page.
Annotations—Enter any new notes in this text box and click Add to update the alarm. Notes appear in the Annotations display page.
•![]() Messages—Shows information about the alarm.
Messages—Shows information about the alarm.
•![]() Audit Report—Click to view config audit alarm details. This report is only available for Config Audit alarms.
Audit Report—Click to view config audit alarm details. This report is only available for Config Audit alarms.
Configuration audit alarms are generated when audit discrepancies are enforced on config groups.
Note ![]() If enforcement fails, a critical alarm is generated on the config group. If enforcement succeeds, a minor alarm is generated on the config group.
If enforcement fails, a critical alarm is generated on the config group. If enforcement succeeds, a minor alarm is generated on the config group.
The alarms have links to the audit report where you can view a list of discrepancies for each controller.
•![]() Event History—Opens the MSE Alarm Events page to view events for this alarm. When there are multiple alarm page, the page numbers appear at the top of the page with a scroll arrow on each side. Use these scroll arrows to view additional alarms.
Event History—Opens the MSE Alarm Events page to view events for this alarm. When there are multiple alarm page, the page numbers appear at the top of the page with a scroll arrow on each side. Use these scroll arrows to view additional alarms.
The Select a command drop-down list provides access to the following functions:
•![]() Assign to me—Assign the selected alarm(s) to the current user.
Assign to me—Assign the selected alarm(s) to the current user.
•![]() Unassign—Unassign the selected alarm(s).
Unassign—Unassign the selected alarm(s).
•![]() Delete—Delete the selected alarm(s).
Delete—Delete the selected alarm(s).
•![]() Clear—Clear the selected alarm(s).
Clear—Clear the selected alarm(s).
Note ![]() Once the severity is cleared, the alarm is deleted from the Prime Infrastructure after 30 days.
Once the severity is cleared, the alarm is deleted from the Prime Infrastructure after 30 days.
•![]() Acknowledge—You can acknowledge the alarm to prevent it from showing up in the Alarm Summary page. The alarm remains in the Prime Infrastructure and you can search for all Acknowledged alarms using the alarm search functionality.
Acknowledge—You can acknowledge the alarm to prevent it from showing up in the Alarm Summary page. The alarm remains in the Prime Infrastructure and you can search for all Acknowledged alarms using the alarm search functionality.
•![]() Unacknowledge—You can choose to unacknowledge an already acknowledged alarm.
Unacknowledge—You can choose to unacknowledge an already acknowledged alarm.
•![]() Email Notification—Opens the All Alarms > Email Notification page to view and configure e-mail notifications.
Email Notification—Opens the All Alarms > Email Notification page to view and configure e-mail notifications.
•![]() Event History—Opens the Monitor > Events page to view events for this alarm.
Event History—Opens the Monitor > Events page to view events for this alarm.
Assigning and Unassigning Alarms
To assign and unassign an alarms, follow these steps:
Step 1 ![]() Choose Monitors > Alarms to display the Alarms page.
Choose Monitors > Alarms to display the Alarms page.
Step 2 ![]() Select the alarms that you want to assign to yourself by selecting their corresponding check boxes.
Select the alarms that you want to assign to yourself by selecting their corresponding check boxes.
Note ![]() To unassign an alarm assigned to you, unselect the box next to the appropriate alarm. You cannot unassign alarms assigned to others.
To unassign an alarm assigned to you, unselect the box next to the appropriate alarm. You cannot unassign alarms assigned to others.
Step 3 ![]() From the Select a command drop-down list, choose Assign to Me (or Unassign). Click Go.
From the Select a command drop-down list, choose Assign to Me (or Unassign). Click Go.
Deleting and Clearing Alarms
If you delete an alarm, the Prime Infrastructure removes it from its database. If you clear an alarm, it remains in the Prime Infrastructure database, but in the Clear state. You should clear an alarm when the condition that caused it no longer exists.
To delete or clear an alarm from a mobility services engine, follow these steps:
Step 1 ![]() Choose Monitors > Alarms to display the Alarms page.
Choose Monitors > Alarms to display the Alarms page.
Step 2 ![]() Select the alarms that you want to delete or clear by selecting their corresponding check boxes.
Select the alarms that you want to delete or clear by selecting their corresponding check boxes.
Step 3 ![]() From the Select a command drop-down list, choose Delete or Clear. Click Go.
From the Select a command drop-down list, choose Delete or Clear. Click Go.
E-mailing Alarm Notifications
The Prime Infrastructure lets you send alarm notifications to a specific e-mail address. Sending notifications through e-mail enables you to take prompt action when needed.
You can choose the alarm severity types (critical, major, minor, and warning) to have e-mailed to you.
To send alarm notifications, follow these steps:
Step 1 ![]() Choose Monitor > Alarms.
Choose Monitor > Alarms.
Step 2 ![]() From the Select a command drop-down list, choose Email Notification. Click Go. The Email Notification page appears.
From the Select a command drop-down list, choose Email Notification. Click Go. The Email Notification page appears.
Note ![]() An SMTP mail server must be defined before you enter target e-mail addresses for e-mail notification. Choose Administration > Settings > Mail Server Configuration to enter the appropriate information.
An SMTP mail server must be defined before you enter target e-mail addresses for e-mail notification. Choose Administration > Settings > Mail Server Configuration to enter the appropriate information.
Step 3 ![]() Select the Enabled check box next to the Mobility Service.
Select the Enabled check box next to the Mobility Service.
Note ![]() Enabling the Mobility Service alarm category sends all alarms related to mobility services engine and the location appliance to the defined e-mail address.
Enabling the Mobility Service alarm category sends all alarms related to mobility services engine and the location appliance to the defined e-mail address.
Step 4 ![]() Click the Mobility Service link. The page for configuring the alarm severity types that are reported for the mobility services engine appears.
Click the Mobility Service link. The page for configuring the alarm severity types that are reported for the mobility services engine appears.
Step 5 ![]() Select the check box next to all the alarm severity types for which you want e-mail notifications sent.
Select the check box next to all the alarm severity types for which you want e-mail notifications sent.
Step 6 ![]() In the To text box, enter the e-mail address or addresses to which you want the e-mail notifications sent. Separate e-mail addresses by commas.
In the To text box, enter the e-mail address or addresses to which you want the e-mail notifications sent. Separate e-mail addresses by commas.
Step 7 ![]() Click OK.
Click OK.
You are returned to the Alarms > Notification page. The changes to the reported alarm severity levels and the recipient e-mail address for e-mail notifications are displayed.
Working with Events
You can use the Prime Infrastructure to view the mobility services engine and location notification events. You can search and display events based on their severity (critical, major, minor, warning, clear, and info) and event category.
Displaying Location Notification Events
To display location notification events, follow these steps:
Step 1 ![]() Choose Monitor > Events.
Choose Monitor > Events.
Step 2 ![]() In the Events page, you can perform the following:
In the Events page, you can perform the following:
•![]() If you want to display the events for a specific element, and you know its IP address, name, WLAN SSID, or MAC address, enter that value in the Search text box of the navigation bar. Click Search.
If you want to display the events for a specific element, and you know its IP address, name, WLAN SSID, or MAC address, enter that value in the Search text box of the navigation bar. Click Search.
•![]() To display events by severity and category, click Advanced Search in the navigation bar and choose the appropriate options from the Severity and Event Category drop-down list boxes. Click Go.
To display events by severity and category, click Advanced Search in the navigation bar and choose the appropriate options from the Severity and Event Category drop-down list boxes. Click Go.
Step 3 ![]() If the Prime Infrastructure finds events that match the search criteria, it shows a list of these events.
If the Prime Infrastructure finds events that match the search criteria, it shows a list of these events.
Note ![]() For more information about an event, click the failure source associated with the event. Additionally, you can sort the events summary by each of the column headings.
For more information about an event, click the failure source associated with the event. Additionally, you can sort the events summary by each of the column headings.
Working with Logs
This section describes how to configure logging options and how to download log files.
This section contains the following topics:
Guidelines and Limitations
•![]() When you are selecting an appropriate option from the logging level, make sure you use Error and Trace only when directed to do so by Cisco TAC personnel.
When you are selecting an appropriate option from the logging level, make sure you use Error and Trace only when directed to do so by Cisco TAC personnel.
•![]() Enable advanced debugging only under the guidance of Cisco TAC personnel because advanced debugging slows the mobility service down.
Enable advanced debugging only under the guidance of Cisco TAC personnel because advanced debugging slows the mobility service down.
Configuring Logging Options
You can use the Prime Infrastructure to specify the logging level and types of messages to log.
To configure logging options, follow these steps:
Step 1 ![]() Choose Services > Mobility Services Engines.
Choose Services > Mobility Services Engines.
Step 2 ![]() Click the name of the mobility services engine that you want to configure.
Click the name of the mobility services engine that you want to configure.
Step 3 ![]() From the System menu, choose Logs. The logging options for the selected mobility services engine appear.
From the System menu, choose Logs. The logging options for the selected mobility services engine appear.
Step 4 ![]() Choose the appropriate options from the Logging Level drop-down list.
Choose the appropriate options from the Logging Level drop-down list.
There are four logging options: Off, Error, Information, and Trace.
All log records with a log level of Error or above are logged to a new error log file locserver-error-%u-%g.log. This is an additional log file maintained along with the location server locserver-%u-%g.log log file. The error log file consists of logs of Error level along with their context information. The contextual information consists of 25 log records prior to the error. You can maintain up to 10 error log files. The maximum size allowed for each log file is 10 MB.

Step 5 ![]() Select the Enable check box next to each element listed in that section to begin logging of its events.
Select the Enable check box next to each element listed in that section to begin logging of its events.
Step 6 ![]() Select the Enable check box under Advanced Parameters to enable advanced debugging. By default, this option is disabled.
Select the Enable check box under Advanced Parameters to enable advanced debugging. By default, this option is disabled.
Step 7 ![]() To download log files from the server, click Download Logs. For more information, see the "Downloading Log Files" section.
To download log files from the server, click Download Logs. For more information, see the "Downloading Log Files" section.
Step 8 ![]() In the Log File group box, enter the following:
In the Log File group box, enter the following:
•![]() The number of log files to be maintained in the mobility services engine. You can maintain a minimum of 5 log files and a maximum of 20 log files in the mobility services engine.
The number of log files to be maintained in the mobility services engine. You can maintain a minimum of 5 log files and a maximum of 20 log files in the mobility services engine.
•![]() The maximum log file size in MB. The minimum log file size is 10 MB and the maximum is 50 MB.
The maximum log file size in MB. The minimum log file size is 10 MB and the maximum is 50 MB.
Step 9 ![]() In the MAC Address Based Logging page, do the following:
In the MAC Address Based Logging page, do the following:
•![]() Select the Enable check box to enable MAC address logging. By default, this option is disabled.
Select the Enable check box to enable MAC address logging. By default, this option is disabled.
•![]() Add one or more MAC addresses for which you want to enable logging. You can also remove MAC addresses that you have already added by selecting the MAC address from the list and clicking Remove.
Add one or more MAC addresses for which you want to enable logging. You can also remove MAC addresses that you have already added by selecting the MAC address from the list and clicking Remove.
For more information on MAC address-based logging, see the "MAC Address-based Logging" section.
Step 10 ![]() Click Save to apply your changes.
Click Save to apply your changes.
MAC Address-based Logging
This feature allows you to create log files that are specific to an entity whose MAC address is specified. The log files are created in the locserver directory under the following path:
/opt/mse/logs/locserver
A maximum of 5 MAC addresses can be logged at a time. The log file format for MAC address aa:bb:cc:dd:ee:ff is:
macaddress-debug-aa-bb-cc-dd-ee-ff.log
You can create a maximum of two log files for a MAC address. The two log files may consist of one main and one back up or rollover log file.
The minimum size of a MAC log file is 10 MB. The maximum size allowed is 20 MB per MAC address. The MAC log files which are not updated for more than 24 hours are pruned.
Downloading Log Files
If you need to analyze mobility services engine log files, you can use the Prime Infrastructure to download them to your system. Prime Infrastructure downloads a .zip file containing the log files.
To download a .zip file containing the log files, follow these steps:
Step 1 ![]() Choose Services > Mobility Services Engines.
Choose Services > Mobility Services Engines.
Step 2 ![]() Click the name of the mobility services engine to view its status.
Click the name of the mobility services engine to view its status.
Step 3 ![]() From the left sidebar menu, choose Logs.
From the left sidebar menu, choose Logs.
Step 4 ![]() Click Download Logs.
Click Download Logs.
Step 5 ![]() Follow the instructions in the File Download dialog box to view the file or save the .zip file to your system.
Follow the instructions in the File Download dialog box to view the file or save the .zip file to your system.
Generating Reports
In the Prime Infrastructure, you can generate various kinds of reports. This section explains how to generate ContextAware reports using the Prime Infrastructure Report Launch Pad. By default, reports are stored on the Prime Infrastructure server.
Once you define the report criteria, you can save the reports for future diagnostic use and run them on either an ad hoc or scheduled basis.
You can define the following criteria for the reports:
•![]() Which mobility services engine or engines to monitor
Which mobility services engine or engines to monitor
•![]() How often the report is generated
How often the report is generated
•![]() How the data is graphed on the charts
How the data is graphed on the charts
•![]() Whether the report is e-mailed or exported to a file
Whether the report is e-mailed or exported to a file
This section contains Report Launch Pad
Report Launch Pad
The report launch pad provides access to all the Prime Infrastructure reports from a single page. In this page, you can view current reports, open specific types of reports, create and save new reports, and manage scheduled runs. You can access the ContextAware reports section in the Report Launch Pad to generate ContextAware reports.

Tip ![]() Hover your mouse cursor over the tool tip next to the report type to view more report details.
Hover your mouse cursor over the tool tip next to the report type to view more report details.
This section contains the following topics:
•![]() Creating and Running a New Report
Creating and Running a New Report
•![]() Managing Scheduled Run Results
Managing Scheduled Run Results
Creating and Running a New Report
To create and run a new report, follow these steps:
Step 1 ![]() Choose Reports > Report Launch Pad.
Choose Reports > Report Launch Pad.
The reports are listed by category in the main section of the page and on the left sidebar menu.
Step 2 ![]() Find the appropriate report in the main section of the Report Launch Pad.
Find the appropriate report in the main section of the Report Launch Pad.
Note ![]() Click the report name from the Report Launch Pad or use the navigation on the left side of the Report Launch Pad page to view any currently saved reports for that report type.
Click the report name from the Report Launch Pad or use the navigation on the left side of the Report Launch Pad page to view any currently saved reports for that report type.
Step 3 ![]() Click New. The Report Details page appears (see Figure 11-2).
Click New. The Report Details page appears (see Figure 11-2).
Figure 11-2 Report Details Page
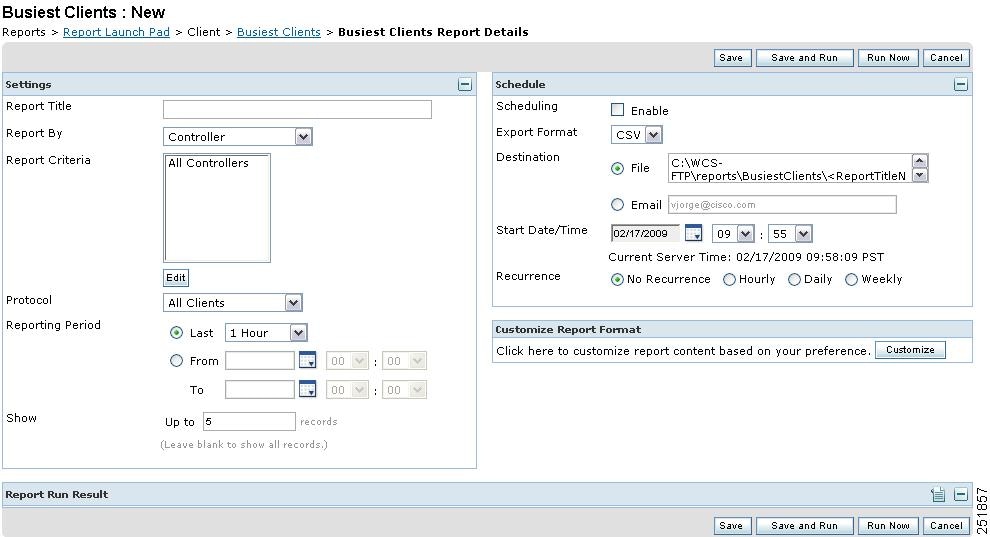
Step 4 ![]() In the Report Details page, enter the following Settings parameters:
In the Report Details page, enter the following Settings parameters:
Note ![]() Certain parameters may or may not appear depending on the report type.
Certain parameters may or may not appear depending on the report type.
•![]() Report Title—If you plan to use this as a saved report, enter a report name.
Report Title—If you plan to use this as a saved report, enter a report name.
•![]() Report By—Choose the appropriate Report By category from the drop-down list.
Report By—Choose the appropriate Report By category from the drop-down list.
•![]() Report Criteria—Allows you to sort your results depending on the previous Report By selection made. Click Edit to open the Filter Criteria page.
Report Criteria—Allows you to sort your results depending on the previous Report By selection made. Click Edit to open the Filter Criteria page.
Note ![]() Click Select to confirm your filter criteria or Close to return to the previous page.
Click Select to confirm your filter criteria or Close to return to the previous page.
•![]() Connection Protocol—All Clients, All Wired(802.3), All Wireless (802.11), All 11u Capable Clients, 802.11a/n, 802.11b/g/n, 802.11a, 802.11b, 802.11g, 802.11n (5 GHz), 802.11n (2.4 GHz).
Connection Protocol—All Clients, All Wired(802.3), All Wireless (802.11), All 11u Capable Clients, 802.11a/n, 802.11b/g/n, 802.11a, 802.11b, 802.11g, 802.11n (5 GHz), 802.11n (2.4 GHz).
•![]() Reporting Period
Reporting Period
–![]() Select the reporting period from the Select a time period...drop-down list. The possible values are Today, Last 1 Hour, Last 6 Hours, Last 12 hours, Last 1 Day, Last 2 Days, Last 3 days, Last 4 Days, Last 5 Days, last 6 Days, Last 7 Days, Last 2 Weeks, Last 4 weeks, Previous Calendar Month, Last 8 Weeks, Last 12 Weeks, Last 6 Months, and Last 1 Year.
Select the reporting period from the Select a time period...drop-down list. The possible values are Today, Last 1 Hour, Last 6 Hours, Last 12 hours, Last 1 Day, Last 2 Days, Last 3 days, Last 4 Days, Last 5 Days, last 6 Days, Last 7 Days, Last 2 Weeks, Last 4 weeks, Previous Calendar Month, Last 8 Weeks, Last 12 Weeks, Last 6 Months, and Last 1 Year.
–![]() From—Select the From radio button and enter the From and To dates and times. You can type a date in the text box, or click the Calendar icon to choose a date. Choose the hours and minutes from the drop-down lists.
From—Select the From radio button and enter the From and To dates and times. You can type a date in the text box, or click the Calendar icon to choose a date. Choose the hours and minutes from the drop-down lists.
•![]() Show—Enter the number of records that you want to be displayed on each page.
Show—Enter the number of records that you want to be displayed on each page.
Note ![]() Leave the text box blank to display all records.
Leave the text box blank to display all records.
Step 5 ![]() If you plan to run this report at a later time or as a recurring report, enter the Schedule parameters. The Schedule parameters allow you to control when and how often the report runs.
If you plan to run this report at a later time or as a recurring report, enter the Schedule parameters. The Schedule parameters allow you to control when and how often the report runs.
•![]() Scheduling—Select the Enable check box to run the report on the set schedule.
Scheduling—Select the Enable check box to run the report on the set schedule.
•![]() Export Format—Choose your format for exported files (CSV or PDF).
Export Format—Choose your format for exported files (CSV or PDF).
•![]() Destination—Select your destination type (File or E-mail). Enter the applicable file location or the e-mail address.
Destination—Select your destination type (File or E-mail). Enter the applicable file location or the e-mail address.
Note ![]() The default file locations for CSV and PDF files are as follows:
The default file locations for CSV and PDF files are as follows:
/localdisk/ftp/reports/Inventory/<ReportTitleName>_<yyyymmdd>_<HHMMSS>.csv
/localdisk/ftp/reports/Inventory/,ReportTitleName>_<yyyymmdd>_<HHMMSS>.pdf
Note ![]() To set the mail server setup for e-mails, choose Administration > Settings, then choose Mail Server from the left sidebar menu to view the Mail Server Configuration page. Enter the SMTP and other required information.
To set the mail server setup for e-mails, choose Administration > Settings, then choose Mail Server from the left sidebar menu to view the Mail Server Configuration page. Enter the SMTP and other required information.
•![]() Start Date/Time—Enter a date in the provided text box, or click the calendar icon to open a calendar from which you can choose a date. Choose the time from the hours and minutes drop-down lists. The report begins to run on this data and at this time.
Start Date/Time—Enter a date in the provided text box, or click the calendar icon to open a calendar from which you can choose a date. Choose the time from the hours and minutes drop-down lists. The report begins to run on this data and at this time.
•![]() Recurrence—Enter the frequency of this report.
Recurrence—Enter the frequency of this report.
–![]() No Recurrence—The report runs only once (at the time indicated for the Start Date/Time).
No Recurrence—The report runs only once (at the time indicated for the Start Date/Time).
–![]() Hourly—The report runs on the interval indicated by the number of hours you enter in the Entry text box.
Hourly—The report runs on the interval indicated by the number of hours you enter in the Entry text box.
–![]() Daily—The report runs on the interval indicated by the number of days you enter in the Every text box.
Daily—The report runs on the interval indicated by the number of days you enter in the Every text box.
–![]() Weekly—The report runs on the interval indicated by the number of weeks you enter in the Every text box and on the days specified by the selected check boxes.
Weekly—The report runs on the interval indicated by the number of weeks you enter in the Every text box and on the days specified by the selected check boxes.
–![]() Monthly—The report runs on the interval indicated by the number of months you enter in the Every text box.
Monthly—The report runs on the interval indicated by the number of months you enter in the Every text box.
The Create Custom Report page allows you to customize the report results. Table 11-2 specifies which reports are customizable, which have multiple sub-reports, and which report views are available. In future releases, all reports are customizable.
|
|
|
|
|
|
|---|---|---|---|---|
Air Quality vs Time |
Yes |
No |
Tabular |
No |
Security Risk Interferers |
Yes |
No |
Tabular |
No |
Worst Air Quality APs |
Yes |
No |
Tabular |
No |
Worst Interferers |
Yes |
No |
Tabular |
No |
Busiest Clients |
Yes |
No |
Tabular |
No |
Client Count |
Yes |
No |
Graphical |
No |
Client Session |
Yes |
No |
Tabular |
No |
Client Summary |
Yes |
Yes |
Various |
Yes |
Client Traffic |
Yes |
No |
Graphical |
No |
Client Traffic Stream Metrics |
Yes |
No |
Tabular1 |
No |
Throughput |
No |
No |
Tabular |
No |
Unique Clients |
Yes |
No |
Tabular |
No |
v5 Client Statistics |
No |
No |
Tabular |
No |
Configuration Audit |
Yes |
No |
Tabular |
No |
PCI DSS Detailed |
Yes |
No |
Tabular |
No |
PCI DSS Summary |
Yes |
No |
Graphical |
No |
AP Profile Status |
Yes |
No |
Tabular |
No |
Device Summary |
Yes |
No |
Tabular |
No |
Busiest APs |
Yes |
No |
Tabular |
No |
Inventory - Combined Inventory |
Yes |
Yes |
Various2 |
Yes |
Inventory - APs |
Yes |
Yes |
Various |
Yes |
Inventory - Controllers |
Yes |
Yes |
Various |
Yes |
Inventory - MSEs |
Yes |
Yes |
Various |
Yes |
Up Time |
Yes |
No |
Tabular |
No |
Utilization - Controllers |
No |
No |
Graphical |
No |
Utilization - MSEs |
No |
No |
Graphical |
No |
Utilization - Radios |
No |
No |
Graphical |
No |
Guest Account Status |
Yes |
No |
Tabular |
No |
Guest Association |
Yes |
No |
Tabular |
No |
Guest Count |
No |
No |
Tabular |
No |
Guest User Sessions |
Yes |
No |
Tabular |
No |
Prime Infrastructure Guest Operations |
Yes |
No |
Tabular |
No |
Alternate Parent |
Yes |
No |
Tabular |
No |
Link Stats - Link Stats |
Yes |
No |
Tabular |
No |
Link Stats - Node Hops |
Yes |
No |
Graphical |
No |
Nodes |
Yes |
No |
Tabular |
No |
Packet Stats - Packet Stats |
No |
No |
Graphical |
No |
Packet Stats - Packet Error Stats |
No |
No |
Graphical |
No |
Packet Stats - Packet Queue Stats |
No |
No |
Graphical |
No |
Stranded APs |
No |
No |
Tabular |
No |
Worst Node Hops - Worst Node Hop |
Yes |
Yes |
Various |
No |
Worst Node Hops - Worst SNR Link |
Yes |
Yes |
Various |
No |
802.11n Summary |
No |
Yes |
Graphical |
No |
Executive Summary |
No |
Yes |
Various |
No |
802.11 Counters |
Yes |
No |
Both |
Yes |
Coverage Holes |
Yes |
No |
Tabular |
No |
Network Utilization |
Yes |
Yes |
Both |
Yes |
Traffic Stream Metrics |
Yes |
Yes |
Both |
Yes |
Tx Power and Channel |
No |
No |
Graphical |
No |
VoIP Calls Graph |
No |
No |
Graphical |
No |
VoIP Calls Table |
No |
No |
Tabular |
No |
Voice Statistics |
No |
No |
Graphical |
No |
Adaptive wIPS Alarm |
Yes |
No |
Tabular |
No |
Adaptive wIPS Alarm Summary |
Yes |
No |
Both |
No |
Adaptive wIPS Top 10 APs |
Yes |
No |
Tabular |
No |
Adhoc Rogue Count Summary |
Yes |
No |
Both |
No |
Adhoc Rogues |
Yes |
No |
Tabular |
No |
New Rogue AP Count Summary |
Yes |
No |
Both |
No |
New Rogue APs |
No |
No |
Graphical |
No |
Rogue AP Count Summary |
Yes |
No |
Both |
No |
Rogue APs |
Yes |
No |
Tabular |
No |
Security Alarm Trending Summary |
Yes |
No |
Graphical |
No |
1 Sub-report Client Summary view is tabular only. The rest of the sub-reports such as Client Summary by Protocol have both report views and are customizable to show either tabular, graphical, or both. 2 Combined inventory (similar to other inventory reports: APs/Controllers/MSEs) consists of multiple sub-reports. Reports that are by model or version have both views. These views are customizable with setting such as Count of Controllers by Model. Other reports, such as Controller Inventory, are tabular only. |
Step 6 ![]() Click Customize to open a separate Create Custom Report page (see Figure 11-3).
Click Customize to open a separate Create Custom Report page (see Figure 11-3).
Figure 11-3 Customize Report View Page

a. ![]() From the Custom Report Name drop-down list, choose the report you intend to run. The Available and Selected column heading selections may change depending on the report selected.
From the Custom Report Name drop-down list, choose the report you intend to run. The Available and Selected column heading selections may change depending on the report selected.
b. ![]() From the Report View drop-down list, specify if the report should appear in tabular, graphical, or combined form (both). This option is not available on every report.
From the Report View drop-down list, specify if the report should appear in tabular, graphical, or combined form (both). This option is not available on every report.
c. ![]() Use the Add > and < Remove buttons to move highlighted column headings between the two group boxes (Available data fields and Data fields to include).
Use the Add > and < Remove buttons to move highlighted column headings between the two group boxes (Available data fields and Data fields to include).
Note ![]() Column headings in blue are mandatory in the current sub report. They cannot be removed from the Selected Columns group box.
Column headings in blue are mandatory in the current sub report. They cannot be removed from the Selected Columns group box.
d. ![]() Use the Change Order buttons (Move Up or Move Down) to determine the order of the columns in the results table. The higher the column heading appears in the Selected Columns list, the farther left it appears in the results table.
Use the Change Order buttons (Move Up or Move Down) to determine the order of the columns in the results table. The higher the column heading appears in the Selected Columns list, the farther left it appears in the results table.
e. ![]() In the Data field sorting group box, indicate your sorting preference (Ascending or Descending). Determine how the report data is sorted.
In the Data field sorting group box, indicate your sorting preference (Ascending or Descending). Determine how the report data is sorted.
–![]() You can select four data fields for which you can specify sorting order. Use the Sort by and Then by drop-down lists to select each data field for sorting.
You can select four data fields for which you can specify sorting order. Use the Sort by and Then by drop-down lists to select each data field for sorting.
–![]() For each sorted data field, select whether you want it sorted in Ascending or Descending order.
For each sorted data field, select whether you want it sorted in Ascending or Descending order.
Note ![]() Only reports in table form (rather than graphs or combined) can be sorted. Only fields that can be sorted appear in the Data field sorting drop-down lists.
Only reports in table form (rather than graphs or combined) can be sorted. Only fields that can be sorted appear in the Data field sorting drop-down lists.
f. ![]() Click Apply to confirm the changes, Reset to return columns to the default, or Cancel to close this page with no changes made.
Click Apply to confirm the changes, Reset to return columns to the default, or Cancel to close this page with no changes made.
Note ![]() The changes made in the Create Custom Report page are not saved until you click Save in the Report Details page.
The changes made in the Create Custom Report page are not saved until you click Save in the Report Details page.
Step 7 ![]() When all report parameters have been set, choose one of the following:
When all report parameters have been set, choose one of the following:
•![]() Save—Click Save to save this report setup without immediately running the report. The report automatically runs at the scheduled time.
Save—Click Save to save this report setup without immediately running the report. The report automatically runs at the scheduled time.
•![]() Save and Run—Click Save and Run to save this report setup and to immediately run the report.
Save and Run—Click Save and Run to save this report setup and to immediately run the report.
•![]() Run Now—Click Run Now to run the report without saving the report setup.
Run Now—Click Run Now to run the report without saving the report setup.
•![]() Cancel—Click Cancel to return to the previous page without running nor saving this report.
Cancel—Click Cancel to return to the previous page without running nor saving this report.
Managing Current Reports
If a report has been saved for a specific report type, you can access the current reports from the Report Launch Pad.
To access current or saved reports from the Report Launch Pad, follow these steps:
Step 1 ![]() Choose Reports > Report Launch Pad.
Choose Reports > Report Launch Pad.
Step 2 ![]() Choose the specific report from the left sidebar menu or from the main section of the Report Launch Pad. The Report Launch Pad page displays a list of current reports for this report type.
Choose the specific report from the left sidebar menu or from the main section of the Report Launch Pad. The Report Launch Pad page displays a list of current reports for this report type.
Note ![]() To view a list of saved reports, choose Reports > Saved Reports. See the "Managing Saved Reports" section for more information.
To view a list of saved reports, choose Reports > Saved Reports. See the "Managing Saved Reports" section for more information.
Managing Scheduled Run Results
To view all currently scheduled runs in the Prime Infrastructure, choose Report > Scheduled Run Results. This section contains the following topics:
Note ![]() The list of scheduled runs can be sorted by report category, report type, and time frame.
The list of scheduled runs can be sorted by report category, report type, and time frame.
The Scheduled Run Results page shows the following information:
•![]() Report Title—Identifies the user-assigned report name.
Report Title—Identifies the user-assigned report name.
Note ![]() Click the report title to view the details for this report.
Click the report title to view the details for this report.
•![]() Report Type—Identifies the specific report type.
Report Type—Identifies the specific report type.
•![]() Status—Indicates whether or not the report ran successfully.
Status—Indicates whether or not the report ran successfully.
•![]() Message—Indicates whether or not this report was saved and the filename for this report (if saved).
Message—Indicates whether or not this report was saved and the filename for this report (if saved).
•![]() Run Date/Time—Indicates the date and time that the report is scheduled to run.
Run Date/Time—Indicates the date and time that the report is scheduled to run.
•![]() History—Click the History icon to view all scheduled runs and their details for this report.
History—Click the History icon to view all scheduled runs and their details for this report.
•![]() Download—Click the Download icon to open or save a .csv/.pdf file of the report results.
Download—Click the Download icon to open or save a .csv/.pdf file of the report results.
For more information about scheduled run results, see the "Viewing or Editing Scheduled Run Details" section.
Sorting Scheduled Run Results
You can use the Show drop-down list to sort the Scheduled Run Results by category, type, and time frame:
•![]() Report Category—Choose the appropriate report category from the drop-down list or choose All.
Report Category—Choose the appropriate report category from the drop-down list or choose All.
•![]() Report Type—Choose the appropriate report type from the drop-down list or choose All. The report Type selections change depending on the selected report category.
Report Type—Choose the appropriate report type from the drop-down list or choose All. The report Type selections change depending on the selected report category.
•![]() From/To—Type the report start (From) and end (To) dates in the text boxes, or click the calendar icons to select the start and end dates.
From/To—Type the report start (From) and end (To) dates in the text boxes, or click the calendar icons to select the start and end dates.
•![]() Report Generation method—Choose the appropriate report generation method from the drop-down list. The possible methods are Scheduled, On-demand Export, and On-demand Email.
Report Generation method—Choose the appropriate report generation method from the drop-down list. The possible methods are Scheduled, On-demand Export, and On-demand Email.
Click Go to sort this list. Only reports that match your criteria appear.
Viewing or Editing Scheduled Run Details
To view or edit a saved report, follow these steps:
Step 1 ![]() Choose Report > Scheduled Run Results.
Choose Report > Scheduled Run Results.
Step 2 ![]() Click the Report Title link for the appropriate report to open the Report Details page.
Click the Report Title link for the appropriate report to open the Report Details page.
Step 3 ![]() In this page, you can view or edit the details for the scheduled run.
In this page, you can view or edit the details for the scheduled run.
Step 4 ![]() When all scheduled run parameters have been edited (if necessary), select from the following:
When all scheduled run parameters have been edited (if necessary), select from the following:
•![]() Save—Click Save to save this schedule run without immediately running the report. The report automatically runs at the scheduled time.
Save—Click Save to save this schedule run without immediately running the report. The report automatically runs at the scheduled time.
•![]() Save and Run—Click Save and Run to save this scheduled run and to immediately run the report.
Save and Run—Click Save and Run to save this scheduled run and to immediately run the report.
•![]() Cancel—Click Cancel to return to the previous page without running nor saving this report.
Cancel—Click Cancel to return to the previous page without running nor saving this report.
•![]() Delete—Click Delete to delete the current saved report.
Delete—Click Delete to delete the current saved report.
Managing Saved Reports
In the Saved Reports page, you can create and manage saved reports. To open this page in the Prime Infrastructure, choose Reports > Saved Reports.
Note ![]() The list of saved reports can be sorted by report category, report type, and scheduled status (enabled, disabled, or expired).
The list of saved reports can be sorted by report category, report type, and scheduled status (enabled, disabled, or expired).
The Saved Reports page shows the following information:
•![]() Report Title—Identifies the user-assigned report name.
Report Title—Identifies the user-assigned report name.
Note ![]() Click the report title to view the details for this report.
Click the report title to view the details for this report.
•![]() Report Type—Identifies the specific report type.
Report Type—Identifies the specific report type.
•![]() Scheduled—Indicates whether this report is enabled or disabled.
Scheduled—Indicates whether this report is enabled or disabled.
•![]() Next Schedule On—Indicates the date and time of the next scheduled run for this report.
Next Schedule On—Indicates the date and time of the next scheduled run for this report.
•![]() Last Run—Indicates the date and time of the most recent scheduled run for this report.
Last Run—Indicates the date and time of the most recent scheduled run for this report.
•![]() Download—Click the Download icon to open or save a .csv file of the report results.
Download—Click the Download icon to open or save a .csv file of the report results.
•![]() Run Now—Click the Run Now icon to immediately run the current report.
Run Now—Click the Run Now icon to immediately run the current report.
For additional information on saved reports, see the "Sorting Saved Reports" section.
Sorting Saved Reports
You can use the Show drop-down lists to sort the saved Reports list by category, type, and scheduled status (see Figure 11-4).
•![]() Report Category—Choose the appropriate report category from the drop-down list or choose All.
Report Category—Choose the appropriate report category from the drop-down list or choose All.
•![]() Report Type—Choose the appropriate report type from the drop-down list or choose All. The Report Type selections change depending on the selected report category.
Report Type—Choose the appropriate report type from the drop-down list or choose All. The Report Type selections change depending on the selected report category.
•![]() Scheduled—Choose All, Enabled, Disabled, or Expired to sort the Saved Reports list by scheduled status.
Scheduled—Choose All, Enabled, Disabled, or Expired to sort the Saved Reports list by scheduled status.
Figure 11-4 Sorting Saved Reports
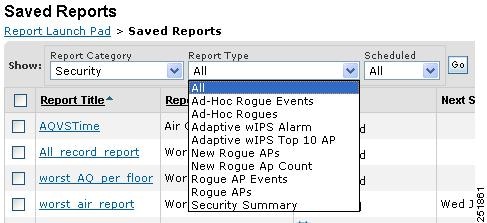
Click Go to sort this list. Only reports that match your criteria appear.
Viewing or Editing Saved Report Details
To view or edit a saved report, follow these steps:
Step 1 ![]() Choose Report > Saved Reports.
Choose Report > Saved Reports.
Step 2 ![]() Click the Report Title link for the appropriate report to open the Report Details page.
Click the Report Title link for the appropriate report to open the Report Details page.
Step 3 ![]() In the Report Details page, you can view or edit the details for the saved report.
In the Report Details page, you can view or edit the details for the saved report.
Step 4 ![]() When all report parameters have been edited, choose one of the following:
When all report parameters have been edited, choose one of the following:
•![]() Save—Click Save to save this report setup without immediately running the report. The report automatically runs at the scheduled time.
Save—Click Save to save this report setup without immediately running the report. The report automatically runs at the scheduled time.
•![]() Save and Run—Click Save and Run to save this report setup and to immediately run the report.
Save and Run—Click Save and Run to save this report setup and to immediately run the report.
•![]() Run Now—Click Run Now to run the report without saving the report setup.
Run Now—Click Run Now to run the report without saving the report setup.
•![]() Cancel—Click Cancel to return to the previous page without running nor saving this report.
Cancel—Click Cancel to return to the previous page without running nor saving this report.
•![]() Delete—Click Delete to delete the current saved report.
Delete—Click Delete to delete the current saved report.
Generating MSE Analytics Reports
MSE Analytics reports are generated based on location history data. This section lists and describes the various MSE analytics reports that you can generate through the Prime Infrastructure Report Launch Pad.
To generate a MSE analytics report, click New that is next to a type to create a new report. See "Managing Saved Reports" section for more information.
Click a report type to view currently saved reports. In this page, you can enable, disable, delete, or run currently saved reports. See the "Managing Current Reports" section for more information.
This section describes the MSE Analytics report that you can create and contains the following topics:
•![]() Location Notifications by Zone
Location Notifications by Zone
•![]() Rogue Client Location Density
Rogue Client Location Density
Client Location
This report shows historical location information of a wireless client detected by an MSE.
Note ![]() The Client Location report is not filtered in non-root virtual domain.
The Client Location report is not filtered in non-root virtual domain.
This section contains the following topics:
•![]() Configuring a Client Location Report
Configuring a Client Location Report
Configuring a Client Location Report
The client location history report results are available only in the root domain. To configure a Client Location History Report, follow these steps:
Settings
•![]() Report Title—If you plan to save this report, enter a report name.
Report Title—If you plan to save this report, enter a report name.
•![]() Report By—By default, Client MAC Address is selected.
Report By—By default, Client MAC Address is selected.
•![]() Report Criteria—Click Edit and enter a valid MAC address as the filter criteria.
Report Criteria—Click Edit and enter a valid MAC address as the filter criteria.
Note ![]() In the Report Criteria page, click Select to confirm your filter criteria or Close to return to the previous page.
In the Report Criteria page, click Select to confirm your filter criteria or Close to return to the previous page.
•![]() Reporting Period
Reporting Period
–![]() Select the radio button and choose a period of time from the drop-down list.
Select the radio button and choose a period of time from the drop-down list.
or
–![]() Select the From radio button and enter the From and To dates and times. You can type a date in the text box, or click the Calendar icon to choose a date. Choose the hours and minutes from the drop-down lists.
Select the From radio button and enter the From and To dates and times. You can type a date in the text box, or click the Calendar icon to choose a date. Choose the hours and minutes from the drop-down lists.
Note ![]() The reporting period is based on the alarm last seen time. The times are in the UTC time zone.
The reporting period is based on the alarm last seen time. The times are in the UTC time zone.
Schedule
If you plan to run this report at a later time or as a recurring report, enter the scheduling parameters. See the "Managing Saved Reports" section for more information on scheduling a report.
Customize Report Form
The Customize Report form allows you to customize the report results. See the "Managing Saved Reports" section for more information on customizing report results.
Note ![]() Fixed columns appear in blue font and cannot be moved to the available columns.
Fixed columns appear in blue font and cannot be moved to the available columns.
Client Location Results
The results of the Client Location History report contain the following information:
•![]() Last Located—The time when the client was located.
Last Located—The time when the client was located.
•![]() Client Location—The position of the client at the located time.
Client Location—The position of the client at the located time.
•![]() MSE—The name of the MSE that located this client.
MSE—The name of the MSE that located this client.
•![]() User—The username of the client.
User—The username of the client.
•![]() Detecting Controllers—The IP address of the detecting controller.
Detecting Controllers—The IP address of the detecting controller.
•![]() 802.11 State—The state of 802.11. It can be either Probing or Associated.
802.11 State—The state of 802.11. It can be either Probing or Associated.
•![]() IP Address—The IP address of the client.
IP Address—The IP address of the client.
•![]() AP MAC Address—The MAC address of the associated access point.
AP MAC Address—The MAC address of the associated access point.
•![]() Authenticated—Whether authenticated or not. This can be either Yes or No.
Authenticated—Whether authenticated or not. This can be either Yes or No.
•![]() SSID—The SSID used by the client.
SSID—The SSID used by the client.
•![]() Protocol—The protocol used to retrieve the information from the client.
Protocol—The protocol used to retrieve the information from the client.
Note ![]() The location field in this report is a hyperlink and clicking that hyperlink shows the location of the client in the floor map at the located time.
The location field in this report is a hyperlink and clicking that hyperlink shows the location of the client in the floor map at the located time.
Client Location Density
This report shows wireless clients and their locations detected by the MSEs based on your filtering criteria.
This section contains the following topics:
•![]() Configuring a Client Location Density Report
Configuring a Client Location Density Report
•![]() Client Location Density Results
Client Location Density Results
Configuring a Client Location Density Report
This section describes how to configure a Client Location Density Report and contains the following topics:
•![]() "Customize Report Form" section
"Customize Report Form" section
Settings
•![]() Report Title—If you plan to save this report, enter a report name.
Report Title—If you plan to save this report, enter a report name.
•![]() Report by
Report by
–![]() MSE By Floor Area
MSE By Floor Area
–![]() MSE By Outdoor Area
MSE By Outdoor Area
–![]() MSE
MSE
•![]() Report Criteria—The report criteria differs based on the Report By option selected. Click Edit and select the required filter criteria.
Report Criteria—The report criteria differs based on the Report By option selected. Click Edit and select the required filter criteria.
Note ![]() In the Report Criteria page, click Select to confirm your filter criteria or Close to return to the previous page.
In the Report Criteria page, click Select to confirm your filter criteria or Close to return to the previous page.
•![]() Reporting Period
Reporting Period
–![]() Select the radio button and choose a period of time from the drop-down list.
Select the radio button and choose a period of time from the drop-down list.
or
–![]() Select the From radio button and enter the From and To dates and times. You can type a date in the text box, or click the calendar icon to choose a date. Select the hours and minutes from the drop-down lists.
Select the From radio button and enter the From and To dates and times. You can type a date in the text box, or click the calendar icon to choose a date. Select the hours and minutes from the drop-down lists.
Note ![]() The reporting period is based on the alarm last seen time. The times are in the UTC time zone.
The reporting period is based on the alarm last seen time. The times are in the UTC time zone.
Schedule
If you plan to run this report at a later time or as a recurring report, enter the scheduling parameters. See the "Managing Saved Reports" section for more information on scheduling a report.
Customize Report Form
The Customize Report form allows you to customize the report results. See the "Managing Saved Reports" section for more information on customizing report results.
Note ![]() Fixed columns appear in blue font and cannot be moved to the Available columns.
Fixed columns appear in blue font and cannot be moved to the Available columns.
Client Location Density Results
The results of the Client Location Density report contain the following information:
•![]() Last Located—The time when the client was last located during the selected Report Time criteria.
Last Located—The time when the client was last located during the selected Report Time criteria.
•![]() MAC Address—The MAC address of the client.
MAC Address—The MAC address of the client.
•![]() Client Location—The position of the client at the located time.
Client Location—The position of the client at the located time.
•![]() MSE—The name of the MSE that located this client.
MSE—The name of the MSE that located this client.
•![]() User—The username of the client.
User—The username of the client.
•![]() Detecting Controllers—The IP address of the detecting controller.
Detecting Controllers—The IP address of the detecting controller.
•![]() 802.11 State—The state of 802.11. It can be either Probing or Associated.
802.11 State—The state of 802.11. It can be either Probing or Associated.
•![]() IP Address—The IP address of the client.
IP Address—The IP address of the client.
•![]() SSID—The SSID used by the client.
SSID—The SSID used by the client.
•![]() Protocol—The protocol used to retrieve the information from the client.
Protocol—The protocol used to retrieve the information from the client.
Note ![]() The location field in this report is a hyperlink and clicking that hyperlink shows the location of the client in the floor map at the located time.
The location field in this report is a hyperlink and clicking that hyperlink shows the location of the client in the floor map at the located time.
Device Count by Zone
This report provides the count of devices detected by an MSE in the selected zone. This section contains the following topics:
This sections contains the following topics:
•![]() Configuring a Device Count by Zone Report
Configuring a Device Count by Zone Report
Configuring a Device Count by Zone Report
This section describes how to configure a Device Count by Zone Report and contains the following topics:
Settings
•![]() Report Title—If you plan to save this report, enter a report name.
Report Title—If you plan to save this report, enter a report name.
•![]() Report By
Report By
–![]() Indoor Area
Indoor Area
–![]() Outdoor Area
Outdoor Area
•![]() Report Criteria—The report criteria differs based on the Report By option selected. Click Edit and select the required filter criteria.
Report Criteria—The report criteria differs based on the Report By option selected. Click Edit and select the required filter criteria.
Note ![]() In the Report Criteria page, click Select to confirm your criteria or Close to return to the previous page.
In the Report Criteria page, click Select to confirm your criteria or Close to return to the previous page.
•![]() Device Type
Device Type
–![]() All
All
–![]() Clients
Clients
–![]() Tags
Tags
–![]() RogueClients
RogueClients
–![]() Rogue APs
Rogue APs
–![]() Interferers
Interferers
•![]() Reporting Period
Reporting Period
–![]() Select the radio button and choose a period of time from the drop-down list.
Select the radio button and choose a period of time from the drop-down list.
or
–![]() Select the From radio button and enter the From and To dates and times. You can type a date in the text box, or click the Calendar icon to choose a date. Select the hours and minutes from the drop-down lists.
Select the From radio button and enter the From and To dates and times. You can type a date in the text box, or click the Calendar icon to choose a date. Select the hours and minutes from the drop-down lists.
Note ![]() The reporting period is based on the alarm last seen. The times are in the UTC time zone.
The reporting period is based on the alarm last seen. The times are in the UTC time zone.
Schedule
If you plan to run this report at a later time or as a recurring report, enter the scheduling parameters. See the "Managing Saved Reports" section for more information on scheduling a report.
Customize Report Form
The Customize Report form allows you to customize the report results. See the "Managing Saved Reports" section for more information on customizing report results.
Note ![]() Fixed columns appear in blue font and cannot be moved to the Available columns.
Fixed columns appear in blue font and cannot be moved to the Available columns.
Device Count by Zone Results
The results of the Device Count by Zone report contains the following information:
•![]() MSE—The name of the MSE that located this client
MSE—The name of the MSE that located this client
•![]() Zone—Device count by zone results
Zone—Device count by zone results
•![]() Device Type—Type of the device
Device Type—Type of the device
•![]() MSE Analytics Report Link—Link to get the MSE analytics report
MSE Analytics Report Link—Link to get the MSE analytics report
Device Dwell Time by Zone
This report provides the Dwell Time Report for a device detected by an MSE. This section contains the following topics:
This sections contains the following topics:
•![]() Configuring a Device Count by Zone Report
Configuring a Device Count by Zone Report
•![]() Device Count by Zone Results
Device Count by Zone Results
Configuring a Device Dwell Time by Zone Report
This section describes how to configure a Device Dwell Count Time by Zone Report and contains the following topics:
Settings
•![]() Report Title—If you plan to save this report, enter a report name.
Report Title—If you plan to save this report, enter a report name.
•![]() Report By
Report By
–![]() Indoor Area
Indoor Area
–![]() Outdoor Area
Outdoor Area
•![]() Report Criteria—The report criteria differs based on the Report By option selected. Click Edit and select the required filter criteria.
Report Criteria—The report criteria differs based on the Report By option selected. Click Edit and select the required filter criteria.
Note ![]() In the Report Criteria page, click Select to confirm your criteria or Close to return to the previous page.
In the Report Criteria page, click Select to confirm your criteria or Close to return to the previous page.
•![]() Device Type
Device Type
–![]() All
All
–![]() Client
Client
–![]() Tags
Tags
–![]() Rogue Clients
Rogue Clients
–![]() Rogue APs
Rogue APs
–![]() Interferers
Interferers
•![]() Reporting Period
Reporting Period
–![]() Select the radio button and choose a period of time from the drop-down list.
Select the radio button and choose a period of time from the drop-down list.
or
–![]() Select the From radio button and enter the From and To dates and times. You can type a date in the text box, or click the Calendar icon to choose a date. Select the hours and minutes from the drop-down lists.
Select the From radio button and enter the From and To dates and times. You can type a date in the text box, or click the Calendar icon to choose a date. Select the hours and minutes from the drop-down lists.
Note ![]() The reporting period is based on the alarm last seem. The times are in the UTC time zone.
The reporting period is based on the alarm last seem. The times are in the UTC time zone.
Schedule
If you plan to run this report at a later time or as a recurring report, enter the scheduling parameters. See the "Managing Saved Reports" section for more information on scheduling a report.
Customize Report Form
The Customize Report form allows you to customize the report results. See the "Managing Saved Reports" section for more information on customizing report results.
Note ![]() Fixed columns appear in blue font and cannot be moved to the Available columns.
Fixed columns appear in blue font and cannot be moved to the Available columns.
Device Dwell Time by Zone Results
The results of the Device Dwell Time by Zone report contains the following information:
•![]() MSE—The name of the MSE that located this client.
MSE—The name of the MSE that located this client.
•![]() Zone—Device Count by Zone Results
Zone—Device Count by Zone Results
•![]() Device Type—Type of the device
Device Type—Type of the device
•![]() MSE Analytics Report Link—Link to get the MSE analytics report.
MSE Analytics Report Link—Link to get the MSE analytics report.
Guest Location Density
This report shows Guest clients and their locations detected by the MSEs based on your filtering criteria.
This section contains the following topics:
•![]() Configuring Guest Location Tracking
Configuring Guest Location Tracking
•![]() Guest Location Tracking Results
Guest Location Tracking Results
Configuring Guest Location Tracking
This section describes how to configure a Guest Location Tracking report and contains the following topics:
•![]() "Customize Report Form" section
"Customize Report Form" section
Settings
•![]() Report Title—If you plan to save this report, enter a report name.
Report Title—If you plan to save this report, enter a report name.
•![]() Report by
Report by
–![]() MSE By Floor Area
MSE By Floor Area
–![]() MSE By Outdoor Area
MSE By Outdoor Area
–![]() MSE
MSE
•![]() Report Criteria—The report criteria differs based on the Report By option selected. Click Edit and select the required filter criteria.
Report Criteria—The report criteria differs based on the Report By option selected. Click Edit and select the required filter criteria.
Note ![]() In the Report Criteria page, click Select to confirm your filter criteria or Close to return to the previous page.
In the Report Criteria page, click Select to confirm your filter criteria or Close to return to the previous page.
•![]() Reporting Period
Reporting Period
–![]() Select the radio button and choose a period of time from the drop-down list.
Select the radio button and choose a period of time from the drop-down list.
or
–![]() Select the From radio button and enter the From and To dates and times. You can type a date in the text box, or click the Calendar icon to choose a date. Choose the hours and minutes from the drop-down lists.
Select the From radio button and enter the From and To dates and times. You can type a date in the text box, or click the Calendar icon to choose a date. Choose the hours and minutes from the drop-down lists.
Note ![]() The reporting period is based on the alarm last seen time. The times are in the UTC time zone.
The reporting period is based on the alarm last seen time. The times are in the UTC time zone.
Schedule
If you plan to run this report at a later time or as a recurring report, enter the scheduling parameters. See the "Managing Saved Reports" section for more information on scheduling a report.
Customize Report Form
The Customize Report form allows you to customize the report results. See the "Managing Saved Reports" section for more information on customizing report results.
Note ![]() Fixed columns appear in blue font and cannot be moved to the Available columns.
Fixed columns appear in blue font and cannot be moved to the Available columns.
Guest Location Tracking Results
The results of the Guest Location Tracking report contain the following information:
•![]() Last Located—The time when the Guest client was last located during the selected Report Time criteria.
Last Located—The time when the Guest client was last located during the selected Report Time criteria.
•![]() Guest Username—The login name of the guest client user.
Guest Username—The login name of the guest client user.
•![]() MAC Address—The MAC address of the guest client.
MAC Address—The MAC address of the guest client.
•![]() Guest Location—The position of the guest client at the located time.
Guest Location—The position of the guest client at the located time.
•![]() MSE—The name of the MSE that located this guest client.
MSE—The name of the MSE that located this guest client.
•![]() Detecting Controllers—The IP address of the detecting controller.
Detecting Controllers—The IP address of the detecting controller.
•![]() IP Address—The IP address of the guest client.
IP Address—The IP address of the guest client.
•![]() AP MAC Address—The MAC address of the access point to which the guest client is associated with.
AP MAC Address—The MAC address of the access point to which the guest client is associated with.
•![]() SSID—The SSID used by the guest client.
SSID—The SSID used by the guest client.
•![]() Protocol—The protocol used to retrieve the information from the guest client.
Protocol—The protocol used to retrieve the information from the guest client.
Note ![]() The location field in this report is a hyperlink and clicking that hyperlink shows the location of the guest in the floor map at the located time.
The location field in this report is a hyperlink and clicking that hyperlink shows the location of the guest in the floor map at the located time.
Location Notifications by Zone
This report shows Context-Aware notifications generated by MSEs. This report allows you to get missing device and device in/out notifications by the MSE, floor area, and outdoor area. This report is generated using CAS notifications and MSE notifications stored in the Prime Infrastructure database.
Note ![]() This report is not filtered in non-root virtual domain.
This report is not filtered in non-root virtual domain.
This section contains the following topics:
•![]() Configuring a Location Notification Report
Configuring a Location Notification Report
•![]() Location Notification Results
Location Notification Results
Configuring a Location Notification Report
•![]() This section describes how to configure a Location Notification report and contains the following topics:
This section describes how to configure a Location Notification report and contains the following topics:
Settings
•![]() Report Title—If you plan to save this report, enter a report name.
Report Title—If you plan to save this report, enter a report name.
•![]() Report by
Report by
–![]() Missing Device Notifications by MSE
Missing Device Notifications by MSE
–![]() Missing Device Notifications by Floor Area
Missing Device Notifications by Floor Area
–![]() Missing Device Notifications by Outdoor Area
Missing Device Notifications by Outdoor Area
–![]() Device In/Out Notifications by MSE
Device In/Out Notifications by MSE
–![]() Device In/Out Notifications by Floor Area
Device In/Out Notifications by Floor Area
–![]() Device In/Out Notifications by Outdoor Area
Device In/Out Notifications by Outdoor Area
•![]() Report Criteria—The report criteria differs based on the Report By option selected. Click Edit and select the required filter criteria.
Report Criteria—The report criteria differs based on the Report By option selected. Click Edit and select the required filter criteria.
Note ![]() In the Report Criteria page, click Select to confirm your filter criteria or Close to return to the previous page.
In the Report Criteria page, click Select to confirm your filter criteria or Close to return to the previous page.
•![]() Device Type
Device Type
–![]() All
All
–![]() Client
Client
–![]() Tag
Tag
–![]() Rogue Client
Rogue Client
–![]() Rogue AP
Rogue AP
–![]() Interferer
Interferer
•![]() Reporting Period
Reporting Period
–![]() Select the radio button and choose a period of time from the drop-down list.
Select the radio button and choose a period of time from the drop-down list.
or
–![]() Select the From radio button and enter the From and To dates and times. You can type a date in the text box or click the calendar icon to choose a date. Choose the hours and minutes from the drop-down lists.
Select the From radio button and enter the From and To dates and times. You can type a date in the text box or click the calendar icon to choose a date. Choose the hours and minutes from the drop-down lists.
Note ![]() The reporting period is based on the alarm last seen time. The times are in the UTC time zone.
The reporting period is based on the alarm last seen time. The times are in the UTC time zone.
Schedule
If you plan to run this report at a later time or as a recurring report, enter the scheduling parameters. See the "Managing Saved Reports" section for more information on scheduling a report.
Customize Report Form
The Customize Report form allows you to customize the report results. See the "Managing Saved Reports" section for more information on customizing report results.
Note ![]() Fixed columns appear in blue font and cannot be moved to the Available columns.
Fixed columns appear in blue font and cannot be moved to the Available columns.
Location Notification Results
The results of the Location Notification report contain the following information:
•![]() Last Seen—The date and time when the device was last located.
Last Seen—The date and time when the device was last located.
•![]() MAC Address—The MAC address of the device.
MAC Address—The MAC address of the device.
•![]() Device Type—The type of the device.
Device Type—The type of the device.
•![]() Asset Name—The name of the asset.
Asset Name—The name of the asset.
•![]() Asset Group—The name of the asset group.
Asset Group—The name of the asset group.
•![]() Asset Category—The name of the asset category.
Asset Category—The name of the asset category.
•![]() Map Location—The map location where the device was located.
Map Location—The map location where the device was located.
•![]() ServerName—The name of the server that sends the ContextAware notifications.
ServerName—The name of the server that sends the ContextAware notifications.
Mobile MAC Statistics
This report shows the most active Mobile Mac addressed based on click count by MSAP servers or by venues.
•![]() Configuring Rogue AP Location Tracking
Configuring Rogue AP Location Tracking
•![]() Rogue AP Location Tracking Results
Rogue AP Location Tracking Results
Configuring Mobile MAC Statistics
This section describes how to configure a Mobile MAC Statistics report and contains the following topics:
•![]() "Customize Report Form" section
"Customize Report Form" section
Settings
•![]() Report Title—If you plan to save this report, enter a report name.
Report Title—If you plan to save this report, enter a report name.
•![]() Report by
Report by
–![]() MSE By Floor Area
MSE By Floor Area
–![]() MSE By Outdoor Area
MSE By Outdoor Area
–![]() MSE
MSE
•![]() Report Criteria—The report criteria differs based on the Report By option selected. Click Edit and select the required filter criteria.
Report Criteria—The report criteria differs based on the Report By option selected. Click Edit and select the required filter criteria.
Note ![]() In the Report Criteria page, click Select to confirm your filter criteria or Close to return to the previous page.
In the Report Criteria page, click Select to confirm your filter criteria or Close to return to the previous page.
•![]() Reporting Period
Reporting Period
–![]() Select the radio button and choose a period of time from the drop-down list.
Select the radio button and choose a period of time from the drop-down list.
or
–![]() Select the From radio button and enter the From and To dates and times. You can type a date in the text box, or click the calendar icon to choose a date. Choose the hours and minutes from the drop-down lists.
Select the From radio button and enter the From and To dates and times. You can type a date in the text box, or click the calendar icon to choose a date. Choose the hours and minutes from the drop-down lists.
Note ![]() The reporting period is based on the alarm last seen time. The times are in the UTC time zone.
The reporting period is based on the alarm last seen time. The times are in the UTC time zone.
Schedule
If you plan to run this report at a later time or as a recurring report, enter the scheduling parameters. See the "Managing Saved Reports" section for more information on scheduling a report.
Customize Report Form
The Customize Report form allows you to customize the report results. See the "Managing Saved Reports" section for more information on customizing report results.
Note ![]() Fixed columns appear in blue font and cannot be moved to the Available columns.
Fixed columns appear in blue font and cannot be moved to the Available columns.
Mobile MAC Statistics
The results of the Mobile MAC Statistics report contain the following information:
•![]() Venue
Venue
•![]() Click Count
Click Count
•![]() Mobile MAC Address
Mobile MAC Address
Note ![]() The location field in this report is a hyperlink and clicking that hyperlink shows the location of the rogue AP in the floor map at the located time.
The location field in this report is a hyperlink and clicking that hyperlink shows the location of the rogue AP in the floor map at the located time.
Rogue AP Location Density
This report shows Rogue APs and their locations detected by the MSEs based on your filtering criteria.
This section contains the following topics:
•![]() Configuring Rogue AP Location Tracking
Configuring Rogue AP Location Tracking
•![]() Rogue AP Location Tracking Results
Rogue AP Location Tracking Results
Configuring Rogue AP Location Tracking
This section describes how to configure a Rogue AP Location Tracking report and contains the following topics:
•![]() "Customize Report Form" section
"Customize Report Form" section
Settings
•![]() Report Title—If you plan to save this report, enter a report name.
Report Title—If you plan to save this report, enter a report name.
•![]() Report by
Report by
–![]() MSE By Floor Area
MSE By Floor Area
–![]() MSE By Outdoor Area
MSE By Outdoor Area
–![]() MSE
MSE
•![]() Report Criteria—The report criteria differs based on the Report By option selected. Click Edit and select the required filter criteria.
Report Criteria—The report criteria differs based on the Report By option selected. Click Edit and select the required filter criteria.
Note ![]() In the Report Criteria page, click Select to confirm your filter criteria or Close to return to the previous page.
In the Report Criteria page, click Select to confirm your filter criteria or Close to return to the previous page.
•![]() Reporting Period
Reporting Period
–![]() Select the radio button and choose a period of time from the drop-down list.
Select the radio button and choose a period of time from the drop-down list.
or
–![]() Select the From radio button and enter the From and To dates and times. You can type a date in the text box, or click the calendar icon to choose a date. Choose the hours and minutes from the drop-down lists.
Select the From radio button and enter the From and To dates and times. You can type a date in the text box, or click the calendar icon to choose a date. Choose the hours and minutes from the drop-down lists.
Note ![]() The reporting period is based on the alarm last seen time. The times are in the UTC time zone.
The reporting period is based on the alarm last seen time. The times are in the UTC time zone.
Schedule
If you plan to run this report at a later time or as a recurring report, enter the scheduling parameters. See the "Managing Saved Reports" section for more information on scheduling a report.
Customize Report Form
The Customize Report form allows you to customize the report results. See the "Managing Saved Reports" section for more information on customizing report results.
Note ![]() Fixed columns appear in blue font and cannot be moved to the Available columns.
Fixed columns appear in blue font and cannot be moved to the Available columns.
Rogue AP Location Tracking Results
The results of the Rogue AP Location Tracking report contain the following information:
•![]() Last Located—The time when the Rogue AP was last located during the selected Report Time criteria.
Last Located—The time when the Rogue AP was last located during the selected Report Time criteria.
•![]() MAC Address—The MAC address of the rogue access point.
MAC Address—The MAC address of the rogue access point.
•![]() Rogue AP Location—The position of the Rogue AP at the located time.
Rogue AP Location—The position of the Rogue AP at the located time.
•![]() MSE—The name of the MSE that located this Rogue AP.
MSE—The name of the MSE that located this Rogue AP.
•![]() State—The state of the Rogue AP.
State—The state of the Rogue AP.
Note ![]() The location field in this report is a hyperlink and clicking that hyperlink shows the location of the rogue AP in the floor map at the located time.
The location field in this report is a hyperlink and clicking that hyperlink shows the location of the rogue AP in the floor map at the located time.
Rogue Client Location Density
This report shows Rogue Client APs and their locations detected by the MSEs based on your filtering criteria.
This section contains the following topics:
•![]() Configuring a Rogue Client Location Tracking
Configuring a Rogue Client Location Tracking
•![]() Rogue Client Location Tracking Results
Rogue Client Location Tracking Results
Configuring a Rogue Client Location Tracking
This section describes how to configure a Rogue Client Location Tracking report and contains the following topics:
•![]() "Customize Report Form" section
"Customize Report Form" section
Settings
•![]() Report Title—If you plan to save this report, enter a report name.
Report Title—If you plan to save this report, enter a report name.
•![]() Report by
Report by
–![]() MSE By Floor Area
MSE By Floor Area
–![]() MSE By Outdoor Area
MSE By Outdoor Area
–![]() MSE
MSE
•![]() Report Criteria—The report criteria differs based on the Report By option selected. Click Edit and select the required filter criteria.
Report Criteria—The report criteria differs based on the Report By option selected. Click Edit and select the required filter criteria.
Note ![]() In the Report Criteria page, click Select to confirm your filter criteria or Close to return to the previous page.
In the Report Criteria page, click Select to confirm your filter criteria or Close to return to the previous page.
•![]() Reporting Period
Reporting Period
–![]() Select the radio button and choose a period of time from the drop-down list.
Select the radio button and choose a period of time from the drop-down list.
or
–![]() Select the From radio button and enter the From and To dates and times. You can type a date in the text box, or click the calendar icon to choose a date. Choose the hours and minutes from the drop-down lists.
Select the From radio button and enter the From and To dates and times. You can type a date in the text box, or click the calendar icon to choose a date. Choose the hours and minutes from the drop-down lists.
Note ![]() The reporting period is based on the alarm last seen time. The times are in the UTC time zone.
The reporting period is based on the alarm last seen time. The times are in the UTC time zone.
Schedule
If you plan to run this report at a later time or as a recurring report, enter the scheduling parameters. See the "Managing Saved Reports" section for more information on scheduling a report.
Customize Report Form
The Customize Report form allows you to customize the report results. See the "Managing Saved Reports" section for more information on customizing report results.
Note ![]() Fixed columns appear in blue font and cannot be moved to the Available columns.
Fixed columns appear in blue font and cannot be moved to the Available columns.
Rogue Client Location Tracking Results
The results of the Rogue Client Location Tracking report contain the following information:
•![]() Last Located—The time when the rogue client was last located during the selected Report Time criteria.
Last Located—The time when the rogue client was last located during the selected Report Time criteria.
•![]() MAC Address—The MAC address of the rogue client.
MAC Address—The MAC address of the rogue client.
•![]() Rogue Client Location—The position of the rogue client at the located time.
Rogue Client Location—The position of the rogue client at the located time.
•![]() MSE—The name of the MSE that located this rogue client.
MSE—The name of the MSE that located this rogue client.
•![]() Rogue AP—The rogue access point to which the rogue client is associated with.
Rogue AP—The rogue access point to which the rogue client is associated with.
•![]() Detecting Controllers—The IP address of the detecting controller.
Detecting Controllers—The IP address of the detecting controller.
•![]() State—The state of the Rogue client.
State—The state of the Rogue client.
Note ![]() The location field in this report is a hyperlink and clicking that hyperlink shows the location of the rogue client in the floor map at the located time.
The location field in this report is a hyperlink and clicking that hyperlink shows the location of the rogue client in the floor map at the located time.
Tag Location
This report shows the location history of a tag detected by an MSE.
This section contains the following topics:
•![]() Configuring a Tag Location Tracking
Configuring a Tag Location Tracking
•![]() Tag Location Tracking Results
Tag Location Tracking Results
Configuring Tag Location History
This section describes procedures to configure a Tag Location History report and contains the following topics:
•![]() "Customize Report Form" section
"Customize Report Form" section
Settings
•![]() Report Title—If you plan save this report, enter a report name.
Report Title—If you plan save this report, enter a report name.
•![]() Report by
Report by
–![]() Tag MAC address.
Tag MAC address.
•![]() Report Criteria—Click Edit and enter a valid Tag MAC address as the filter criteria.
Report Criteria—Click Edit and enter a valid Tag MAC address as the filter criteria.
Note ![]() In the Report Criteria page, click Select to confirm your filter criteria or Close to return to the previous page.
In the Report Criteria page, click Select to confirm your filter criteria or Close to return to the previous page.
•![]() Reporting Period
Reporting Period
–![]() Select the radio button and choose a period of time from the drop-down list.
Select the radio button and choose a period of time from the drop-down list.
or
–![]() Select the From radio button and enter the From and To dates and times. You can type a date in the text box, or click the calendar icon to choose a date. Choose the hours and minutes from the drop-down lists.
Select the From radio button and enter the From and To dates and times. You can type a date in the text box, or click the calendar icon to choose a date. Choose the hours and minutes from the drop-down lists.
Note ![]() The reporting period is based on the alarm last seen time. The times are in the UTC time zone.
The reporting period is based on the alarm last seen time. The times are in the UTC time zone.
Schedule
If you plan to run this report at a later time or as a recurring report, enter the scheduling parameters. See the "Managing Saved Reports" section for more information on scheduling a report.
Customize Report Form
The Customize Report form allows you to customize the report results. See the "Managing Saved Reports" section for more information on customizing report results.
Note ![]() Fixed columns appear in blue font and cannot be moved to the Available columns.
Fixed columns appear in blue font and cannot be moved to the Available columns.
Tag Location History Results
The results of Tag Location History report contains the following information:
•![]() Last Located—The time when the tag was last located during the selected Report Time criteria.
Last Located—The time when the tag was last located during the selected Report Time criteria.
•![]() Tag Location—The position of the tag at the located time.
Tag Location—The position of the tag at the located time.
•![]() MSE—The name of the MSE that located this tag.
MSE—The name of the MSE that located this tag.
•![]() Detecting Controller—The IP address of the detecting controller.
Detecting Controller—The IP address of the detecting controller.
•![]() Vendor—The name of the vendor for the client.
Vendor—The name of the vendor for the client.
•![]() Battery Status—The battery status of the client.
Battery Status—The battery status of the client.
Note ![]() The location field in this report is a hyperlink and clicking that hyperlink shows the location of the tag in the floor map at the located time.
The location field in this report is a hyperlink and clicking that hyperlink shows the location of the tag in the floor map at the located time.
Tag Location Density
This report shows tags and their locations detected by the MSEs based on your filtering criteria.
This section contains the following topics:
•![]() Configuring a Tag Location Tracking
Configuring a Tag Location Tracking
•![]() Tag Location Tracking Results
Tag Location Tracking Results
Configuring a Tag Location Tracking
This section describes procedures to configure a Tag Location Tracking report and contains the following topics:
Settings
•![]() Report Title—If you plan to save this report, enter a report name.
Report Title—If you plan to save this report, enter a report name.
•![]() Report by
Report by
–![]() MSE By Floor Area.
MSE By Floor Area.
–![]() MSE By Outdoor Area
MSE By Outdoor Area
–![]() MSE
MSE
•![]() Report Criteria—The report criteria differs based on the Report By option selected. Click Edit and select the required filter criteria.
Report Criteria—The report criteria differs based on the Report By option selected. Click Edit and select the required filter criteria.
Note ![]() In the Report Criteria page, click Select to confirm your filter criteria or Close to return to the previous page.
In the Report Criteria page, click Select to confirm your filter criteria or Close to return to the previous page.
•![]() Reporting Period
Reporting Period
–![]() Select the radio button and choose a period of time from the drop-down list.
Select the radio button and choose a period of time from the drop-down list.
or
–![]() Select the From radio button and enter the From and To dates and times. You can type a date in the text box, or click the calendar icon to choose a date. Select the hours and minutes from the drop-down lists.
Select the From radio button and enter the From and To dates and times. You can type a date in the text box, or click the calendar icon to choose a date. Select the hours and minutes from the drop-down lists.
Note ![]() The reporting period is based on the alarm last seen time. The times are in the UTC time zone.
The reporting period is based on the alarm last seen time. The times are in the UTC time zone.
Schedule
If you plan to run this report at a later time or as a recurring report, enter the scheduling parameters. See the "Managing Saved Reports" section for more information on scheduling a report.
Customize Report Form
The Customize Report form allows you to customize the report results. See the "Managing Saved Reports" section for more information on customizing report results.
Note ![]() Fixed columns appear in blue font and cannot be moved to the Available columns.
Fixed columns appear in blue font and cannot be moved to the Available columns.
Tag Location Tracking Results
The results of the Tag Location Tracking report contain the following information:
•![]() Last Located—The time when the tag was last located during the selected Report Time criteria.
Last Located—The time when the tag was last located during the selected Report Time criteria.
•![]() Tag Location—The position of the tag at the located time.
Tag Location—The position of the tag at the located time.
•![]() MSE—The name of the MSE that located this tag.
MSE—The name of the MSE that located this tag.
•![]() Detecting Controller—The IP address of the detecting controller.
Detecting Controller—The IP address of the detecting controller.
•![]() Vendor—The name of the tag vendor.
Vendor—The name of the tag vendor.
•![]() Battery Status—The status of the battery of that tag.
Battery Status—The status of the battery of that tag.
Note ![]() The location field in this report is a hyperlink and clicking that hyperlink shows the location of the tag in the floor map at the located time.
The location field in this report is a hyperlink and clicking that hyperlink shows the location of the tag in the floor map at the located time.
Creating a Device Utilization Report
To create a device utilization report for the mobility services engine, follow these steps:
Step 1 ![]() Choose Reports > Report Launch Pad.
Choose Reports > Report Launch Pad.
Step 2 ![]() Choose Device > Utilization.
Choose Device > Utilization.
Step 3 ![]() Click New. The Utilization Report Details page appears.
Click New. The Utilization Report Details page appears.
Step 4 ![]() In the Reports Details page, enter the following Settings parameters:
In the Reports Details page, enter the following Settings parameters:
Note ![]() Certain parameters may or may not work depending on the report type.
Certain parameters may or may not work depending on the report type.
•![]() Report Title—If you plan to save this report, enter a report name.
Report Title—If you plan to save this report, enter a report name.
•![]() Report Type—By default, the report type is selected as MSE.
Report Type—By default, the report type is selected as MSE.
•![]() Report By—Choose the appropriate Report By category from the drop-down list. The categories differ for each report. See specific report sections for Report By categories for each report.
Report By—Choose the appropriate Report By category from the drop-down list. The categories differ for each report. See specific report sections for Report By categories for each report.
•![]() Report Criteria—The parameter allows you to sort your results depending on the previous Report By selection made. Click Edit to open the Filter Criteria page.
Report Criteria—The parameter allows you to sort your results depending on the previous Report By selection made. Click Edit to open the Filter Criteria page.
•![]() Connection Protocol—Choose one of these protocols: All Clients, All Wired (802.3), All Wireless (802.11), 802.11a/n, 802.11b/g/n, 802.11a, 802.11b, 802.11g, 802.11n (5-GHz), or 802.11n (2.4-GHz).
Connection Protocol—Choose one of these protocols: All Clients, All Wired (802.3), All Wireless (802.11), 802.11a/n, 802.11b/g/n, 802.11a, 802.11b, 802.11g, 802.11n (5-GHz), or 802.11n (2.4-GHz).
•![]() SSID—All SSIDs is the default value.
SSID—All SSIDs is the default value.
•![]() Reporting Period—You can define the report to collect data hourly, weekly, or at a specific date and time. The selected reporting period type is displayed on the x-axis.
Reporting Period—You can define the report to collect data hourly, weekly, or at a specific date and time. The selected reporting period type is displayed on the x-axis.
Note ![]() The reporting period uses a 24-hour rather than a 12-hour clock. For example, choose hour 13 for 1:00 p.m.
The reporting period uses a 24-hour rather than a 12-hour clock. For example, choose hour 13 for 1:00 p.m.
Step 5 ![]() In the Schedule group box, select the Enable Schedule check box.
In the Schedule group box, select the Enable Schedule check box.
Step 6 ![]() Choose the report format (CSV or PDF) from the Export Report drop-down list.
Choose the report format (CSV or PDF) from the Export Report drop-down list.
Step 7 ![]() Select either File or Email as the destination of the report.
Select either File or Email as the destination of the report.
•![]() If you select the File option, a destination path must first be defined in the Administration > Settings > Report page. Enter the destination path for the files in the Repository Path text box.
If you select the File option, a destination path must first be defined in the Administration > Settings > Report page. Enter the destination path for the files in the Repository Path text box.
•![]() If you select the Email option, an SMTP mail server must be defined prior to entry of target e-mail address. Choose Administrator > Settings > Mail Server Configuration to enter the appropriate information.
If you select the Email option, an SMTP mail server must be defined prior to entry of target e-mail address. Choose Administrator > Settings > Mail Server Configuration to enter the appropriate information.
Step 8 ![]() Enter a start date (MM:DD:YYYY), or click the calendar icon to select a date.
Enter a start date (MM:DD:YYYY), or click the calendar icon to select a date.
Step 9 ![]() Specify a start time using the hour and minute drop-down list boxes.
Specify a start time using the hour and minute drop-down list boxes.
Step 10 ![]() Select the Recurrence radio button to determine how often you want to run the report. The possible values are:
Select the Recurrence radio button to determine how often you want to run the report. The possible values are:
•![]() No Recurrence
No Recurrence
•![]() Hourly
Hourly
•![]() Daily
Daily
•![]() Weekly
Weekly
•![]() Monthly
Monthly
Note ![]() The days of the week appear on the page only when the weekly option is chosen.
The days of the week appear on the page only when the weekly option is chosen.
Step 11 ![]() When finished with Step 1 to Step 10, do one of the following:
When finished with Step 1 to Step 10, do one of the following:
•![]() Click Save to save edits. The report is run at the designated time and the results are either e-mailed or saved to a designated file as defined in the Schedule group box.
Click Save to save edits. The report is run at the designated time and the results are either e-mailed or saved to a designated file as defined in the Schedule group box.
•![]() Click Save and Run to save the changes and run the report now. The report runs regardless of any pending, scheduled run of that report. Results appear at the bottom of the page. The report also runs at the designated time and the results are either e-mailed or saved to a designated file as defined in the Schedule group box.
Click Save and Run to save the changes and run the report now. The report runs regardless of any pending, scheduled run of that report. Results appear at the bottom of the page. The report also runs at the designated time and the results are either e-mailed or saved to a designated file as defined in the Schedule group box.
–![]() In the results page, click Cancel to cancel the defined report.
In the results page, click Cancel to cancel the defined report.
•![]() Click Run Now if you want to run the report immediately and review the results in the Prime Infrastructure page. The report runs regardless of any pending, scheduled run of that report. Results appear at the bottom of the page. Click Save if you want to save the report criteria you entered.
Click Run Now if you want to run the report immediately and review the results in the Prime Infrastructure page. The report runs regardless of any pending, scheduled run of that report. Results appear at the bottom of the page. Click Save if you want to save the report criteria you entered.
Note ![]() You can also click Run Now to check the defined report criteria before saving it or to run reports as necessary.
You can also click Run Now to check the defined report criteria before saving it or to run reports as necessary.
The results appear at the bottom of the page (see Figure 11-5).
Note ![]() Only the CPU and memory utilization reports are shown in the following example (see Figure 11-5).
Only the CPU and memory utilization reports are shown in the following example (see Figure 11-5).
Figure 11-5 Devise > MSE Utilization > Results
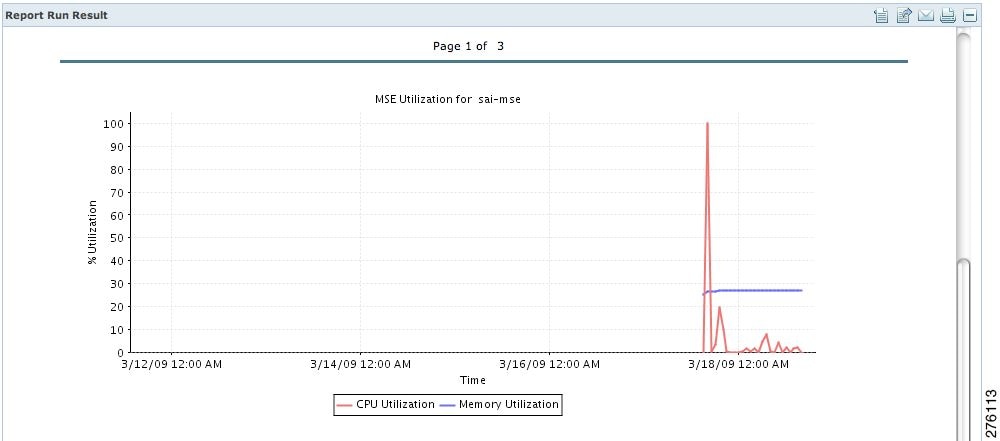
Step 12 ![]() If you selected the Save or Save and Run option, choose either Reports > Saved Reports (or Reports > Scheduled Runs if the report has not yet run and is scheduled to run). The Utilization Reports Summary page appears.
If you selected the Save or Save and Run option, choose either Reports > Saved Reports (or Reports > Scheduled Runs if the report has not yet run and is scheduled to run). The Utilization Reports Summary page appears.
If the report is scheduled, it is shown as enabled and the next scheduled run date is noted.
If the report has run and is not scheduled to run again, it is shown as expired.
If the report has run and is scheduled to run again, it is shown as disabled.
Step 13 ![]() To enable, disable, or delete a report, select the check box next to the report title and click the appropriate option.
To enable, disable, or delete a report, select the check box next to the report title and click the appropriate option.
Viewing Saved Utilization Reports
To download a saved report, follow these steps:
Step 1 ![]() Choose Reports > Saved Reports.
Choose Reports > Saved Reports.
Step 2 ![]() Click the Download icon for your report. It is downloaded and saved in the defined directory or e-mailed.
Click the Download icon for your report. It is downloaded and saved in the defined directory or e-mailed.
Viewing Scheduled Utilization Runs
To review status for a scheduled report, follow these steps:
Step 1 ![]() Choose Reports > Scheduled Runs.
Choose Reports > Scheduled Runs.
Step 2 ![]() Click the History icon to see the date of the last report run.
Click the History icon to see the date of the last report run.
Step 3 ![]() Click the Download icon for your report. It is downloaded and saved in the defined directory or e-mailed.
Click the Download icon for your report. It is downloaded and saved in the defined directory or e-mailed.
Managing OUI
The Prime Infrastructure relies on the IEEE Organizational Unique Identifier (OUI) database to identify the client vendor name mapping. Prime Infrastructure stores vendor OUI mappings in an XML file named vendorMacs.xml. This file is updated for each release of Prime Infrastructure. With the OUI update, you can perform the following:
•![]() Change the vendor display name for an existing OUI.
Change the vendor display name for an existing OUI.
•![]() Add new OUIs to Prime Infrastructure.
Add new OUIs to Prime Infrastructure.
•![]() Refresh the vendorMacs.xml file with new vendor OUI mappings and upload it to Prime Infrastructure.
Refresh the vendorMacs.xml file with new vendor OUI mappings and upload it to Prime Infrastructure.
This section contains the following topics:
Adding a New Vendor OUI Mapping
The User Defined OUI List page displays a list of vendor OUI mappings that you created. This page allows you to add a new vendor OUI mapping, delete an OUI entry, and update the vendor name for an OUI that is existing in the vendorMacs.xml file.
When you add an OUI, Prime Infrastructure vrifies the vendorMacs.xml file to see if the OUI exists. If the OUI exists, Prime Infrastructure updates the vendor name for the OUI. If the OUI does not exists, Prime Infrastructure adds a new OUI entry to the vendor OUI mapping.
To add a new vendor OUI mapping, follow these steps:
Step 1 ![]() Choose Administration > System Settings.
Choose Administration > System Settings.
Step 2 ![]() From the left sidebar menu, choose User Defined OUI. The User Defined OUI page appears.
From the left sidebar menu, choose User Defined OUI. The User Defined OUI page appears.
Step 3 ![]() From the Select a Command drop-down list, choose Add OUI Entries, and Click Go.
From the Select a Command drop-down list, choose Add OUI Entries, and Click Go.
Step 4 ![]() In the OUI field, enter a valid OUI. The format is aa:bb:cc.
In the OUI field, enter a valid OUI. The format is aa:bb:cc.
Step 5 ![]() Click Check to verify if the OUI exists in the vendor OUI mapping.
Click Check to verify if the OUI exists in the vendor OUI mapping.
Step 6 ![]() In the Name field, enter the display name of the vendor for the OUI.
In the Name field, enter the display name of the vendor for the OUI.
Step 7 ![]() Select the Change Vendor Name check box to update the display name of the vendor, if the OUI exists in the vendor OUI mapping.
Select the Change Vendor Name check box to update the display name of the vendor, if the OUI exists in the vendor OUI mapping.
Step 8 ![]() Click OK.
Click OK.
Uploading an Updated Vendor OUI Mapping File
The updated vendorMacs.xml file is posted on cisco.com, periodically. You can download and save the file to a local directory using the same filename, vendorMacs.xml. You can then, upload the file to Prime Infrastructure. Prime Infrastructure replaces the existing vendorMacs.xml file with the updated file and refreshes the vendor OUI mapping. However, it does not override the new vendor OUI mapping or the vendor name update that you made.
To upload the updated vendor OUI mapping file, follow these steps:
Step 1 ![]() Choose Administration > System Settings.
Choose Administration > System Settings.
Step 2 ![]() From the left sidebar menu, choose Upload OUI. The Upload OUI From File page appears.
From the left sidebar menu, choose Upload OUI. The Upload OUI From File page appears.
Step 3 ![]() Browse and select the vendorMacs.xml file that you downloaded from Cisco.com.
Browse and select the vendorMacs.xml file that you downloaded from Cisco.com.
Step 4 ![]() Click OK.
Click OK.
Monitoring Wireless Clients
This section describes about monitoring wireless clients and contains the following topics:
•![]() Monitoring Wireless Clients Using Maps
Monitoring Wireless Clients Using Maps
•![]() Monitoring Wireless Clients Using Search
Monitoring Wireless Clients Using Search
Monitoring Wireless Clients Using Maps
On the Prime Infrastructure map, you can view the name of the access point that the client is associated with, the IP Address, Asset information, Authentication, SSID, 802.11 protocol, and when the location information was last updated for the client. Hover your mouse cursor over the client icon on the map to display this information.
You can also view the client details page, that provides statistics (such as client association, client RSSI, and client SNR), packets transmitted and received values, events, and security information for that client.
To determine the location status of a client on a map and view its client details page using maps, follow these steps:
Step 1 ![]() Choose Monitor > Site Maps.
Choose Monitor > Site Maps.
Step 2 ![]() Choose the building and floor on which the mobility services engine and its clients are located.
Choose the building and floor on which the mobility services engine and its clients are located.
Step 3 ![]() Select the Clients check box in the Floor Settings left sidebar menu, if it is not already selected (see Figure 11-6).
Select the Clients check box in the Floor Settings left sidebar menu, if it is not already selected (see Figure 11-6).
Do not click Save Settings unless you want to save changes made to the floor settings across all maps.
Figure 11-6 Monitor > Maps > Building > Floor Page
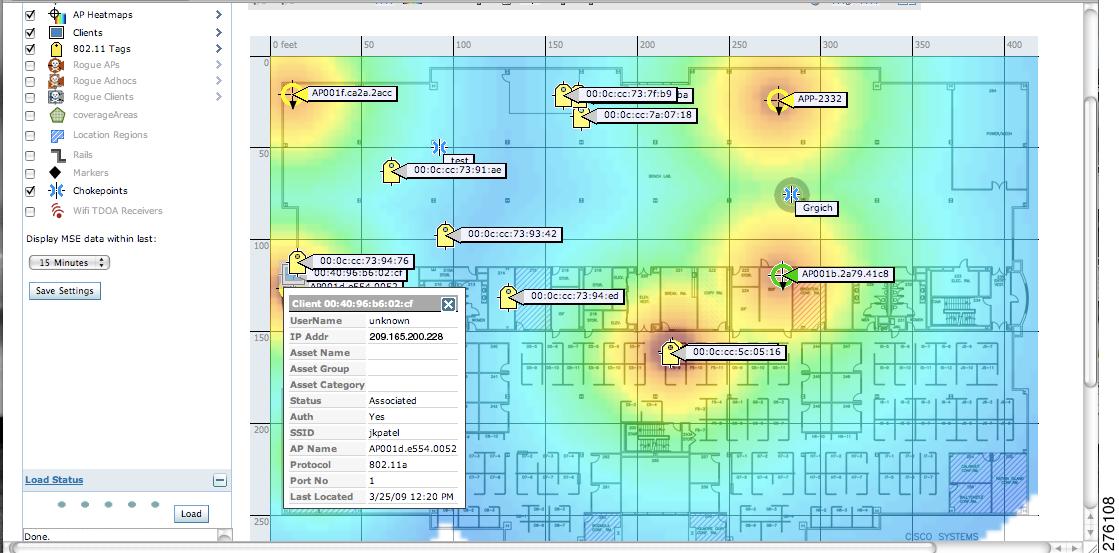
Note ![]() The map shows only associated clients by default. To see clients in all state, choose the show all clients option.
The map shows only associated clients by default. To see clients in all state, choose the show all clients option.
Note ![]() The map shows clients that was visible in the last 15 minutes. This value can be changed using the drop-down list in the left sidebar menu of the Maps page.
The map shows clients that was visible in the last 15 minutes. This value can be changed using the drop-down list in the left sidebar menu of the Maps page.
Step 4 ![]() Hover your mouse cursor over a client icon (blue square) and a summary of its configuration appears in a pop-up dialog box.
Hover your mouse cursor over a client icon (blue square) and a summary of its configuration appears in a pop-up dialog box.
Note ![]() You can enter a custom note for a client in the summary dialog box. You can also edit it in the Client Details page.
You can enter a custom note for a client in the summary dialog box. You can also edit it in the Client Details page.
Step 5 ![]() Click the Client icon to see client details.
Click the Client icon to see client details.
Step 6 ![]() Click the More link to configure asset information for the client.
Click the More link to configure asset information for the client.
Monitoring Wireless Clients Using Search
You can view client information in summary and in detail in the Monitor > Clients page and in the maps page (Monitor > Maps).
To view client information, follow these steps:
Step 1 ![]() Choose Monitor > Clients and Users.
Choose Monitor > Clients and Users.
The Clients and Users appears.
Step 2 ![]() From the Show drop-down list, choose Clients Detected by MSEs. Click Go.
From the Show drop-down list, choose Clients Detected by MSEs. Click Go.
A summary of all clients detected by mobility services engines and location appliances managed by Prime Infrastructure is displayed (see Figure 11-6). The clients detected by MSE is a union of wired and wireless clients.
Location information is stored only for wireless clients in MSE but not for wired clients. Hence, in order to filter clients by virtual domain, switch ports must be assigned to floors in the given virtual domain in order to view the wired clients, otherwise only wireless clients are listed here.
Note ![]() The clients will only show one IP address when you hover your mouse over the client to see the information, even though there might be multiple IP addresses associated with this client. The details page will show all the IP addresses. Also the clients displayed can be filtered using any of the multiple IP addresses that a client can have (full or partial). the IP address displayed is the best matched string searched.
The clients will only show one IP address when you hover your mouse over the client to see the information, even though there might be multiple IP addresses associated with this client. The details page will show all the IP addresses. Also the clients displayed can be filtered using any of the multiple IP addresses that a client can have (full or partial). the IP address displayed is the best matched string searched.
a. ![]() To find a specific client by its IP address, name, SSID, or MAC address, enter that value into the Search text box in the navigation bar (not all search values apply to all clients).
To find a specific client by its IP address, name, SSID, or MAC address, enter that value into the Search text box in the navigation bar (not all search values apply to all clients).
For example, if you enter a MAC address in the Search text box, the following page appears.
b. ![]() To see more configuration details about the client, click View List for the client item type. Details shown include associated devices (access point, controller), map location, VLAN, protocol, and authentication type.
To see more configuration details about the client, click View List for the client item type. Details shown include associated devices (access point, controller), map location, VLAN, protocol, and authentication type.
c. ![]() To see alarms for the client, click View List for the alarm item type. A listing of all active alarms for that client noting severity, failure source (alarm description), owner of alarm (if assigned), date and time of the alarm, and whether or not alarm is acknowledged.
To see alarms for the client, click View List for the alarm item type. A listing of all active alarms for that client noting severity, failure source (alarm description), owner of alarm (if assigned), date and time of the alarm, and whether or not alarm is acknowledged.
Note ![]() You can also assign or unassign the alarm, e-mail it, delete or clear it, and acknowledge and unacknowledge it in this page by choosing the appropriate option from the Select a command drop-down list.
You can also assign or unassign the alarm, e-mail it, delete or clear it, and acknowledge and unacknowledge it in this page by choosing the appropriate option from the Select a command drop-down list.
d. ![]() To search for a client or multiple clients by device, network, map location and type of client (regular, rogue, or shunned), click the Advanced Search link.
To search for a client or multiple clients by device, network, map location and type of client (regular, rogue, or shunned), click the Advanced Search link.
You can further define the client category by all clients, all excluded clients, all wired guest clients, and all logged in clients using the Search By drop-down list.
Click the appropriate client.
Client Support on the MSE
You can use the Prime Infrastructure Advanced Search feature to narrow the client list based on specific categories and filters.
This section contains the following topics:
•![]() Searching a Wireless Client from the Prime Infrastructure on the MSE by IPv6 Address
Searching a Wireless Client from the Prime Infrastructure on the MSE by IPv6 Address
•![]() Viewing the Clients Detected by the MSE
Viewing the Clients Detected by the MSE
Searching a Wireless Client from the Prime Infrastructure on the MSE by IPv6 Address
Note ![]() Only wireless clients have IPv6 addresses in this release.
Only wireless clients have IPv6 addresses in this release.
To search for an MSE-located client using the Prime Infrastructure Advanced Search feature, follow these steps:
Step 1 ![]() Click Advanced Search located in the top right corner of the Prime Infrastructure UI.
Click Advanced Search located in the top right corner of the Prime Infrastructure UI.
Step 2 ![]() Choose Clients as the search category from the Search Category drop-down list.
Choose Clients as the search category from the Search Category drop-down list.
Step 3 ![]() From the Media Type drop-down list, choose Wireless Clients.
From the Media Type drop-down list, choose Wireless Clients.
Note ![]() The Wireless Type drop-down list appears only when you choose Wireless Clients as the media type.
The Wireless Type drop-down list appears only when you choose Wireless Clients as the media type.
Step 4 ![]() From the Wireless Type drop-down list, choose any of the following types: All, Lightweight, or Autonomous Clients.
From the Wireless Type drop-down list, choose any of the following types: All, Lightweight, or Autonomous Clients.
Step 5 ![]() From the Search By drop-down list, choose IP Address.
From the Search By drop-down list, choose IP Address.
Note ![]() Searching a client by IP address can contain either a full or partial IP address. Each client can have up to 16 IPv6 addresses and 4 IPv4 addresses.
Searching a client by IP address can contain either a full or partial IP address. Each client can have up to 16 IPv6 addresses and 4 IPv4 addresses.
Step 6 ![]() From the Clients Detected By drop-down list, choose clients detected by MSE.
From the Clients Detected By drop-down list, choose clients detected by MSE.
The list shows clients located by Context-Aware Service in the MSE by directly communicating with the controllers. This list of clients should be the same as that are displayed in the Monitor > Clients and Users page. If the floors are not assigned to a virtual domain, the client list is empty. If a floor is assigned to a virtual domain but not synchronized with the MSE, then the clients from that floor are not displayed.
Step 7 ![]() From the Last detected within drop-down list, choose the time within which the client was detected.
From the Last detected within drop-down list, choose the time within which the client was detected.
Step 8 ![]() Enter the client IP address in the Client IP Address text box. You can enter wither a partial or full IPv6 address.
Enter the client IP address in the Client IP Address text box. You can enter wither a partial or full IPv6 address.
Note ![]() If you are searching for the client from the Prime Infrastructure on the MSE by IPV4 address, enter the IPV4 address in the Client IP address text box.
If you are searching for the client from the Prime Infrastructure on the MSE by IPV4 address, enter the IPV4 address in the Client IP address text box.
Step 9 ![]() From the Client States drop-down list, choose the client states. The possible values for wireless clients are All States, Idle, Authenticated, Associated, Probing, or Excused. The possible values for wired clients are All States, Authenticated, and Associated.
From the Client States drop-down list, choose the client states. The possible values for wireless clients are All States, Idle, Authenticated, Associated, Probing, or Excused. The possible values for wired clients are All States, Authenticated, and Associated.
Step 10 ![]() From the Posture Status drop-down list, choose the posture status to know if the devices are clean or not. The possible values are All, unknown, Passed, and Failed.
From the Posture Status drop-down list, choose the posture status to know if the devices are clean or not. The possible values are All, unknown, Passed, and Failed.
Step 11 ![]() Select the CCX Compatible check box to search for clients that are compatible with Cisco Client Extensions. The possible values are All Versions, V1, V2, V3, V4, V5, and V6.
Select the CCX Compatible check box to search for clients that are compatible with Cisco Client Extensions. The possible values are All Versions, V1, V2, V3, V4, V5, and V6.
Step 12 ![]() Select the E2E Compatible check box to search for clients that are End to End compatible. The possible values are All Versions, V1, and V2.
Select the E2E Compatible check box to search for clients that are End to End compatible. The possible values are All Versions, V1, and V2.
Step 13 ![]() Select the NAC State check box to search for clients identified by a certain Network Admission Control (NAC) state. The possible values are Quarantine, Access, Invalid, and Not Applicable.
Select the NAC State check box to search for clients identified by a certain Network Admission Control (NAC) state. The possible values are Quarantine, Access, Invalid, and Not Applicable.
Step 14 ![]() Select the Include Disassociated check box to include clients that are no longer on the network but for which the Prime Infrastructure has historical records.
Select the Include Disassociated check box to include clients that are no longer on the network but for which the Prime Infrastructure has historical records.
Step 15 ![]() From the Items per page drop-down list, choose the number of records to be displayed in the search results page.
From the Items per page drop-down list, choose the number of records to be displayed in the search results page.
Step 16 ![]() Select the Save Search check box to save the selected search option.
Select the Save Search check box to save the selected search option.
Step 17 ![]() Click Go.
Click Go.
The Clients and Users page appears with all the clients detected by the MSE.
Viewing the Clients Detected by the MSE
To view all the clients detected by the MSE, follow these steps:
Step 1 ![]() Choose Monitor > Clients and Users to view both wired and wireless clients information.
Choose Monitor > Clients and Users to view both wired and wireless clients information.
The Client and Users page appears.
The Clients and Users table shows a few column by default. If you want to display the additional columns that are available, click  , and then click Columns. The available columns appear. Select the columns that you want to show in the Clients and Users table. When you click anywhere in a row, the row is selected and the client details are shown.
Step 2 ![]() Filter the current list to choose all the clients that are detected by the MSE by choosing Clients detected by MSE from the Show drop-down list.
Filter the current list to choose all the clients that are detected by the MSE by choosing Clients detected by MSE from the Show drop-down list.
All the clients detected by the MSE including wired and wireless appear.
The following different parameters are available in the Clients Detected by MSE table:
•![]() MAC Address—Client MAC address.
MAC Address—Client MAC address.
•![]() IP Address—Client IP address.
IP Address—Client IP address.
The IP address that appears in the IP Address column is determined by a predefined priority order. The first IP address available in the following order appears in the IP address text box:
–![]() IPv4 address
IPv4 address
Note ![]() Only wireless clients have IPv6 addresses in this release. Each client can have up to 16 IPv6 addresses and 4 IPv4 addresses.
Only wireless clients have IPv6 addresses in this release. Each client can have up to 16 IPv6 addresses and 4 IPv4 addresses.
–![]() IPv6 global unique address. If there are multiple addresses of this type, the most recent IPv6 address that the client received is shown, because a user might have two Global IPv6 addresses but one might have been from an older Router Advertisement that is being aged out.
IPv6 global unique address. If there are multiple addresses of this type, the most recent IPv6 address that the client received is shown, because a user might have two Global IPv6 addresses but one might have been from an older Router Advertisement that is being aged out.
–![]() IPv6 local unique address. If there are multiple addresses, then the most recent IPV6 local unique address is used by the client.
IPv6 local unique address. If there are multiple addresses, then the most recent IPV6 local unique address is used by the client.
–![]() IPv6 link local address. For an IPv6 address of the client, which is self-assigned and used for communication before any other IPV6 address is assigned.
IPv6 link local address. For an IPv6 address of the client, which is self-assigned and used for communication before any other IPV6 address is assigned.
The following are the different IPv6 address types:
–![]() Link-local Unicast—The link-local addresses are designed to be used for addressing on a single link for purposes such as auto-address configuration, neighbor discovery, or when no routers are present.
Link-local Unicast—The link-local addresses are designed to be used for addressing on a single link for purposes such as auto-address configuration, neighbor discovery, or when no routers are present.
–![]() Site-local Unicast—The site-local addresses are designed to be used for addressing inside of a site without the need for a global prefix.
Site-local Unicast—The site-local addresses are designed to be used for addressing inside of a site without the need for a global prefix.
–![]() Aggregatable Global Unicast—The aggregatable global unicast address uniquely identifies the client in global network and equivalent to public IPv4 address. A client can have multiple aggregatable global unicast addresses.
Aggregatable Global Unicast—The aggregatable global unicast address uniquely identifies the client in global network and equivalent to public IPv4 address. A client can have multiple aggregatable global unicast addresses.
•![]() IP Type—The IP address type of the client. The possible options are IPv4, IPv6, or Dual-stack that signifies a client with both a IPV4 and IPV6 addresses.
IP Type—The IP address type of the client. The possible options are IPv4, IPv6, or Dual-stack that signifies a client with both a IPV4 and IPV6 addresses.
–![]() Global Unique
Global Unique
–![]() Unique Local
Unique Local
–![]() Link Local
Link Local
•![]() User Name—Username based on 802.1x authentication. Unknown is displayed for client connected without a username.
User Name—Username based on 802.1x authentication. Unknown is displayed for client connected without a username.
•![]() Type—Indicates the client type.
Type—Indicates the client type.
–![]()
![]() Indicates a lightweight client
Indicates a lightweight client
–![]()
![]() Indicates a wired client
Indicates a wired client
–![]()
 Indicates an autonomous client
•![]() Vendor—Device vendor derived from OUI.
Vendor—Device vendor derived from OUI.
•![]() Device Name—Network authentication device name. For example, WLC and switch.
Device Name—Network authentication device name. For example, WLC and switch.
•![]() Location—Map location of the connected device.
Location—Map location of the connected device.
•![]() VLAN—Indicates the access VLAN ID for this client.
VLAN—Indicates the access VLAN ID for this client.
•![]() Status—Current client status.
Status—Current client status.
–![]() Idle—Normal operation; no rejection of client association requests.
Idle—Normal operation; no rejection of client association requests.
–![]() Auth Pending—Completing a AAA transaction.
Auth Pending—Completing a AAA transaction.
–![]() Authenticated—802.11 authenticated complete.
Authenticated—802.11 authenticated complete.
–![]() Associated—802.11 association complete. This is also used by wired clients to represent that a client is currently connected to the network.
Associated—802.11 association complete. This is also used by wired clients to represent that a client is currently connected to the network.
–![]() Disassociated—802.11 disassociation complete. This is also used by wired clients to represent that a client is currently not on the network.
Disassociated—802.11 disassociation complete. This is also used by wired clients to represent that a client is currently not on the network.
–![]() To Be Deleted—The client is deleted after disassociation.
To Be Deleted—The client is deleted after disassociation.
–![]() Excluded—Automatically disabled by the system due to perceived security threat.
Excluded—Automatically disabled by the system due to perceived security threat.
•![]() Interface—Controller interface (wireless) or switch interface (wired) that the client is connected to.
Interface—Controller interface (wireless) or switch interface (wired) that the client is connected to.
•![]() Protocol
Protocol
–![]() 802.11—Wireless
802.11—Wireless
–![]() 802.3—Wired
802.3—Wired
•![]() Association Time—Last association start time (for wireless client). For a wired client, this is the time when a client is connected to a switch port. This is blank for a client which is associated but has problems being on the network.
Association Time—Last association start time (for wireless client). For a wired client, this is the time when a client is connected to a switch port. This is blank for a client which is associated but has problems being on the network.
•![]() CCX—Lightweight wireless only.
CCX—Lightweight wireless only.
Step 3 ![]() Select the radio button next to MAC Address in the Client and User page to view the associated client information. The following are the different client parameters that appear:
Select the radio button next to MAC Address in the Client and User page to view the associated client information. The following are the different client parameters that appear:
•![]() Client attributes
Client attributes
•![]() Client IPV6 Addresses
Client IPV6 Addresses
•![]() Client Statistics
Client Statistics
Note ![]() Client Statistics shows the statistics information after the client details are shown.
Client Statistics shows the statistics information after the client details are shown.
•![]() Client Association History
Client Association History
•![]() Client Event Information
Client Event Information
•![]() Client Location Information
Client Location Information
•![]() Wired Location History
Wired Location History
•![]() Client CCX Information
Client CCX Information
When you select a client from the Clients and Users list, the following client details are displayed. Clients are identified using the MAC address.
•![]() General—Lists the following information:
General—Lists the following information:
–![]() User Name
User Name
–![]() IP Address
IP Address
–![]() MAC address
MAC address
–![]() Vendor
Vendor
–![]() Endpoint Type
Endpoint Type
–![]() Client Type
Client Type
–![]() Media Type
Media Type
–![]() Mobility Role
Mobility Role
–![]() Hostname
Hostname
–![]() E2E
E2E
–![]() Power Save
Power Save
–![]() CCX
CCX
–![]() Foundation Service
Foundation Service
–![]() Management Service
Management Service
–![]() Voice Service
Voice Service
–![]() Location Service
Location Service
Note ![]() Click the
Click the 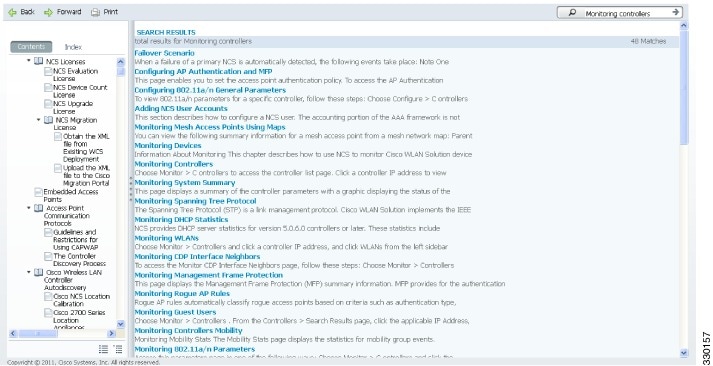 icon next to the username to access the correlated users of a user.
•![]() Session—Lists the following client session information:
Session—Lists the following client session information:
–![]() Controller Name
Controller Name
–![]() AP Name
AP Name
–![]() AP IP Address
AP IP Address
–![]() AP Type
AP Type
–![]() AP Base Radio MAC
AP Base Radio MAC
–![]() Anchor Address
Anchor Address
–![]() 802.11 State
802.11 State
–![]() Association ID
Association ID
–![]() Port
Port
–![]() Interface
Interface
–![]() SSID
SSID
–![]() Profile Name
Profile Name
–![]() Protocol
Protocol
–![]() VLAN ID
VLAN ID
–![]() AP Mode
AP Mode
•![]() Security (wireless and Identity wired clients only)—Lists the following security information:
Security (wireless and Identity wired clients only)—Lists the following security information:
–![]() Security Policy Type
Security Policy Type
–![]() EAP Type
EAP Type
–![]() On Network
On Network
–![]() 802.11 Authentication
802.11 Authentication
–![]() Encryption Cipher
Encryption Cipher
–![]() SNMP NAC State
SNMP NAC State
–![]() RADIUS NAC State
RADIUS NAC State
–![]() AAA Override ACL Name
AAA Override ACL Name
–![]() AAA Override ACL Applied Status
AAA Override ACL Applied Status
–![]() Redirect URL
Redirect URL
–![]() ACL Name
ACL Name
–![]() ACL Applied Status
ACL Applied Status
–![]() FlexConnect Local Authentication
FlexConnect Local Authentication
–![]() Policy Manager State
Policy Manager State
–![]() Authentication ISE
Authentication ISE
–![]() Authorization Profile Name
Authorization Profile Name
–![]() Posture Status
Posture Status
–![]() TrustSec Security Group
TrustSec Security Group
–![]() Windows AD Domain
Windows AD Domain
Note ![]() The identity clients are clients whose authentication type is 802.1x, MAC Auth Bypass or Web Auth. For non-identity clients, the authentication type is N/A.
The identity clients are clients whose authentication type is 802.1x, MAC Auth Bypass or Web Auth. For non-identity clients, the authentication type is N/A.
Note ![]() The data that appears under the client attributes differs based on identity and non-identity clients. For identity clients, you can see the security information such as Authentication status, Audit Session ID, and so on.
The data that appears under the client attributes differs based on identity and non-identity clients. For identity clients, you can see the security information such as Authentication status, Audit Session ID, and so on.
•![]() Statistics (wireless only)
Statistics (wireless only)
•![]() Traffic—Shows the client traffic information.
Traffic—Shows the client traffic information.
•![]() For wireless clients, client traffic information comes from the controller. For wired clients, the client traffic information comes from the ISE, and you must enable accounting information and other necessary functions on the switches.
For wireless clients, client traffic information comes from the controller. For wired clients, the client traffic information comes from the ISE, and you must enable accounting information and other necessary functions on the switches.
The Statistics group box contains the following information for the selected client:
•![]() Client AP Association History.
Client AP Association History.
•![]() Client RSSI History (dBm)—History of RSSI (Received Signal Strength Indicator) as detected by the access point with which the client is associated.
Client RSSI History (dBm)—History of RSSI (Received Signal Strength Indicator) as detected by the access point with which the client is associated.
•![]() Client SNR History—History of SNR (signal-to-noise ratio of the client RF session) as detected by the access point with which the client is associated.
Client SNR History—History of SNR (signal-to-noise ratio of the client RF session) as detected by the access point with which the client is associated.
•![]() Bytes Sent and Received (Kbps)—Bytes sent and received with the associated access point.
Bytes Sent and Received (Kbps)—Bytes sent and received with the associated access point.
•![]() Packets Sent and Received (per sec)—Packets sent and received with the associated access point.
Packets Sent and Received (per sec)—Packets sent and received with the associated access point.
•![]() Client Data rate
Client Data rate
This information is presented in interactive graphs.
The Client IPv6 Address group box contains the following information for the selected client:
•![]() IP Address—Shows the client IPv6 address.
IP Address—Shows the client IPv6 address.
•![]() Scope—Contains 3 scope types: Global Unique, Local Unique, and Link Local.
Scope—Contains 3 scope types: Global Unique, Local Unique, and Link Local.
•![]() Address Type—Shows the address type.
Address Type—Shows the address type.
•![]() Discovery Time—Time when the IP was discovered.
Discovery Time—Time when the IP was discovered.
The association history dashlet shows information regarding the last ten association times for the selected client. This information helps in troubleshooting the client.
The Association History dashlet contains the following information:
•![]() Association Time
Association Time
•![]() Duration
Duration
•![]() User Name
User Name
•![]() IP Address
IP Address
•![]() IP Address Type
IP Address Type
•![]() AP Name
AP Name
•![]() Controller Name
Controller Name
•![]() SSID
SSID
The Events group box in the Client Details page displays all events for this client including the event type as well as the date and time of the event:
•![]() Event Type
Event Type
•![]() Event Time
Event Time
•![]() Description
Description
Click View Location History to view the location history details of wired and wireless clients.
The following location history information is displayed for a wired or wireless client:
•![]() Timestamp
Timestamp
•![]() State
State
•![]() Port Type
Port Type
•![]() Slot
Slot
•![]() Module
Module
•![]() Port
Port
•![]() User Name
User Name
•![]() IP Address
IP Address
•![]() Switch IP
Switch IP
•![]() Server Name
Server Name
•![]() Map Location Civic Location
Map Location Civic Location
Configuring Buildings
You can add buildings to the Prime Infrastructure database regardless of whether you have added campus maps to the database. This section describes how to add a building to a campus map or a standalone building (one that is not part of a campus) to the Prime Infrastructure database.
This section contains the following topics:
•![]() Adding a Building to a Campus Map
Adding a Building to a Campus Map
Adding a Building to a Campus Map
To add a building to a campus map in the Prime Infrastructure database, follow these steps:
Step 1 ![]() Choose Monitor > Site Maps to display the Maps page.
Choose Monitor > Site Maps to display the Maps page.
Step 2 ![]() Click the desired campus. The Site Maps > Campus Name page appears.
Click the desired campus. The Site Maps > Campus Name page appears.
Step 3 ![]() From the Select a command drop-down list, choose New Building and click Go.
From the Select a command drop-down list, choose New Building and click Go.
Step 4 ![]() In the Campus Name > New Building page, follow these steps to create a virtual building in which to organize related floor plan maps:
In the Campus Name > New Building page, follow these steps to create a virtual building in which to organize related floor plan maps:
a. ![]() Enter the building name.
Enter the building name.
b. ![]() Enter the building contact name.
Enter the building contact name.
c. ![]() Enter the number of floors and basements.
Enter the number of floors and basements.
d. ![]() Enter the horizontal position (distance from the corner of the building rectangle to the left edge of the campus map) and the vertical position (distance from the corner of the building rectangle to the top edge of the campus map) in feet.
Enter the horizontal position (distance from the corner of the building rectangle to the left edge of the campus map) and the vertical position (distance from the corner of the building rectangle to the top edge of the campus map) in feet.
Note ![]() To change the unit of measurement (feet or meters), choose Monitor > Site Maps and choose Properties from the Select a command drop-down list.
To change the unit of measurement (feet or meters), choose Monitor > Site Maps and choose Properties from the Select a command drop-down list.
e. ![]() Enter an approximate building horizontal span and vertical span (width and depth on the map) in feet.
Enter an approximate building horizontal span and vertical span (width and depth on the map) in feet.
Note ![]() The horizontal and vertical span should be larger than or the same size as any floors that you might add later.
The horizontal and vertical span should be larger than or the same size as any floors that you might add later.
Tip ![]() You can also use Ctrl-click to resize the bounding area in the upper-left corner of the campus map. As you change the size of the bounding area, the Horizontal Span and Vertical Span parameters of the building change to match your actions.
You can also use Ctrl-click to resize the bounding area in the upper-left corner of the campus map. As you change the size of the bounding area, the Horizontal Span and Vertical Span parameters of the building change to match your actions.
f. ![]() Click Place to put the building on the campus map. The Prime Infrastructure creates a building rectangle scaled to the size of the campus map.
Click Place to put the building on the campus map. The Prime Infrastructure creates a building rectangle scaled to the size of the campus map.
g. ![]() Click the building rectangle and drag it to the desired position on the campus map.
Click the building rectangle and drag it to the desired position on the campus map.
Note ![]() After adding a new building, you can move it from one campus to another without having to recreate it.
After adding a new building, you can move it from one campus to another without having to recreate it.
h. ![]() Click Save to save this building and its campus location to the database. The Prime Infrastructure saves the building name in the building rectangle on the campus map.
Click Save to save this building and its campus location to the database. The Prime Infrastructure saves the building name in the building rectangle on the campus map.
Note ![]() A hyperlink associated with the building takes you to the corresponding Map page.
A hyperlink associated with the building takes you to the corresponding Map page.
Step 5 ![]() (Optional) To assign location presence information for the new outdoor area, do the following:
(Optional) To assign location presence information for the new outdoor area, do the following:
a. ![]() Choose Edit Location Presence Info from the Select a command drop-down list. Click Go. The Location Presence page appears.
Choose Edit Location Presence Info from the Select a command drop-down list. Click Go. The Location Presence page appears.
Note ![]() By default, the Presence Info check box of the Override Child Element is selected. This option should remain selected if you want to propagate the campus location to all buildings and floors on that campus. When adding buildings to the campus map, you can import the campus location information. The campus address cannot be imported to a building if the check box is unselected.
By default, the Presence Info check box of the Override Child Element is selected. This option should remain selected if you want to propagate the campus location to all buildings and floors on that campus. When adding buildings to the campus map, you can import the campus location information. The campus address cannot be imported to a building if the check box is unselected.
This option should be unselected if you want to assign building-specific addresses to buildings on its campus rather than one campus address to all.
b. ![]() Click the Civic Address, or Advanced tab.
Click the Civic Address, or Advanced tab.
–![]() Civic Address identifies the campus by name, street, house number, house number suffix, city (address line2), state, postal code, and country.
Civic Address identifies the campus by name, street, house number, house number suffix, city (address line2), state, postal code, and country.
–![]() Advanced identifies the campus with expanded civic information such as neighborhood, city division, country, and postal community name.
Advanced identifies the campus with expanded civic information such as neighborhood, city division, country, and postal community name.
c. ![]() By default, the Override Child's Presence Information check box is selected. There is no need to alter this setting for standalone buildings.
By default, the Override Child's Presence Information check box is selected. There is no need to alter this setting for standalone buildings.
Step 6 ![]() Click Save.
Click Save.
Adding a Standalone Building
To add a standalone building to the Prime Infrastructure database, follow these steps:
Step 1 ![]() Choose Monitor > Site Maps to display the Maps page.
Choose Monitor > Site Maps to display the Maps page.
Step 2 ![]() From the Select a command drop-down list, choose New Building, and click Go.
From the Select a command drop-down list, choose New Building, and click Go.
Step 3 ![]() In the Maps > New Building page, follow these steps to create a virtual building in which to organize related floor plan maps:
In the Maps > New Building page, follow these steps to create a virtual building in which to organize related floor plan maps:
a. ![]() Enter the building name.
Enter the building name.
b. ![]() Enter the building contact name.
Enter the building contact name.
Note ![]() After adding a new building, you can move it from one campus to another without having to recreate it.
After adding a new building, you can move it from one campus to another without having to recreate it.
c. ![]() Enter the number of floors and basements.
Enter the number of floors and basements.
d. ![]() Enter an approximate building horizontal span and vertical span (width and depth on the map) in feet.
Enter an approximate building horizontal span and vertical span (width and depth on the map) in feet.
Note ![]() To change the unit of measurement (feet or meters), choose Monitor > Site Maps, and choose Properties from the Select a command drop-down list.
To change the unit of measurement (feet or meters), choose Monitor > Site Maps, and choose Properties from the Select a command drop-down list.
Note ![]() The horizontal and vertical span should be larger than or the same size as any floors that you might add later.
The horizontal and vertical span should be larger than or the same size as any floors that you might add later.
e. ![]() Click OK to save this building to the database.
Click OK to save this building to the database.
Step 4 ![]() (Optional) To assign location presence information for the new building, do the following:
(Optional) To assign location presence information for the new building, do the following:
a. ![]() Choose Location Presence from the Select a command drop-down list. Click Go. The Location Presence page appears.
Choose Location Presence from the Select a command drop-down list. Click Go. The Location Presence page appears.
b. ![]() Click the Civic, GPS Markers, or Advanced tab.
Click the Civic, GPS Markers, or Advanced tab.
–![]() Civic Address identifies the campus by name, street, house number, house number suffix, city (address line2), state, postal code, and country.
Civic Address identifies the campus by name, street, house number, house number suffix, city (address line2), state, postal code, and country.
–![]() GPS Markers identify the campus by longitude and latitude.
GPS Markers identify the campus by longitude and latitude.
–![]() Advanced identifies the campus with expanded civic information such as neighborhood, city division, county, and postal community name.
Advanced identifies the campus with expanded civic information such as neighborhood, city division, county, and postal community name.
Note ![]() Each selected parameter is inclusive of all of those above it. For example, if you select Advanced, it can also provide GPS and Civic location information upon client demand. The selected setting must match what is set on the location server level (Services > Mobility Services).
Each selected parameter is inclusive of all of those above it. For example, if you select Advanced, it can also provide GPS and Civic location information upon client demand. The selected setting must match what is set on the location server level (Services > Mobility Services).
Note ![]() If a client requests location information such as GPS Markers for a campus, building, floor, or outdoor area that is not configured for that parameter, an error message is returned.
If a client requests location information such as GPS Markers for a campus, building, floor, or outdoor area that is not configured for that parameter, an error message is returned.
c. ![]() By default, the Presence Info check box of the Override Child Element is selected. This option should remain selected if you want to propagate the campus location to all buildings and floors on that campus. When adding buildings to the campus map, you can import the location information. The campus address cannot be imported to a building if the check box is unselected. This option should be deselected if you want to assign building-specific addresses to buildings on its campus rather than one campus address to all.
By default, the Presence Info check box of the Override Child Element is selected. This option should remain selected if you want to propagate the campus location to all buildings and floors on that campus. When adding buildings to the campus map, you can import the location information. The campus address cannot be imported to a building if the check box is unselected. This option should be deselected if you want to assign building-specific addresses to buildings on its campus rather than one campus address to all.
Step 5 ![]() Click Save.
Click Save.
Note ![]() The standalone buildings are automatically placed in System Campus.
The standalone buildings are automatically placed in System Campus.
Viewing a Building
To view a current building map, follow these steps:
Step 1 ![]() Choose Monitor > Site Maps.
Choose Monitor > Site Maps.
Step 2 ![]() Click the name of the building map to open its details page. The Building View page provides a list of floor maps and map details for each floor.
Click the name of the building map to open its details page. The Building View page provides a list of floor maps and map details for each floor.
Note ![]() From the Building View page, you can click the Floor column heading to sort the list ascending or descending by floor.
From the Building View page, you can click the Floor column heading to sort the list ascending or descending by floor.
The map details include the following:
•![]() Floor area
Floor area
•![]() Floor index—Indicates the floor level. A negative number indicates a basement floor level.
Floor index—Indicates the floor level. A negative number indicates a basement floor level.
•![]() Contact
Contact
•![]() Status—Indicates the most serious level of alarm on an access point located on this map or one of its children.
Status—Indicates the most serious level of alarm on an access point located on this map or one of its children.
•![]() Number of total access points located on the map.
Number of total access points located on the map.
•![]() Number of 802.11a/n and 802.11b/g/n radios located on the map.
Number of 802.11a/n and 802.11b/g/n radios located on the map.
•![]() Number of out of service (OOS) radios.
Number of out of service (OOS) radios.
•![]() Number of clients—Click the number link to view the Monitor > Clients page.
Number of clients—Click the number link to view the Monitor > Clients page.
Step 3 ![]() The Select a command drop-down list provides the following options:
The Select a command drop-down list provides the following options:
•![]() New Floor Area—See the "Adding a Building to a Campus Map" section for more information.
New Floor Area—See the "Adding a Building to a Campus Map" section for more information.
•![]() Edit Building—See the "Editing a Building" section for more information.
Edit Building—See the "Editing a Building" section for more information.
•![]() Delete Building—See the "Deleting a Building" section for more information.
Delete Building—See the "Deleting a Building" section for more information.
Editing a Building
To edit a current building map, follow these steps:
Step 1 ![]() Choose Monitor > Site Maps.
Choose Monitor > Site Maps.
Step 2 ![]() Click the name of the building map to open its details page.
Click the name of the building map to open its details page.
Step 3 ![]() From the Select a command drop-down list, choose Edit Building.
From the Select a command drop-down list, choose Edit Building.
Step 4 ![]() Make any necessary changes to Building Name, Contact, Number of Floors, Number of Basements, and Dimensions (feet).
Make any necessary changes to Building Name, Contact, Number of Floors, Number of Basements, and Dimensions (feet).
Note ![]() To change the unit of measurement (feet or meters), choose Monitor > Site Maps, and choose Properties from the Select a command drop-down list.
To change the unit of measurement (feet or meters), choose Monitor > Site Maps, and choose Properties from the Select a command drop-down list.
Step 5 ![]() Click OK.
Click OK.
Deleting a Building
To delete a current building map, follow these steps:
Step 1 ![]() Choose Monitor > Site Maps.
Choose Monitor > Site Maps.
Step 2 ![]() Select the check box for the building that you want to delete.
Select the check box for the building that you want to delete.
Step 3 ![]() Click Delete at the bottom of the map list (or choose Delete Maps from the Select a command drop-down list, and click Go).
Click Delete at the bottom of the map list (or choose Delete Maps from the Select a command drop-down list, and click Go).
Step 4 ![]() Click OK to confirm the deletion.
Click OK to confirm the deletion.
Note ![]() Deleting a building also deletes all of its container maps. The access points from all deleted maps are moved to an Unassigned state.
Deleting a building also deletes all of its container maps. The access points from all deleted maps are moved to an Unassigned state.
Moving a Building
To move a building to a different campus, follow these steps:
Step 1 ![]() Choose Monitor > Site Maps.
Choose Monitor > Site Maps.
Step 2 ![]() Select the check box of the applicable building.
Select the check box of the applicable building.
Step 3 ![]() From the Select a command drop-down list, choose Move Buildings.
From the Select a command drop-down list, choose Move Buildings.
Step 4 ![]() Click Go.
Click Go.
Step 5 ![]() Choose the Target Campus from the drop-down list.
Choose the Target Campus from the drop-down list.
Step 6 ![]() Select the buildings that you want to move. Unselect any buildings that remain in their current location.
Select the buildings that you want to move. Unselect any buildings that remain in their current location.
Step 7 ![]() Click OK.
Click OK.
Monitoring Tags
You can monitor tag status and location on the Prime Infrastructure maps as well as review tag details in the Monitor > Tags page. You can also use the Advanced Search to monitor tags.
This section contains the following topics:
Monitoring Tags Using Maps
On the Prime Infrastructure map, you can view the name of the access point that generated the signal for a tagged asset, its strength of signal, and when the location information was last updated for the asset. Hover your mouse cursor over the tag icon on the map to display this information.
To enable tag location status on a map, follow these steps:
Step 1 ![]() Choose Monitor > Site Maps.
Choose Monitor > Site Maps.
Step 2 ![]() Choose the building and floor on which the mobility services engine and tag are located.
Choose the building and floor on which the mobility services engine and tag are located.
Step 3 ![]() Select the 802.11 Tags check box in the Floor Settings menu if it is not already selected (see Figure 11-7).
Select the 802.11 Tags check box in the Floor Settings menu if it is not already selected (see Figure 11-7).
Note ![]() Do not click Save Settings unless you want to save changes made to the floor settings across all maps.
Do not click Save Settings unless you want to save changes made to the floor settings across all maps.
Figure 11-7 Monitor > Maps > Building > Floor > Tag Page
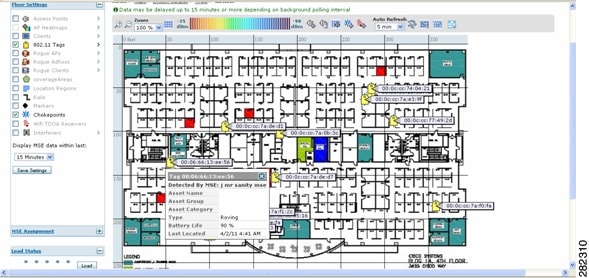
Step 4 ![]() Hover your mouse cursor over a tag icon (yellow tag) and a summary of its configuration appears in a Tag dialog box.
Hover your mouse cursor over a tag icon (yellow tag) and a summary of its configuration appears in a Tag dialog box.
Step 5 ![]() Click the tag icon to see tag details.
Click the tag icon to see tag details.
You can also configure the asset information by entering the required information in the Asset Info group box.
Step 6 ![]() To see location history for the tag, choose Location History from the Select a command drop-down list. Click Go.
To see location history for the tag, choose Location History from the Select a command drop-down list. Click Go.
Monitoring Tags Using Search
You can search for tags by asset type (name, category and group), MAC address, system (controller or MSE), and area (floor area and outdoor area).
You can further refine your search using the Advanced Search parameters and save the search criteria for future use. Click Saved Searches to retrieve saved searches.
When you click the MAC address of a tag location in a search results page, the following details appear for the tag:
•![]() Tag vendor
Tag vendor
•![]() Controller to which tag is associated
Controller to which tag is associated
•![]() Telemetry data (CCX v1-compliant tags only)
Telemetry data (CCX v1-compliant tags only)
–![]() Telemetry data displayed is vendor-specific; however, some commonly reported details are GPS location, battery extended information, pressure, temperature, humidity, motion, status, and emergency code.
Telemetry data displayed is vendor-specific; however, some commonly reported details are GPS location, battery extended information, pressure, temperature, humidity, motion, status, and emergency code.
•![]() Asset Information (Name, Category, Group)
Asset Information (Name, Category, Group)
•![]() Statistics (Bytes and packets received)
Statistics (Bytes and packets received)
•![]() Location (Floor, Last Located, MSE, map)
Location (Floor, Last Located, MSE, map)
•![]() Location Notification (Absence, Containment, Distance, All)
Location Notification (Absence, Containment, Distance, All)
•![]() Emergency Data (CCX v1-compliant tags only)
Emergency Data (CCX v1-compliant tags only)
To search for RFID tags, follow these steps:
Step 1 ![]() Choose Monitor > RFID Tags. The Tag Summary page appears.
Choose Monitor > RFID Tags. The Tag Summary page appears.
Note ![]() Tags detected by MSE (in the last 15 minutes) display the total tag count equal to the number of tags by floors in the given virtual domain.
Tags detected by MSE (in the last 15 minutes) display the total tag count equal to the number of tags by floors in the given virtual domain.
Step 2 ![]() To view a summary of tags associated with a specific mobility services engine, click the Total Tags link. The RFID Tags Summary page displays a list of tags by floors in the given domain.
To view a summary of tags associated with a specific mobility services engine, click the Total Tags link. The RFID Tags Summary page displays a list of tags by floors in the given domain.
Note ![]() If the listing of mobility services engines or tags is lengthy, you can use Search or Advanced Search to isolate a specific tag.
If the listing of mobility services engines or tags is lengthy, you can use Search or Advanced Search to isolate a specific tag.
Note ![]() If the floors are not assigned to a virtual domain, then the tag count will be zero. If a floor is assigned to a virtual domain but not synchronized with the MSE, then the tag count from that floor is not considered.
If the floors are not assigned to a virtual domain, then the tag count will be zero. If a floor is assigned to a virtual domain but not synchronized with the MSE, then the tag count from that floor is not considered.
Step 3 ![]() To search for a specific tag, if you know its MAC address and asset name (not all search values apply to all tags), click the Search link.
To search for a specific tag, if you know its MAC address and asset name (not all search values apply to all tags), click the Search link.
Step 4 ![]() To search for a specific tag or multiple tags using a broader range of search criteria such as device (MSE or controller), map location (floor or outdoor area), asset name or category, or tag vendor, click the Advanced Search link.
To search for a specific tag or multiple tags using a broader range of search criteria such as device (MSE or controller), map location (floor or outdoor area), asset name or category, or tag vendor, click the Advanced Search link.
a. ![]() In the Advanced Search pane, select Tags as the search category.
In the Advanced Search pane, select Tags as the search category.
b. ![]() Select the additional tag search criteria. See Table 11-3 for a list of search criteria and their possible values.
Select the additional tag search criteria. See Table 11-3 for a list of search criteria and their possible values.
This list of tags is the same as that are displayed in the Monitor > RFID Tags summary page. If the floors are not assigned to a virtual domain, the tags list shows empty. If the floor is assigned to a virtual domain and is not synchronized with the MSE, then the tags from that floor are not displayed.
c. ![]() Click Go when all advanced search parameters are selected.
Click Go when all advanced search parameters are selected.
Note ![]() If no tags are found based on the selected search criteria, a message appears noting this as well as the reason why the search was unsuccessful and possible actions.
If no tags are found based on the selected search criteria, a message appears noting this as well as the reason why the search was unsuccessful and possible actions.
Overlapping Tags
When multiple tags are within close proximity of one another, a summary tag is used to represent their location on the Prime Infrastructure map (Monitor > Maps). The summary tag is labeled with the number of tags at that location.
When you hover your mouse cursor over the overlapping tag on the map, a dashlet appears with summary information for the overlapping tags.
Select the Prev and Next links to move between the individual tag summary dashlets. To see detailed information on a specific tag, select the Details link while viewing the summary information of the tag.
Note![]() •
•![]() Summary information for tags includes Tag MAC address, Asset Name, Asset Group, Asset Category, Vendor (Type), Battery Life, and Last Located data (date and time). If the tag is Cisco CX v.1 compliant, telemetry information also appears.
Summary information for tags includes Tag MAC address, Asset Name, Asset Group, Asset Category, Vendor (Type), Battery Life, and Last Located data (date and time). If the tag is Cisco CX v.1 compliant, telemetry information also appears.
•![]() Detailed information for tags also includes the IP address of the associated controller, statistics, location notifications, location history, and whether the location debug feature is enabled.
Detailed information for tags also includes the IP address of the associated controller, statistics, location notifications, location history, and whether the location debug feature is enabled.
–![]() To view location history for a tag, choose that option from the Select a command drop-down list, and click Go.
To view location history for a tag, choose that option from the Select a command drop-down list, and click Go.
–![]() To return to the details page, choose Location History page from the Select a command drop-down list, and click Go.
To return to the details page, choose Location History page from the Select a command drop-down list, and click Go.
Monitoring Chokepoints
A chokepoint must be assigned to a map for its location to be monitored. After adding the TDOA receiver to a map, you must resynchronize the network designs (Services > Synchronize Services) with the mobility services engine for it to appear on the map.
When a new chokepoint is created, it is available in all the virtual domains. After placing it on a floor, it is updated so that it is available in the same virtual domain as that of a floor. When a chokepoint is removed from a floor, it will be available in all the virtual domains again.
If the existing chokepoints are on a floor, then they all belong to the same virtual domain as the floor. If the chokepoints are not placed on a floor, then they are available in all virtual domains.
If a chokepoint is not assigned to a map, you are not able to find that chokepoint using Search or Advanced Search.
All chokepoint setup is done using the AeroScout System Manager.
Note ![]() See the AeroScout Context-Aware Engine for Tags, for Cisco Mobility Services Engine Users Guide for configuration details at the following URL: http://support.aeroscout.com.
See the AeroScout Context-Aware Engine for Tags, for Cisco Mobility Services Engine Users Guide for configuration details at the following URL: http://support.aeroscout.com.
To monitor chokepoints, follow these steps:
Step 1 ![]() Choose Monitor > Chokepoints. The Chokepoint page appears showing all mapped chokepoints.
Choose Monitor > Chokepoints. The Chokepoint page appears showing all mapped chokepoints.
Step 2 ![]() To refine the search criteria when an extensive list appears, search by MAC address or chokepoint name.
To refine the search criteria when an extensive list appears, search by MAC address or chokepoint name.
a. ![]() To initiate a search for a chokepoint by its MAC address or chokepoint name, enter that value in the Search text box. Click Search.
To initiate a search for a chokepoint by its MAC address or chokepoint name, enter that value in the Search text box. Click Search.
This example show a search by MAC address.
If no match exists, a message appears in the Search Results page.
b. ![]() To initiate an advanced search for a chokepoint by its MAC address or name, click the Advanced Search link.
To initiate an advanced search for a chokepoint by its MAC address or name, click the Advanced Search link.
1. ![]() Choose Chokepoint as the search category.
Choose Chokepoint as the search category.
2. ![]() From the Search for Chokepoint by drop-down list, choose either Chokepoint Name or MAC Address.
From the Search for Chokepoint by drop-down list, choose either Chokepoint Name or MAC Address.
This list should display chokepoints belonging to the current virtual domain. Chokepoints that are not placed on a floor belongs to all virtual domains. If a chokepoint is placed on a floor, it should be displayed in the same virtual domain as the floor on which it is placed.
3. ![]() Enter either the chokepoint name or MAC address.
Enter either the chokepoint name or MAC address.
4. ![]() Click Search.
Click Search.
This example shows an advanced search using the chokepoint name.
If no match exists, a message appears in the page. Otherwise the Search Results page appears.
Monitoring Wi-Fi TDOA Receivers
A Wi-Fi TDOA receiver must be assigned to a map for its location to be monitored. After adding the TDOA receiver to a map, you must resynchronize network designs (Services > Synchronize Services) with the mobility services engine for it to appear on the map.
If a TDOA receiver is not assigned to a map, you cannot find it using Search or Advanced Search.
All TDOA receiver setup is done using the AeroScout System Manager.
When a new TDOA receiver is created, it is available in all the virtual domains. After placing it on a floor, it is updated so that it is available in the same virtual domain as that of the floor. When a TDOA receiver is removed from a floor, it will be available in all the virtual domains again.
If the existing TDOA receivers are on a floor, then they all belong to the same virtual domain as the floor. If the chokepoints are not placed on a floor, then they are available in all virtual domains.
Note ![]() See the AeroScout Context-Aware Engine for Tags, for Cisco Mobility Services Engine Users Guide for configuration details at the following URL: http://support.aeroscout.com.
See the AeroScout Context-Aware Engine for Tags, for Cisco Mobility Services Engine Users Guide for configuration details at the following URL: http://support.aeroscout.com.
To monitor TDOA receivers, follow these steps:
Step 1 ![]() Choose Monitor > WiFi TDOA Receivers. The WiFi TDOA Receivers summary page appears showing all mapped TDOA receivers.
Choose Monitor > WiFi TDOA Receivers. The WiFi TDOA Receivers summary page appears showing all mapped TDOA receivers.
Step 2 ![]() To refine the search criteria when an extensive list appears, search by MAC address or TDOA receiver name.
To refine the search criteria when an extensive list appears, search by MAC address or TDOA receiver name.
a. ![]() To initiate a search for a TDOA receiver by its MAC address or name, enter that value in the Search text box. Click Search.
To initiate a search for a TDOA receiver by its MAC address or name, enter that value in the Search text box. Click Search.
b. ![]() Click View List to see a full list of alarms.
Click View List to see a full list of alarms.
If no match exists, a message appears in the Search Results page.
c. ![]() To initiate an advanced search for a TDOA receiver by its MAC address or name, click the Advanced Search link.
To initiate an advanced search for a TDOA receiver by its MAC address or name, click the Advanced Search link.
1. ![]() Choose WiFi TDOA Receiver as the search category from the Search Criteria drop-down list.
Choose WiFi TDOA Receiver as the search category from the Search Criteria drop-down list.
2. ![]() From the Search for WiFi TDOA Receiver by drop-down list, choose either WiFi TDOA Receivers Name or MAC Address.
From the Search for WiFi TDOA Receiver by drop-down list, choose either WiFi TDOA Receivers Name or MAC Address.
This list displays Wi-Fi TDoA receivers belonging to the current virtual domain. The Wi-Fi TDoA receivers that are not placed on a floor is belongs to all virtual domains. If a Wi-Fi TDoA receivers is placed on a floor, it should be displayed in the same virtual domain as the floor on which it is placed.
3. ![]() Enter either the TDOA receiver name or MAC address.
Enter either the TDOA receiver name or MAC address.
4. ![]() Click Search.
Click Search.
This example shows an advanced search using the MAC address.
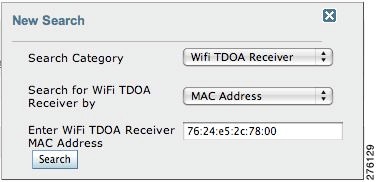
If no match exists, a message appears in the Search Results page.
Monitoring Geo-Location
The MSE provides physical location of wired clients, wired endpoints, switches, controllers, and access points present in a wireless network deployment. Currently, MSE provides location information in geo-location format to the external entities through northbound and southbound entities.
To improve the accuracy of the geo-location information provided by MSE, this feature aims to transform the geometric location co-ordinates of a device to geo-location coordinates (latitude and longitude) and provides it to the external entities through northbound and southbound interfaces.
Note ![]() At least three GPS markers are required for geo-location calculation. The maximum number of GPS markers that you can add is 20.
At least three GPS markers are required for geo-location calculation. The maximum number of GPS markers that you can add is 20.
This section contains the following topics:
•![]() Adding a GPS Marker to a Floor Map
Adding a GPS Marker to a Floor Map
•![]() Deleting a GPS Marker Present on a Floor
Deleting a GPS Marker Present on a Floor
Adding a GPS Marker to a Floor Map
To add a GPS marker to a floor map, follow these steps:
Step 1 ![]() Choose Monitor > Site Maps to display the Maps page.
Choose Monitor > Site Maps to display the Maps page.
Step 2 ![]() Choose Campus Name > Building Name > Floor Name.
Choose Campus Name > Building Name > Floor Name.
Step 3 ![]() Choose the Add/Edit GPS Markers Information menu option on the top left menu to open the Add/Edit GPS page.
Choose the Add/Edit GPS Markers Information menu option on the top left menu to open the Add/Edit GPS page.
A GPS Marker icon appears on the top left corner of the map (X=0 Y=0).
Step 4 ![]() You can drag the GPS Marker icon and place it in the desired location on the map or enter the X and Y position values in the GPS Marker Details table on the left sidebar menu to move the marker to the desired position.
You can drag the GPS Marker icon and place it in the desired location on the map or enter the X and Y position values in the GPS Marker Details table on the left sidebar menu to move the marker to the desired position.
Note ![]() If the markers added are too close, then the accuracy of geo-location information is less.
If the markers added are too close, then the accuracy of geo-location information is less.
Step 5 ![]() Enter the Latitude and Longitude degrees for the selected GPS Marker icon in the left sidebar menu.
Enter the Latitude and Longitude degrees for the selected GPS Marker icon in the left sidebar menu.
Step 6 ![]() Click Save.
Click Save.
The GPS Marker information is saved to the database.
Step 7 ![]() Click Apply to other Floors of Building to copy GPS markers on one floor of a building to all the remaining floors of that building.
Click Apply to other Floors of Building to copy GPS markers on one floor of a building to all the remaining floors of that building.
Editing a GPS Marker
To edit a GPS marker present on the floor, follow these steps:
Step 1 ![]() Choose Monitor > Site Maps to display the Maps page.
Choose Monitor > Site Maps to display the Maps page.
Step 2 ![]() Choose the Campus Name > Building Name > Floor Name.
Choose the Campus Name > Building Name > Floor Name.
Step 3 ![]() Choose the Add/Edit GPS Markers Information menu option on the top left menu to open the Add/Edit GPS page.
Choose the Add/Edit GPS Markers Information menu option on the top left menu to open the Add/Edit GPS page.
Step 4 ![]() Select an existing GPS marker present on the floor.
Select an existing GPS marker present on the floor.
Step 5 ![]() From the left sidebar menu, you can change the Latitude, Longitude, X Position, and Y Position which is associated with the GPS marker.
From the left sidebar menu, you can change the Latitude, Longitude, X Position, and Y Position which is associated with the GPS marker.
Step 6 ![]() Click Save.
Click Save.
The modified GPS marker information is now saved to the database.
Deleting a GPS Marker Present on a Floor
To delete a GPS marker present on a floor, follow these steps:
Step 1 ![]() Choose Monitor > Site Maps to display the Maps page.
Choose Monitor > Site Maps to display the Maps page.
Step 2 ![]() Choose Campus Name > Building Name > Floor Name.
Choose Campus Name > Building Name > Floor Name.
Step 3 ![]() Choose the Add/Edit GPS Markers Information menu option to open the Add/Edit GPS page.
Choose the Add/Edit GPS Markers Information menu option to open the Add/Edit GPS page.
Step 4 ![]() Select an existing GPS Marker which is present on the floor from the left sidebar menu.
Select an existing GPS Marker which is present on the floor from the left sidebar menu.
Note ![]() You can delete multiple GPS markers present on a floor by selecting the Multiple GPS Markers check box.
You can delete multiple GPS markers present on a floor by selecting the Multiple GPS Markers check box.
Step 5 ![]() Click Delete GPS Marker.
Click Delete GPS Marker.
The selected GPS marker is deleted from the database.
Ekahau Site Survey Integration
Ekahau Site Survey (ESS) tool is used for designing, deploying, maintaining, and troubleshooting high performance Wi-Fi networks. ESS works over any 802.11 network and is optimized for centrally managed 802.11n Wi-Fi networks.
You can use the ESS tool to import the existing floor maps from the Prime Infrastructure and export the project to the Prime Infrastructure. For more information, see the Cisco Prime Infrastructure Integration section on the ESS online help or access the user guide at: C:\Program Files\Ekahau\Ekahau Site Survey\doc.
Note ![]() The Prime Infrastructure site survey calibration requires that you have colected at least 150 survey data points at 50 distinct locations. If you do not have enough survey data points, a warning is given when trying to export the survey data.
The Prime Infrastructure site survey calibration requires that you have colected at least 150 survey data points at 50 distinct locations. If you do not have enough survey data points, a warning is given when trying to export the survey data.
Note ![]() If there are no access points in the Prime Infrastructure during the site survey, the site survey will not happen.
If there are no access points in the Prime Infrastructure during the site survey, the site survey will not happen.
Note ![]() If the floor map scales are incorrect in the Prime Infrastructure, the visualizations in the ESS will be distorted.
If the floor map scales are incorrect in the Prime Infrastructure, the visualizations in the ESS will be distorted.
AirMagnet Survey and Planner Integration
AirMagnet survey and AirMagnet planner is integrated with the Cisco Prime Infrastructure. This integration increases the operational efficiencies by eliminating the need to repeat the wireless planning and site survey tasks commonly associated with deployment and management of wireless LAN networks.
The AirMagnet survey tool allows you to export real world survey data to the Prime Infrastructure for calibrating planner modelling. With the AirMagnet planner, you can create and export planner projects directly to the Prime Infrastructure. This enables the Prime Infrastructure to create its own project directly from the imported AirMagnet Planner tool. For more information, see AirMagnet Survey and Planning documentation.
Monitoring Wired Switches
You can review details on the wired switch (IP address, serial number, software version, and ELIN), its ports, its wired clients (count and status), and its civic information.
Wired switch data is downloaded to the mobility services engine through the Prime Infrastructure when the Ethernet switch and the mobility services engine are synchronized (Services > Synchronize Services > Switches). Communication between a location-capable switch and a mobility services engine occurs over NMSP. The Prime Infrastructure and the mobility services engine communicate over XML.
To view details on wired switches, follow these steps:
Step 1 ![]() Choose Services > Mobility Services Engines.
Choose Services > Mobility Services Engines.
Step 2 ![]() In the Mobility Services page, click the device name link of the appropriate wired location switch.
In the Mobility Services page, click the device name link of the appropriate wired location switch.
Step 3 ![]() Choose Context Aware Service > Wired > Wired Switches. A summary of wired switches that are synchronized with the mobility services engine appears.
Choose Context Aware Service > Wired > Wired Switches. A summary of wired switches that are synchronized with the mobility services engine appears.
Step 4 ![]() To see more details on the switch, its ports, its wired clients (count and status), and its civic information, click the IP address link.
To see more details on the switch, its ports, its wired clients (count and status), and its civic information, click the IP address link.
Note ![]() You can export civic information from the switch by choosing that option from the Select a command drop-down list. This option is available on all four tabs in the Wired Switches page.
You can export civic information from the switch by choosing that option from the Select a command drop-down list. This option is available on all four tabs in the Wired Switches page.
•![]() On the Switch Information tab, a total count of wired clients connected to the switch is summarized along with their state (connected, disconnected, and unknown).
On the Switch Information tab, a total count of wired clients connected to the switch is summarized along with their state (connected, disconnected, and unknown).
•![]() Connected clients—Clients that are connected to the wired switch.
Connected clients—Clients that are connected to the wired switch.
•![]() Disconnected clients—Clients that are disconnected from the wired switch.
Disconnected clients—Clients that are disconnected from the wired switch.
•![]() Unknown clients—Clients are marked as unknown when the NMSP connection to the wired switch is lost.
Unknown clients—Clients are marked as unknown when the NMSP connection to the wired switch is lost.
You can view detailed wired client information by clicking one of the client count links (total clients, connected, disconnected, and unknown). See the "Monitoring Wired Clients" section for details.
Step 5 ![]() Click the Switch Ports tab to see a detailed list of the ports on the switch.
Click the Switch Ports tab to see a detailed list of the ports on the switch.
You can change the listing order (ascending, descending) of port IP addresses, slot numbers, module number, and port number by clicking the respective column heading.
Step 6 ![]() Click the Civic tab to see a detailed list of the civic information for the wired switch.
Click the Civic tab to see a detailed list of the civic information for the wired switch.
Step 7 ![]() Click the Advanced tab to see a detailed list of the additional civic information for the wired switch.
Click the Advanced tab to see a detailed list of the additional civic information for the wired switch.
Monitoring Wired Clients
You can view details on a wired client (MAC address, IP address, username, serial number, UDI, model no., software version, and VLAN ID), its port, and its civic information.
Wired client data is downloaded to the mobility services engine through the Prime Infrastructure when the switch and the mobility services engine are synchronized (Services > Synchronize Services > Switches).
Communication between a location-capable switch and a mobility services engine occurs over NMSP. The Prime Infrastructure and the mobility services engine communicate over XML.
You can view the details of the wired clients in either the Wired Switches page (Context Aware Service > Wired > Wired Switches) or wired clients page (Context Aware Service > Wired > Wired Clients).
•![]() If you know the IP address, MAC address, VLAN ID, serial number, or username, you can use the Search text box in the Wired Clients page.
If you know the IP address, MAC address, VLAN ID, serial number, or username, you can use the Search text box in the Wired Clients page.
•![]() If you want to examine wired clients as they relate to a specific switch, you can view that information in the Wired Switches page. See the "Monitoring Wired Clients" section.
If you want to examine wired clients as they relate to a specific switch, you can view that information in the Wired Switches page. See the "Monitoring Wired Clients" section.
To view details on a wired client, follow these steps:
Step 1 ![]() Choose Services > Mobility Services Engines. The Mobility Services page appears.
Choose Services > Mobility Services Engines. The Mobility Services page appears.
Step 2 ![]() Click the device name link of the appropriate wired location switch.
Click the device name link of the appropriate wired location switch.
Step 3 ![]() Choose Context Aware Service > Wired > Wired Clients.
Choose Context Aware Service > Wired > Wired Clients.
In the Wired Clients summary page, clients are grouped by their switch.
The status of a client is noted as connected, disconnected, or unknown. Definitions are summarized as follows:
•![]() Connected clients—Clients that are active and connected to a wired switch.
Connected clients—Clients that are active and connected to a wired switch.
•![]() Disconnected clients—Clients that are disconnected from the wired switch.
Disconnected clients—Clients that are disconnected from the wired switch.
•![]() Unknown clients—Clients that are marked as unknown when the NMSP connection to the wired switch is lost.
Unknown clients—Clients that are marked as unknown when the NMSP connection to the wired switch is lost.
•![]() If you know the MAC address of the wired client, then you can click that link to reach the detail page of the client or use the Search text box.
If you know the MAC address of the wired client, then you can click that link to reach the detail page of the client or use the Search text box.
–![]() You can also search for a wired client by its IP address, username, or VLAN ID.
You can also search for a wired client by its IP address, username, or VLAN ID.
•![]() If you click the IP address of the switch, you are forwarded to the detail page of the switch. See the "Monitoring Wired Clients" section.
If you click the IP address of the switch, you are forwarded to the detail page of the switch. See the "Monitoring Wired Clients" section.
Step 4 ![]() Click the Port Association tab to show the physical location of the switch port/slot/module on which the wired client terminates, the client status (connected, disconnected, unknown), and the switch IP address.
Click the Port Association tab to show the physical location of the switch port/slot/module on which the wired client terminates, the client status (connected, disconnected, unknown), and the switch IP address.
Step 5 ![]() Click the Civic Address tab to show any civic address information.
Click the Civic Address tab to show any civic address information.
Step 6 ![]() Click the Advanced tab to see extended physical address details for the wired clients, if any.
Click the Advanced tab to see extended physical address details for the wired clients, if any.
Note ![]() A client takes on the civic address and advanced location information that is configured for the port on which the client terminates. If no civic and advanced information are defined for the port (port/slot/module), then no location data is displayed.
A client takes on the civic address and advanced location information that is configured for the port on which the client terminates. If no civic and advanced information are defined for the port (port/slot/module), then no location data is displayed.
Monitoring Interferers
The Monitor > Interferer page allows you to monitor interfering devices detected by the CleanAir-enabled access points.
This section contains the following topics:
•![]() Monitor > Interferers > AP Detected Interferers
Monitor > Interferers > AP Detected Interferers
•![]() Monitor > Interferers > AP Detected Interferers > Interferer Details
Monitor > Interferers > AP Detected Interferers > Interferer Details
•![]() Monitor > Interferers > Edit View
Monitor > Interferers > Edit View
•![]() Clustering of Monitor Mode APs Using the MSE
Clustering of Monitor Mode APs Using the MSE
Monitor > Interferers > AP Detected Interferers
Choose Monitor > Interferers to view all the interfering devices detected by the CleanAir-enabled access points on your wireless network. This page enables you to view a summary of the interfering devices including the following default information:
Note ![]() Whenever an Inverter or a Jammers is detected on your network, an alarm is generated and the same information is displayed on the Security Dashboard of the Prime Infrastructure UI. The controller sends traps to the Prime Infrastructure for the corresponding device.
Whenever an Inverter or a Jammers is detected on your network, an alarm is generated and the same information is displayed on the Security Dashboard of the Prime Infrastructure UI. The controller sends traps to the Prime Infrastructure for the corresponding device.
•![]() Interferer ID—A unique identifier for the interferer. Click this link to learn more about the interferer.
Interferer ID—A unique identifier for the interferer. Click this link to learn more about the interferer.
•![]() Type—Indicates the category of the interferer. Click to read more about the type of device. The pop-up dialog appears displaying more details. The categories include the following:
Type—Indicates the category of the interferer. Click to read more about the type of device. The pop-up dialog appears displaying more details. The categories include the following:
–![]() Bluetooth link—A Bluetooth link (802.11b/g/n only)
Bluetooth link—A Bluetooth link (802.11b/g/n only)
–![]() Microwave Owen—A microwave oven (802.11b/g/n only)
Microwave Owen—A microwave oven (802.11b/g/n only)
–![]() 802.11 FH—An 802.11 frequency-hopping device (802.11b/g/n only)
802.11 FH—An 802.11 frequency-hopping device (802.11b/g/n only)
–![]() Bluetooth Discovery—A Bluetooth discovery (802.11b/g/n only)
Bluetooth Discovery—A Bluetooth discovery (802.11b/g/n only)
–![]() TDD Transmitter—A time division duplex (TDD) transmitter
TDD Transmitter—A time division duplex (TDD) transmitter
–![]() Jammer—A jamming device
Jammer—A jamming device
–![]() Continuous Transmitter—A continuous transmitter
Continuous Transmitter—A continuous transmitter
–![]() DECT-like Phone—A Digital Enhanced Cordless Telecommunication (DECT)-compatible phone
DECT-like Phone—A Digital Enhanced Cordless Telecommunication (DECT)-compatible phone
–![]() Video—A video camera
Video—A video camera
–![]() 802.15.4—An 802.15.4 device (802.11b/g/n only)
802.15.4—An 802.15.4 device (802.11b/g/n only)
–![]() WiFi Inverted—A device using spectrally inverted Wi-Fi signals
WiFi Inverted—A device using spectrally inverted Wi-Fi signals
–![]() WiFi Invalid—A device using non-standard Wi-Fi channels
WiFi Invalid—A device using non-standard Wi-Fi channels
–![]() SuperAG—An 802.11 SuperAG device
SuperAG—An 802.11 SuperAG device
–![]() Canopy—A Motorola Canopy device
Canopy—A Motorola Canopy device
–![]() Radar—A radar device (802.11a/n only)
Radar—A radar device (802.11a/n only)
–![]() XBox—A Microsoft Xbox (802.11b/g/n only)
XBox—A Microsoft Xbox (802.11b/g/n only)
–![]() WiMAX Mobile—A WiMAX mobile device (802.11a/n only)
WiMAX Mobile—A WiMAX mobile device (802.11a/n only)
–![]() WiMAX Fixed—A WiMAX fixed device (802.11a/n only)
WiMAX Fixed—A WiMAX fixed device (802.11a/n only)
•![]() Status—Indicates the status of the interfering device.
Status—Indicates the status of the interfering device.
–![]() Active—Indicates that the interferer is currently being detected by the CleanAir-enabled access point.
Active—Indicates that the interferer is currently being detected by the CleanAir-enabled access point.
–![]() Inactive—Indicates that the interferer is no longer being detected by the CleanAir-enabled access point or the CleanAir-enabled access point detected that the interferer is no longer reachable by the Prime Infrastructure.
Inactive—Indicates that the interferer is no longer being detected by the CleanAir-enabled access point or the CleanAir-enabled access point detected that the interferer is no longer reachable by the Prime Infrastructure.
•![]() Severity—Shows the severity ranking of the interfering device.
Severity—Shows the severity ranking of the interfering device.
•![]() Affected Band—Shows the band in which this device is interfering.
Affected Band—Shows the band in which this device is interfering.
•![]() Affected Channels—Shows the affected channels.
Affected Channels—Shows the affected channels.
•![]() Duty Cycle (%)—The duty cycle of interfering device in percentage.
Duty Cycle (%)—The duty cycle of interfering device in percentage.
•![]() Discovered—Shows the time at which it was discovered.
Discovered—Shows the time at which it was discovered.
•![]() Last Updated—The last time the interference was detected.
Last Updated—The last time the interference was detected.
•![]() Floor—The location where the interfering device is present.
Floor—The location where the interfering device is present.
Note ![]() These devices appear only if the option to track Interferers is enabled in the Tracking Parameters page. This option is disabled by default. For more information on tracking parameters, see the "Modifying Tracking Parameters" section.
These devices appear only if the option to track Interferers is enabled in the Tracking Parameters page. This option is disabled by default. For more information on tracking parameters, see the "Modifying Tracking Parameters" section.
Monitor > Interferers > AP Detected Interferers > Interferer Details
Choose Monitor > Interferers > Interferer ID to view this page. This page enables you to view the details of the interfering devices detected by the access points. This page provides the following details about the interfering device:
•![]() Interferer Properties
Interferer Properties
–![]() Type—Shows the type of the interfering device detected by the AP.
Type—Shows the type of the interfering device detected by the AP.
•![]() Status—The status of the interfering device.
Status—The status of the interfering device.
–![]() Active—Indicates that the interferer is currently being detected by the CleanAir-enabled access point.
Active—Indicates that the interferer is currently being detected by the CleanAir-enabled access point.
–![]() Inactive—Indicates that the interferer is no longer being detected by the CleanAir-enabled access point or the CleanAir-enabled access point detected that the interferer is no longer reachable by the Prime Infrastructure.
Inactive—Indicates that the interferer is no longer being detected by the CleanAir-enabled access point or the CleanAir-enabled access point detected that the interferer is no longer reachable by the Prime Infrastructure.
–![]() Severity—Shows the severity ranking of the interfering device.
Severity—Shows the severity ranking of the interfering device.
–![]() Duty Cycle (%)—The duty cycle of interfering device in percentage.
Duty Cycle (%)—The duty cycle of interfering device in percentage.
–![]() Affected Band—Shows the band in which this device is interfering.
Affected Band—Shows the band in which this device is interfering.
–![]() Affected Channels—Shows the affected channels.
Affected Channels—Shows the affected channels.
–![]() Discovered—Shows the time at which it was discovered.
Discovered—Shows the time at which it was discovered.
–![]() Last Updated—The last time the interference was detected.
Last Updated—The last time the interference was detected.
•![]() Location
Location
–![]() Floor—The location where this interfering device was detected.
Floor—The location where this interfering device was detected.
–![]() Last Located At—The last time where the interfering device was located.
Last Located At—The last time where the interfering device was located.
–![]() On MSE—The mobility services engine on which this interfering device was located.
On MSE—The mobility services engine on which this interfering device was located.
•![]() Clustering Information
Clustering Information
–![]() Clustered By—Shows the following:
Clustered By—Shows the following:
IP address of the controller if clustered by a controller.
IP address of the mobility services engine if clustered by a mobility services engine.
–![]() Detecting APs—Shows the details of the access point that has detected the interfering device. The details include Access Point Name (MAC), Severity, and Duty Cycle(%).
Detecting APs—Shows the details of the access point that has detected the interfering device. The details include Access Point Name (MAC), Severity, and Duty Cycle(%).
Note ![]() The detecting access point information is available only for active devices and sometimes information about the active devices may not be available. This is because interferers are in the process of being marked inactive and in the next refresh of the Monitor > Interferers page, appear as inactive.
The detecting access point information is available only for active devices and sometimes information about the active devices may not be available. This is because interferers are in the process of being marked inactive and in the next refresh of the Monitor > Interferers page, appear as inactive.
•![]() Details—Shows a short description about the interfering type.
Details—Shows a short description about the interfering type.
Select a command
The Select a command drop-down list provides access to the location history of the interfering device detected by the access point. See the "Monitor > Interferers > AP Detected Interferer Details > Interference Device ID > Location History" section.
Monitor > Interferers > AP Detected Interferer Details > Interference Device ID > Location History
Choose Monitor > Interferers > Interference Device ID, choose Location History from the Select a command drop-down list, and click Go to view this page.
•![]() Interferer Information—Displays the basic information about the interfering device.
Interferer Information—Displays the basic information about the interfering device.
–![]() Data Collected At—The time stamp at which the data was collected.
Data Collected At—The time stamp at which the data was collected.
–![]() Type—The type of the interfering device.
Type—The type of the interfering device.
–![]() Severity—The severity index of the interfering device.
Severity—The severity index of the interfering device.
–![]() Duty Cycle—The duty cycle (in percentage) of the interfering device.
Duty Cycle—The duty cycle (in percentage) of the interfering device.
–![]() Affected Channels—A comma-separated list of the channels affected.
Affected Channels—A comma-separated list of the channels affected.
•![]() Interferer Location History—Displays the location history of the interfering devices.
Interferer Location History—Displays the location history of the interfering devices.
–![]() Time Stamp
Time Stamp
–![]() Floor
Floor
•![]() Clustering Information
Clustering Information
–![]() Clustered By
Clustered By
•![]() Detecting APs
Detecting APs
–![]() AP Name—The access point that detected the interfering device.
AP Name—The access point that detected the interfering device.
–![]() Severity—The severity index of the interfering device.
Severity—The severity index of the interfering device.
–![]() Duty Cycle(%)—The duty cycle (in percentage) of the interfering device.
Duty Cycle(%)—The duty cycle (in percentage) of the interfering device.
•![]() Location
Location
–![]() Location Calculated At—Displays the time stamp at which this information was generated.
Location Calculated At—Displays the time stamp at which this information was generated.
–![]() Floor—Displays location information of the interfering device.
Floor—Displays location information of the interfering device.
–![]() A graphical view of the location of the interfering device is displayed in a map. Click the Enlarge link to view an enlarged image.
A graphical view of the location of the interfering device is displayed in a map. Click the Enlarge link to view an enlarged image.
Monitor > Interferers > Edit View
The Edit View page allows you to add, remove, or reorder columns in the AP Detected Interferers Summary page. It also allows you to search for Interferers. By default, only those interferers that are in Active state and with a severity greater than or equal to 5 are displayed in the AP Detected Interferers page. For more information on editing search criteria, see the "Monitor > Interferers > Edit View > Edit Search" section.
To edit the columns in the AP Detected Interferers page, follow these steps:
Step 1 ![]() Choose Monitor > Interferers. The AP Detected Interferers page appears showing details of the interferers detected by the CleanAir-enabled access points.
Choose Monitor > Interferers. The AP Detected Interferers page appears showing details of the interferers detected by the CleanAir-enabled access points.
Step 2 ![]() Click the Edit View link in the AP Detected Interferers page.
Click the Edit View link in the AP Detected Interferers page.
Step 3 ![]() To add an additional column to the access points table, click to highlight the column heading in the left column. Click Show to move the heading to the right column. All items in the right column are displayed in the table.
To add an additional column to the access points table, click to highlight the column heading in the left column. Click Show to move the heading to the right column. All items in the right column are displayed in the table.
Step 4 ![]() To remove a column from the access points table, click to highlight the column heading in the right column. Click Hide to move the heading to the left column. All items in the left column are not displayed in the table.
To remove a column from the access points table, click to highlight the column heading in the right column. Click Hide to move the heading to the left column. All items in the left column are not displayed in the table.
Step 5 ![]() Use the Up/Down buttons to specify the order in which the information appears in the table. Highlight the desired column heading and click Up or Down to move it higher or lower in the current list.
Use the Up/Down buttons to specify the order in which the information appears in the table. Highlight the desired column heading and click Up or Down to move it higher or lower in the current list.
Step 6 ![]() Click Reset to restore the default view.
Click Reset to restore the default view.
Step 7 ![]() Click Submit to confirm the changes.
Click Submit to confirm the changes.
Monitor > Interferers > Edit View > Edit Search
You can search for interferers based on certain criteria. By default, only those interferers that are in Active state and with a severity greater than or equal to 5 are displayed in the AP Detected Interferers page. Use the Edit Search option to customize the interferer search.
To edit the search criteria, follow these steps:
Step 1 ![]() Choose Monitor > Interferers. The AP Detected Interferers page appears.
Choose Monitor > Interferers. The AP Detected Interferers page appears.
Step 2 ![]() Click Edit Search and complete the applicable parameters in the New Search dialog box (see Figure 11-8).
Click Edit Search and complete the applicable parameters in the New Search dialog box (see Figure 11-8).
Figure 11-8 Monitor > Interferers > Edit View > Edit Search
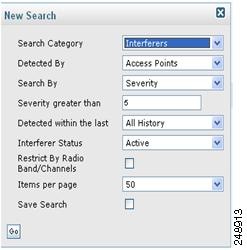
This option allows you to specify the following search criteria:
•![]() Search Category—For interferer search, the search category is Interferers.
Search Category—For interferer search, the search category is Interferers.
•![]() Detected By—Choose from the drop-down list if the interferer is detected by access points or interferer.
Detected By—Choose from the drop-down list if the interferer is detected by access points or interferer.
•![]() Search By—Choose one of the options from the list:
Search By—Choose one of the options from the list:
–![]() All Interferers
All Interferers
–![]() Interferer ID
Interferer ID
–![]() Interferer Type
Interferer Type
–![]() Severity
Severity
–![]() Duty Cycle
Duty Cycle
–![]() Location
Location
•![]() Severity greater than—Enter the severity level in the text box.
Severity greater than—Enter the severity level in the text box.
•![]() Detected within the last—Choose one of the following option from the drop-down list:
Detected within the last—Choose one of the following option from the drop-down list:
–![]() 5 Minutes
5 Minutes
–![]() 15 Minutes
15 Minutes
–![]() 30 Minutes
30 Minutes
–![]() 1 Hour
1 Hour
–![]() 3 Hours
3 Hours
–![]() 6 Hours
6 Hours
–![]() 12 Hours
12 Hours
–![]() 24 Hours
24 Hours
–![]() All History
All History
•![]() Interferer status—Choose one of the following option from the drop-down list:
Interferer status—Choose one of the following option from the drop-down list:
–![]() Active
Active
–![]() Inactive
Inactive
–![]() All
All
•![]() Restrict By Radio Band/Channels—Select this check box if you want to restrict certain radio frequencies or channels from the search. By default, this check box is unselected. On selecting this check box, a drop-down list appears with 2.4-GHz, 5-GHz and Individual Channel options. If you choose Individual Channel, an Affected Channels text box appears. Specify the channel and select either the Match All or Match Any radio button.
Restrict By Radio Band/Channels—Select this check box if you want to restrict certain radio frequencies or channels from the search. By default, this check box is unselected. On selecting this check box, a drop-down list appears with 2.4-GHz, 5-GHz and Individual Channel options. If you choose Individual Channel, an Affected Channels text box appears. Specify the channel and select either the Match All or Match Any radio button.
Step 3 ![]() Select the number of items per page that you want to view in the search results.
Select the number of items per page that you want to view in the search results.
Step 4 ![]() Select the Save Search check box if you want to save the search.
Select the Save Search check box if you want to save the search.
Step 5 ![]() After specifying the search criteria, click Go to view the search results.
After specifying the search criteria, click Go to view the search results.
Clustering of Monitor Mode APs Using the MSE
You can use the MSE to cluster monitor-mode APs for interference detection and location process. This clustering is based on distance and not neighbor maps. All Monitor mode APs within 150 feet from a particular AP form a cluster.
However, this fixed distance does not work for some of the scenarios and needs to be configured. You can use the following command to change the default distance value for clustering:
config spectrum-monitor-mode-ap-clustering-distance value
Where value is the distance in feet for clustering. The default value is 150.
 Feedback