Monitoring the Controller

Viewing System Resources

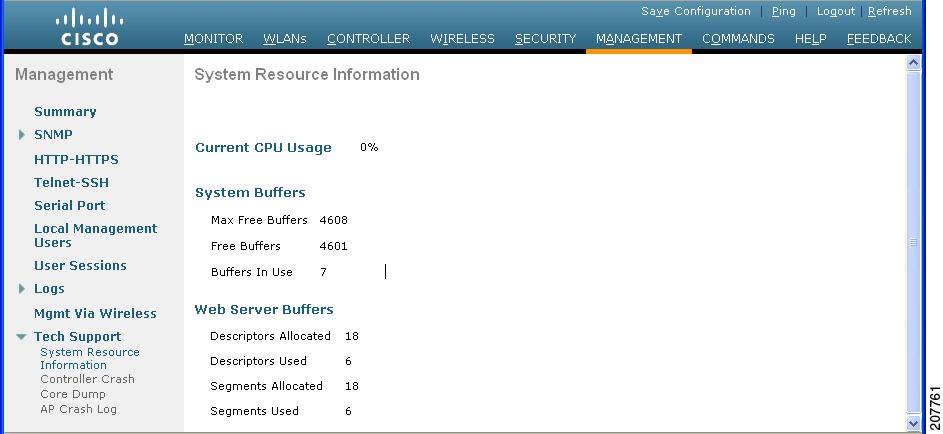
You can determine the amount of system resources being used by the controller. Specifically, you can view the current controller CPU usage, system buffers, and web server buffers.

The controllers have multiple CPUs, so you can view individual CPU usage. For each CPU, you can see the percentage of the CPU in use and the percentage of the CPU time spent at the interrupt level (for example, 0%/3%).
Viewing System Resources (GUI)

On the controller GUI, choose Management > Tech Support > System Resource Information. The System Resource Information page appears.

Figure 1. System Resource Information Page

The following system information is displayed:

  • System Resource Information: Displays current and individual CPU usage, system buffers, and web server buffers.

  • Controller Crash Information: Displays information present in the controller crash log file.

  • Core Dump: Configures the core dump transfer through FTP. You must enter the server details to where the core dump has to be transferred.

  • AP Crash Logs: Displays AP crash log information.

  • System Statistics:

    • IO Stats: Displays CPU and input/output statistics for the controller.

    • Top: Displays the CPU usage.

  • Dx LCache Summary: Displays database and local cache statistics.

Viewing System Resources (CLI)

On the controller CLI, enter these commands:

  • show cpu : Displays current CPU usage information.

    The first number is the CPU percentage that the controller spent on the user application and the second number is the CPU percentage that the controller spent on the OS services.

  • show tech-support : Displays system resource information.

  • show system dmesg clear : Clears the dmesg logs after first printing its contents. The dmesg file contains the kernel log-messages.

  • show system interfaces : Displays information about the configured network interfaces.

  • show system interrupts : Displays the number of interrupts.

  • show system iostat {summary | detail} : Displays CPU and input/output statistics.

  • show system ipv6 :

    • show system ipv6 neighbours : Displays the IPv6 neighbor cache.

    • show system ipv6 netstat : Displays system network IPv6 stats.

    • show system ipv6 route : Displays the IPv6 route information.

  • show system meminfo : Displays system memory information.

  • show system neighbours : Displays the IPv6 neighbor cache.

  • show system netstat : Displays system network stats.

  • show system portstat :

    • show system portstat all verbose : Displays all system active service or port statistics.

    • show system portstat tcp verbose : Displays system active service or port statistics related to TCP.

    • show system portstat udp verbose : Displays system active service or port statistics related to UDP.

  • show system process :

    • show system process maps pid : Displays region of contiguous virtual memory in the PID.

    • show system process stat {all | pid} : Displays statistics for all or a particular process.

    • show system process summary : Displays a summary of processes.

  • show system route : Displays system routing table.

  • show system slabs : Displays memory usage on slab level.

  • show system slabtop : Displays the slab usage.

  • show system timer ticks : Displays the number of ticks and seconds since the timer lib started.

  • show system top : Provides an ongoing look at processor activity in real time. It displays a list of the most CPU-intensive tasks performed on the system.

  • show system usb : Displays configuration of USB.

  • show system vmstat : Displays system virtual memory statistics.