Cisco Unified Serviceability Administration Guide, Release 10.0(1)
Bias-Free Language
The documentation set for this product strives to use bias-free language. For the purposes of this documentation set, bias-free is defined as language that does not imply discrimination based on age, disability, gender, racial identity, ethnic identity, sexual orientation, socioeconomic status, and intersectionality. Exceptions may be present in the documentation due to language that is hardcoded in the user interfaces of the product software, language used based on RFP documentation, or language that is used by a referenced third-party product. Learn more about how Cisco is using Inclusive Language.
- Updated:
- November 27, 2013
Chapter: Tools and Reports
- Serviceability Reports Archive
- Serviceability Reporter service parameters
- Device Statistics Report
- Server statistics report
- Service Statistics Report
- Call activities report
- Alert summary report
- Performance Protection Report
- Set up serviceability reports archive overview
- Set up Serviceability Reports Archive
- Access to Serviceability Reports Archive
Tools and Reports
Serviceability Reports Archive
The Cisco Serviceability Reporter service generates daily reports containing charts that display a summary of the statistics for that particular report. Reporter generates reports once a day on the basis of logged information.
Using the serviceability GUI, view reports from . You must activate the Cisco Serviceability Reporter service before you can view reports. After you activate the service, report generation may take up to 24 hours.
The reports contain 24-hour data for the previous day. A suffix that is added to the report names shows the date for which Reporter generated them; for example, AlertRep_mm_dd_yyyy.pdf. The Serviceability Reports Archive window uses this date to display the reports for the relevant date only. The reports generate from the data that is present in the log files, with the timestamp for the previous day. The system considers log files for the current date and the previous two days for collecting data.
The time that is shown in the report reflects the server "System Time."
You can retrieve log files from the server while you are generating reports.
 Note |
The Cisco Unified Reporting web application provides snapshot views of data into one output and runs data checks. The application also allows you to archive generated reports. See the Cisco Unified Reporting Administration Guide for more information. |
Serviceability Report Archive considerations for cluster configurations
This section applies to Cisco Unified Communications Manager and IM and Presence Service only.
- Because the Cisco Serviceability Reporter is only active on the first server, at any time, Reporter generates reports only on the first server, not the other servers.
- The time that is shown in the report reflects the first server "System Time." If the first server and subsequent servers are in different time zones, the first server "System Time" shows in the report.
- The time zone differences between the server locations in a cluster are taken into account when data is collected for the reports.
- You can select log files from individual servers or from all servers in the cluster when you generate reports.
- Cisco Unified Reporting web application output and data checks include cluster data from all accessible servers.
- Serviceability Reporter service parameters
- Device Statistics Report
- Server statistics report
- Service Statistics Report
- Call activities report
- Alert summary report
- Performance Protection Report
- Set up serviceability reports archive overview
- Set up Serviceability Reports Archive
- Access to Serviceability Reports Archive
Serviceability Reporter service parameters
Cisco Serviceability Reporter uses the following service parameters:
- RTMT Reporter Designated Node - Specifies the designated node on which RTMT Reporter runs. This default equals the IP address of the server on which the Cisco Serviceability Reporter service is first activated. Cisco Unified Communications Manager only: Because the Serviceability Reporter service is CPU intensive, Cisco recommends that you specify a non-call-processing node.
- Report Generation Time - Specifies the number of minutes after midnight. Reports are generated at this time for the most recent day. The minimum value equals 0 and the maximum value equals 1439.
- Report Deletion Age - Specifies the number of days that the report must be kept on the disk. The system deletes reports that are older than the specified age. The minimum value equals 0, and the maximum value equals 30.
 Tip |
You can disable reports by setting the service parameter Report Deletion Age to a value of 0. |
For more information about service parameter configuration, see the following guides:
- Cisco Unified Communications Manager only: Cisco Unified Communications Manager Administration Guide
- Connection only: System Administration Guide for Cisco Unity Connection
Device Statistics Report
The Device Statistics Report does not apply to IM and Presence Service and Cisco Unity Connection.
The Device Statistics Report provides the following line charts:
- Number of Registered Phones per Server
- Number of H.323 Gateways in the Cluster
- Number of Trunks in the Cluster
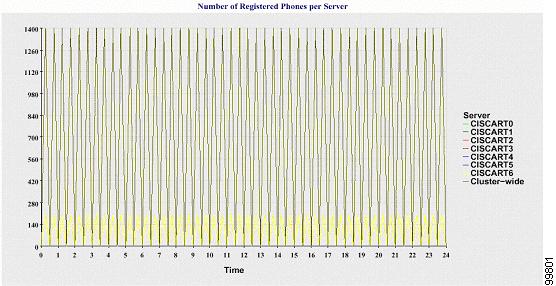
Number of Registered Phones per Server
A line chart displays the number of registered phones for each Cisco Unified Communications Manager server (and cluster in a Cisco Unified Communications Manager cluster configuration). Each line in the chart represents the data for a server for which data is available, and one extra line displays the clusterwide data ( Cisco Unified Communications Manager clusters only). Each data value in the chart represents the average number of phones that are registered for a 15-minute duration. If a server shows no data, Reporter does not generate the line that represents that server. If no data exists for the server (or for all servers in a Cisco Unified Communications Manager cluster configuration), for registered phones, Reporter does not generate the chart. The message "No data for Device Statistics report available" displays.
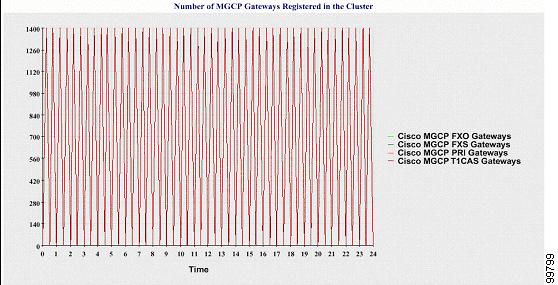
Number of MGCP Gateways Registered in the Cluster
A line chart displays the number of registered MGCP FXO, FXS, PRI, and T1CAS gateways. Each line represents data only for the Cisco Unified Communications Manager server (or cluster in a Cisco Unified Communications Manager cluster configuration); so, four lines show server (or clusterwide) details for each gateway type. Each data value in the chart represents the average number of MGCP gateways that are registered for a 15-minute duration. If no data exists for a gateway for the server (or all the servers in a cluster), Reporter does not generate the line that represents data for that particular gateway. If no data exists for all gateways for the server (or for all servers in a cluster), Reporter does not generate the chart.
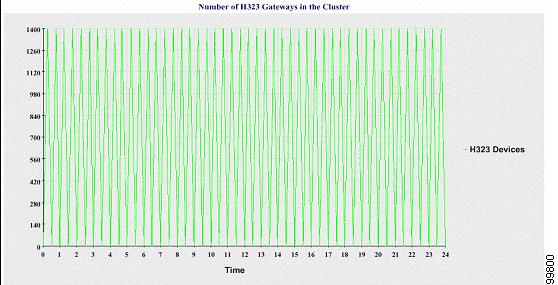
Number of H.323 Gateways in the Cluster
A line chart displays the number of H.323 gateways. One line represents the details of the H.323 gateways (or the clusterwide details in a Cisco Unified Communications Manager cluster configuration). Each data value in the chart represents the average number of H.323 gateways for a 15-minute duration. If no data exists for H.323 gateways for the server (or for all servers in a cluster), Reporter does not generate the chart.
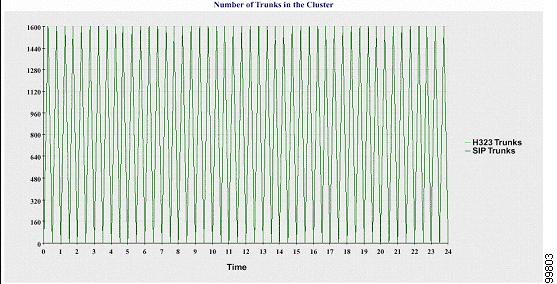
Number of Trunks in the Cluster
A line chart displays the number of H.323 and SIP trunks. Two lines represent the details of the H.323 trunks and SIP trunks (or the clusterwide details in a Cisco Unified Communications Manager cluster configuration). Each data value in the chart represents the average number of H.323 and SIP trunks for a 15-minute duration. If no data exists for H.323 trunks for the server (or for all servers in a cluster), Reporter does not generate the line that represents data for the H.323 trunks. If no data exists for SIP trunks for the server (or for all servers in the cluster), Reporter does not generate the line that represents data for SIP trunks. If no data exists for trunks at all, Reporter does not generate the chart.
The server (or each server in the cluster) contains log files that match the filename pattern DeviceLog_mm_dd_yyyy_hh_mm.csv. The following information exists in the log file:
- Number of registered phones on the server (or on each server in a Cisco Unified Communications Manager cluster)
- Number of registered MGCP FXO, FXS, PRI, and T1CAS gateways on the server (or on each server in a Cisco Unified Communications Manager cluster)
- Number of registered H.323 gateways on the server (or on each server in a Cisco Unified Communications Manager cluster)
- Number of SIP trunks and H.323 trunks
Server statistics report
The Server Statistics Report provides the following line charts:
- Percentage of CPU per Server
- Percentage of Memory Usage per Server
- Percentage of Hard Disk Usage of the Largest Partition per Server
Cluster-specific statistics are only supported by Cisco Unified Communications Manager and IM and Presence Service.
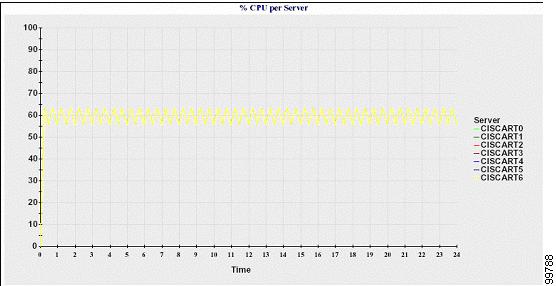
Percentage of CPU per Server
A line chart displays the percentage of CPU usage for the server (or for each server in a cluster). The line in the chart represents the data for the server (or one line for each server in a cluster) for which data is available. Each data value in the chart represents the average CPU usage for a 15-minute duration. If no data exists for the server (or for any one server in a cluster), Reporter does not generate the line that represents that server. If there are no lines to generate, Reporter does not create the chart. The message "No data for Server Statistics report available" displays.
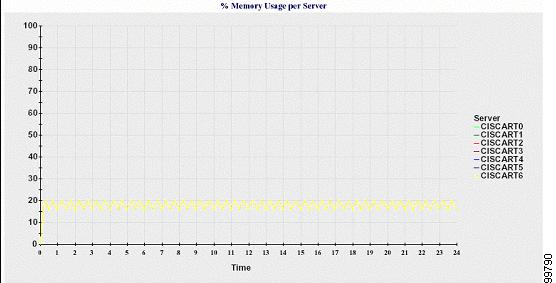
Percentage of Memory Usage per Server
A line chart displays the percentage of Memory Usage for the Cisco Unified Communications Manager server (%MemoryInUse). In a Cisco Unified Communications Manager cluster configuration, there is one line per server in the cluster for which data is available. Each data value in the chart represents the average memory usage for a 15-minute duration. If no data exists, Reporter does not generate the chart. If no data exists for any server in a cluster configuration, Reporter does not generate the line that represents that server.
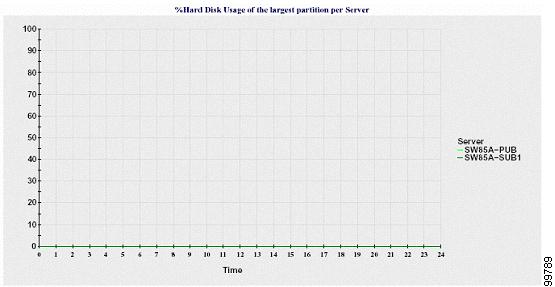
Percentage of Hard Disk Usage of the Largest Partition per Server
A line chart displays the percentage of disk space usage for the largest partition on the server (%DiskSpaceInUse), or on each server in a cluster configuration. Each data value in the chart represents the average disk usage for a 15-minute duration. If no data exists, Reporter does not generate the chart. If no data exists for any one server in a cluster configuration, Reporter does not generate the line that represents that server.
The server (or each server in a cluster configuration) contains log files that match the filename pattern ServerLog_mm_dd_yyyy_hh_mm.csv. The following information exists in the log file:
Service Statistics Report
The Service Statistics Report does not support IM and Presence Service and Cisco Unity Connection.
The Service Statistics Report provides the following line charts:
- Cisco CTI Manager: Number of Open Devices
- Cisco CTI Manager: Number of Open Lines
- Cisco TFTP: Number of Requests
- Cisco TFTP: Number of Aborted Requests
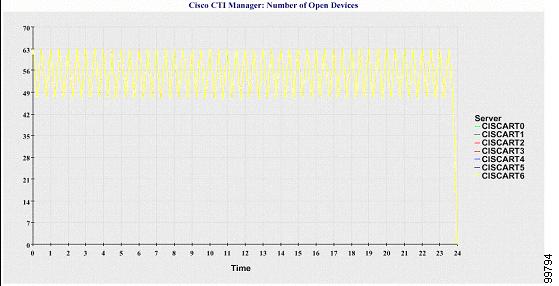
Cisco CTI Manager: Number of Open Devices
A line chart displays the number of CTI Open Devices for the CTI Manager (or for each CTI Manager in a Cisco Unified Communications Manager cluster configuration). Each line chart represents the data for the server (or on each server in a Cisco Unified Communications Manager cluster) on which service is activated. Each data value in the chart represents the average number of CTI open devices for a 15-minute duration. If no data exists, Reporter does not generate the chart. If no data exists for any one server in a Cisco Unified Communications Manager cluster configuration, Reporter does not generate the line that represents that server. The message "No data for Service Statistics report available" displays.
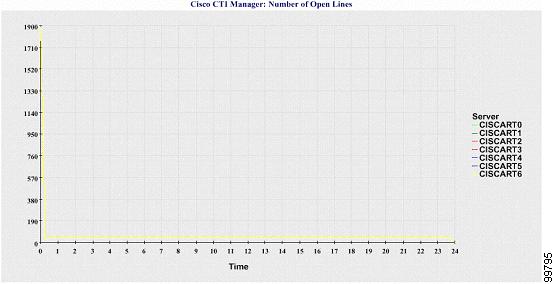
Cisco CTI Manager: Number of Open Lines
A line chart displays the number of CTI open lines for the CTI Manager (or per CTI Manager in a Cisco Unified Communications Manager cluster configuration). A line in the chart represents the data for the server (or one line for each server in a Cisco Unified Communications Manager cluster configuration) where the Cisco CTI Manager service is activated. Each data value in the chart represents the average number of CTI open lines for a 15-minute duration. If no data exists, Reporter does not generate the chart. If no data exists for any one server in a Cisco Unified Communications Manager cluster configuration, Reporter does not generate the line that represents that server.
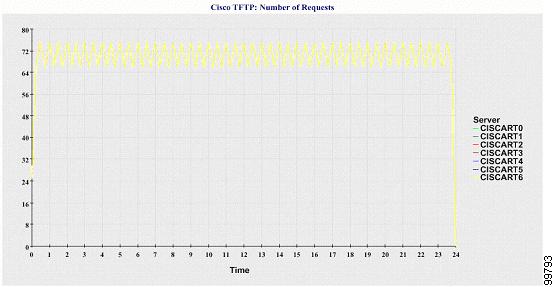
Cisco TFTP: Number of Requests
A line chart displays the number of Cisco TFTP requests for the TFTP server (or per TFTP server in a Cisco Unified Communications Manager cluster configuration). A line in the chart represents the data for the server (or one line for each server in a Cisco Unified Communications Manager cluster) where the Cisco TFTP service is activated. Each data value in the chart represents the average number of TFTP requests for a 15-minute duration. If no data exists, Reporter does not generate the chart. If no data exists for any one server in a Cisco Unified Communications Manager cluster configuration, Reporter does not generate the line that represents that server.
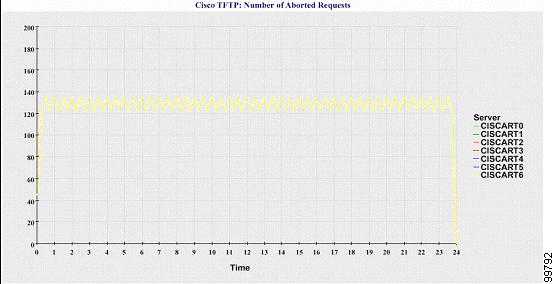
Cisco TFTP: Number of Aborted Requests
A line chart displays the number of Cisco TFTP requests that were aborted for the TFTP server (or per TFTP server in a Cisco Unified Communications Manager cluster configuration). A line in the chart represents the data for the server (or one line for each server in a Cisco Unified Communications Manager cluster) where the Cisco TFTP service is activated. Each data value in the chart represents the average of TFTP requests that were aborted for a 15-minute duration. If no data exists, Reporter does not generate the chart. If no data exists for any one server in a Cisco Unified Communications Manager cluster configuration, Reporter does not generate the line that represents that server.
The server (or each server in a Cisco Unified Communications Manager cluster) contains log files that match the filename pattern ServiceLog_mm_dd_yyyy_hh_mm.csv. The following information exists in the log file:
Call activities report
The Call Activities Report does not support IM and Presence Service and Cisco Unity Connection.
The Call Activities Report provides the following line charts:
- Cisco Unified Communications Manager Call Activity for a cluster
- H.323 Gateways Call Activity for the Cluster
- MGCP Gateways Call Activity for the Cluster
- MGCP Gateways
- Trunk Call Activity for the Cluster
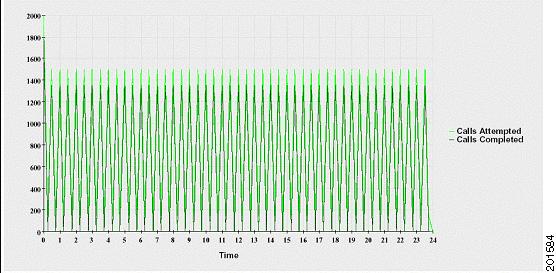
Cisco Unified Communications Manager Call Activity for the Cluster
A line chart displays the number of Cisco Unified Communications Manager calls that were attempted and calls that were completed. In a Cisco Unified Communications Manager cluster configuration, the line chart displays the number of calls attempted and completed for the entire cluster. The chart comprises two lines, one for the number of calls that were attempted and another for the number of calls that were completed. For a Cisco Unified Communications Manager cluster configuration, each line represents the cluster value, which is the sum of the values for all the servers in the cluster (for which data is available). Each data value in the chart represents the total number of calls that were attempted or calls that were completed for a 15-minute duration.
If no data exists for Cisco Unified Communications Manager calls that were completed, Reporter does not generate the line that represents data for the calls that were completed. If no data exists for Cisco Unified Communications Manager calls that were attempted, Reporter does not generate the line that represents data for the calls that were attempted. In a Cisco Unified Communications Manager cluster configuration, if no data exists for a server in the cluster, Reporter does not generate the line that represents calls attempted or completed on that server. If no data exists for Cisco Unified Communications Manager call activities at all, Reporter does not generate the chart. The message "No data for Call Activities report available" displays.
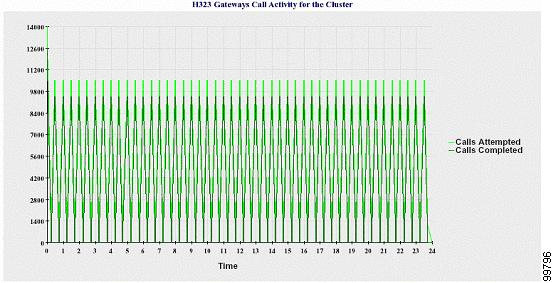
H.323 Gateways Call Activity for the Cluster
A line chart displays the number of calls that were attempted and calls that were completed for H.323 gateways. In a Cisco Unified Communications Manager cluster configuration, the line chart displays the number of calls attempted and completed for the entire cluster. The chart comprises two lines, one for the number of calls that were attempted and another for the number of calls that were completed. For a Cisco Unified Communications Manager cluster configuration, each line represents the cluster value, which equals the sum of the values for all the servers in the cluster (for which data is available). Each data value in the chart represents the total number of calls that were attempted or calls that were completed for a 15-minute duration. If no data exists for H.323 gateways calls that were completed, Reporter does not generate the line that represents data for calls that were completed. If no data exists for H.323 gateways calls that were attempted, Reporter does not generate the line that represents data for calls that were attempted. In a Cisco Unified Communications Manager cluster configuration, if no data exists for a server in the cluster, Reporter does not generate the line that represents calls attempted or completed on that server. If no data exists for H.323 gateways call activities at all, Reporter does not generate the chart.
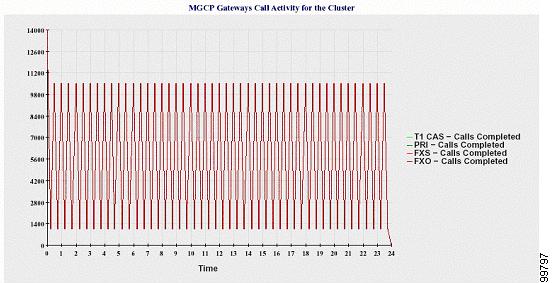
MGCP Gateways Call Activity for the Cluster
A line chart displays the number of calls that were completed in an hour for MGCP FXO, FXS, PRI, and T1CAS gateways. In a Cisco Unified Communications Manager cluster configuration, the chart displays the number of calls that were completed for the entire Cisco Unified Communications Manager cluster. The chart comprises four lines at the most, one for the number of calls that were completed for each of the gateway types (for which data is available). Each data value in the chart represents the total number of calls that were completed for a 15-minute duration. If no data exists for a gateway, Reporter does not generate the line that represents data for calls that were completed for a particular gateway. If no data exists for all gateways, Reporter does not generate the chart.
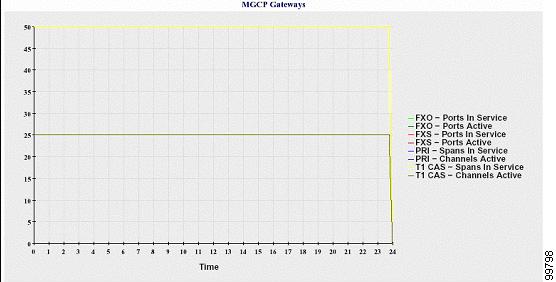
MGCP Gateways
A line chart displays the number of Ports In Service and Active Ports for MGCP FXO, FXS gateways and the number of Spans In Service or Channels Active for PRI, T1CAS gateways. For a Cisco Unified Communications Manager cluster configuration, the chart displays the data for the entire Cisco Unified Communications Manager cluster. The chart comprises eight lines, two lines each for the number of Ports In Service for MGCP FXO and FXS, and two lines each for the number of Active Ports for MGCP FXO and FXS. Four more lines for the number of Spans In Service and Channels Active for PRI and T1CAS gateways exist. For a Cisco Unified Communications Manager cluster configuration, each line represents the cluster value, which is the sum of the values for all servers in the cluster (for which data is available). Each data value in the chart represents the total Number of Ports In Service, Number of Active Ports, Spans In Service or Channels Active for a 15-minute duration. If no data exists for the number of Spans In Service or the Channels Active for a gateway (MGCP PRI, T1CAS) for all servers, Reporter does not generate the line that represents data for that particular gateway.
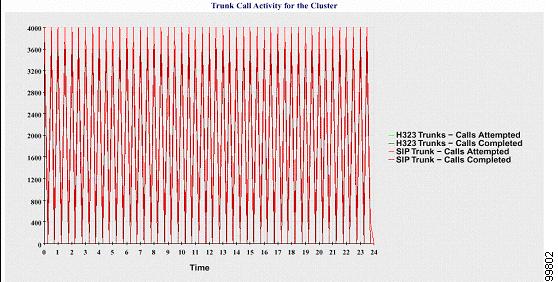
Trunk Call Activity for the Cluster
A line chart displays the number of calls that were completed and calls that were attempted in an hour for SIP trunk and H.323 trunk. For a Cisco Unified Communications Manager cluster configuration, the chart displays the number of calls that were completed and calls that were attempted for the entire Cisco Unified Communications Manager cluster. The chart comprises four lines, two for the number of calls that were completed for each SIP and H.323 trunk (for which data is available) and two for the number of calls that were attempted. For a Cisco Unified Communications Manager cluster configuration, each line represents the cluster value, which is the sum of the values for all nodes in the cluster (for which data is available). Each data value in the chart represents the total number of calls that were completed or number of calls that were attempted for a 15-minute duration. If no data exists for a trunk, Reporter does not generate the line that represents data for the calls that were completed or the calls that were attempted for that particular trunk. If no data exists for both trunk types, Reporter does not generate the chart.
The server (or each server in a Cisco Unified Communications Manager cluster configuration) contains log files that match the filename pattern CallLog_mm_dd_yyyy_hh_mm.csv. The following information exists in the log file:
- Calls that were attempted and calls that were completed for Cisco Unified Communications Manager (or for each server in a Cisco Unified Communications Manager cluster)
- Calls that were attempted and calls that were completed for the H.323 gateways (or for the gateways in each server in a Cisco Unified Communications Manager cluster)
- Calls that were completed for the MGCP FXO, FXS, PRI, and T1CAS gateways (or for the gateways in each server in a Cisco Unified Communications Manager cluster)
- Ports in service, active ports for MGCP FXO and FXS gateways and spans in service, channels active for PRI, and T1CAS gateways (in each server in a Cisco Unified Communications Manager cluster)
- Calls that were attempted and calls that were completed for H.323 trunks and SIP trunks
Alert summary report
The Alert Summary Report provides the details of alerts that are generated for the day.
Cluster-specific statistics are supported only by Cisco Unified Communications Manager and IM and Presence Service.
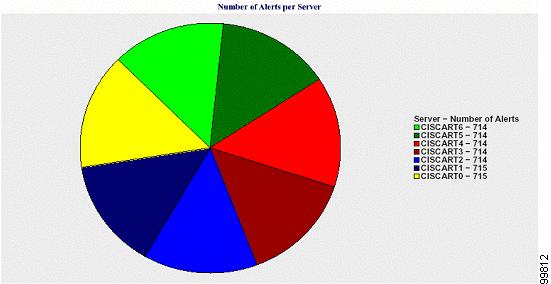
Number of Alerts per Server
A pie chart provides the number of alerts per node in a cluster. The chart displays the serverwide details of the alerts that are generated. Each sector of the pie chart represents the number of alerts generated for a particular server in the cluster. The chart includes as many number of sectors as there are servers (for which Reporter generates alerts in the day) in the cluster. If no data exists for a server, no sector in the chart represents that server. If no data exists for all servers, Reporter does not generate the chart. The message "No alerts were generated for the day" displays.
Cisco Unity Connection only: A pie chart provides the number of alerts for the server. The chart displays the serverwide details of the alerts that are generated. If no data exists for the server, Reporter does not generate the chart. The message “No alerts were generated for the day” displays.
The following chart shows a pie chart example that represents the number of alerts per server in a Cisco Unified Communications Manager cluster.
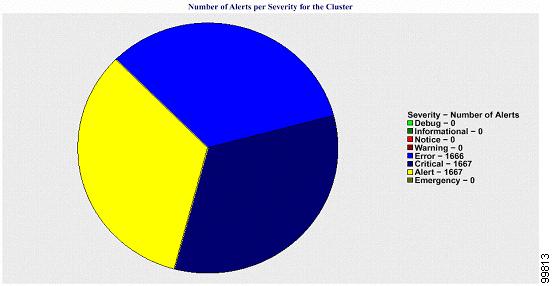
Number of Alerts per Severity for the Cluster
A pie chart displays the number of alerts per alert severity. The chart displays the severity details of the alerts that are generated. Each sector of the pie chart represents the number of alerts that are generated of a particular severity type. The chart provides as many number of sectors as there are severities (for which Reporter generates alerts in the day). If no data exists for a severity, no sector in the chart represents that severity. If no data exists, Reporter does not generate the chart.
The following chart shows a pie chart example that represents the number of alerts per severity for a Cisco Unified Communications Manager cluster.
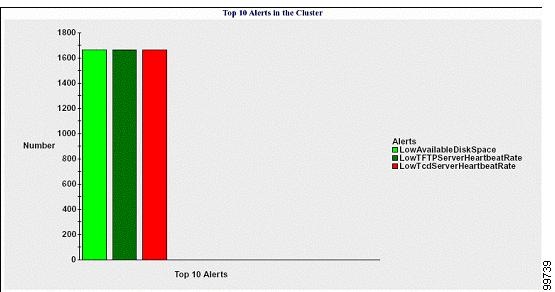
Top Ten Alerts in the Cluster
A bar chart displays the number of alerts of a particular alert type. The chart displays the details of the alerts that are generated on the basis of the alert type. Each bar represents the number of alerts for an alert type. The chart displays details only for the first ten alerts based on the highest number of alerts in descending order. If no data exists for a particular alert type, no bar represents that alert. If no data exists for any alert type, RTMT does not generate the chart.
The following chart shows a bar chart example that represents the top ten alerts in a Cisco Unified Communications Manager cluster.
The server (or each server in a cluster) contains log files that match the filename pattern AlertLog_mm_dd_yyyy_hh_mm.csv. The following information exists in the log file:
Performance Protection Report
The Performance Protection Report does not support IM and Presence Service and Cisco Unity Connection.
The Performance Protection Report provides a summary that comprises different charts that display the statistics for that particular report. Reporter generates reports once a day on the basis of logged information.
The Performance Protection Report provides trend analysis information on default monitoring objects for the last seven that allows you to track information about Cisco Intercompany Media Engine. The report includes the Cisco IME Client Call Activity chart that shows the total calls and fallback call ratio for the Cisco IME client.
The Performance Protection report comprises the following charts:
- Cisco Unified Communications Manager Call Activity
- Number of registered phones and MGCP gateways
- System Resource Utilization
- Device and Dial Plan Quantities
Cisco Unified Communications Manager Call Activity
A line chart displays the hourly rate of increase or decrease for number of calls that were attempted and calls that were completed as the number of active calls. For a Cisco Unified Communications Manager cluster configuration, the data is charted for each server in the cluster. The chart comprises three lines, one for the number of calls that were attempted, one for the calls that were completed, and one for the active calls. If no data exists for call activity, Reporter does not generate the chart.
Number of registered phones and MGCP gateways
A line chart displays the number of registered phones and MGCP gateways. For a Cisco Unified Communications Manager cluster configuration, the chart displays the data for each server in the cluster.The chart comprises two lines, one for the number of registered phones and another for the number of MGCP gateways. If no data exists for phones or MGCP gateways, Reporter does not generate the chart.
System Resource Utilization
A line chart displays the CPU load percentage and the percentage of memory that is used (in bytes) for the server (or for the whole cluster in a Cisco Unified Communications Manager cluster configuration). The chart comprises two lines, one for the CPU load and one for the memory usage. In a Cisco Unified Communications Manager cluster, each line represents the cluster value, which is the average of the values for all the servers in the cluster (for which data is available). If no data exists for phones or MGCP gateways, Reporter does not generate the chart.
Device and Dial Plan Quantities
Two tables display information from the Cisco Unified Communications Manager database about the numbers of devices and number of dial plan components. The device table shows the number of IP phones, Cisco Unity Connection ports, H.323 clients, H.323 gateways, MGCP gateways, MOH resources, and MTP resources. The dial plan table shows the number of directory numbers and lines, route patterns, and translation patterns.
Set up serviceability reports archive overview
The following steps provide information for configuring the serviceability report archive feature.
Set up Serviceability Reports Archive
The Cisco Serviceability Reporter service generates daily reports in Cisco Unified Serviceability. Each report provides a summary that comprises different charts that display the statistics for that particular report. Reporter generates reports once a day on the basis of logged information.
This section describes how to use the Serviceability Reports Archive window.
Activate the Cisco Serviceability Reporter service, which is CPU intensive. After you activate the service, report generation may take up to 24 hours.
Cisco Unified Communications Manager only: Cisco recommends that you activate the service on a non-call-processing server.
Access to Serviceability Reports Archive
Activate Serviceability Reports Archive
| Step 1 | Select . |
| Step 2 | Select the required server from the Server list box, and then select Go. |
| Step 3 | Navigate to the Performance and Monitoring services pane. |
| Step 4 | Check the Cisco Serviceability Reporter service checkbox, and then select Save. |
| Step 5 | Select . |
| Step 6 | Select the required server from the Server list box, and then select Go. |
| Step 7 | Navigate to the Performance and Monitoring services pane and locate the Cisco Serviceability Reporter. |
| Step 8 | Verify that the status of the Cisco Serviceability Reporter is Started and Activated. If the Cisco Serviceability Reporter is not running, select the Cisco Serviceability Reporter and select Start. |
What to Do Next
If you opened Cisco Unified IM and Presence Serviceability by entering the server name in the browser, you must sign in to Cisco Unified IM and Presence Serviceability before you can view the report.
The Cisco Unified IM and Presence Serviceability service generates reports only on the first node, even if you turn on the service on other nodes.
Access Serviceability Reports Archive
Activate the Cisco Serviceability Reporter service. After you activate the service, report generation may take up to 24 hours.
| Step 1 | Select . | ||
| Step 2 | Select the month and year for which you want to display reports in the Month-Year section. | ||
| Step 3 | Select the link that corresponds to the day for which reports were generated to view the required report. | ||
| Step 4 |
Select the link of the report that you want to view to view a particular PDF report. The section in the Trace Filter Settings area that relates to devices is not relevant to IM and Presence.
|
CDR Repository Manager
This section does not apply to IM and Presence Service.
Use the CDR Management Configuration window to set the amount of disk space to allocate to call detail record (CDR) and call management record (CMR) files, configure the number of days to preserve files before deletion, and configure up to three billing application server destinations for CDRs. The CDR Repository Manager service repeatedly attempts to deliver CDR and CMR files to the billing servers that you configure in the CDR Management Configuration window until it delivers the files successfully, until you change or delete the billing application server on the CDR Management Configuration window, or until the files fall outside the preservation window and are deleted.
Note |
To access the Enterprise Parameters Configuration window, open Cisco Unified Communications Manager Administration and choose . The CDR File Time Interval parameter specifies the time interval for collecting CDR data. For example, if this value is set to 1, each file will contain 1 minute of CDR data (CDRs and CMRs, if enabled). The external billing server and CAR database will not receive the data in each file until the interval has expired, so consider how quickly you want access to the CDR data when you decide what interval to set for this parameter. For example, setting this parameter to 60 means that each file will contain 60 minutes worth of data, but that data will not be available until the 60-minute period has elapsed, and the records are written to the CAR database. and the CDR files are sent to the configured billing servers. The default value equals 1. The minimum value specifies 1, and the maximum value specifies 1440. The unit of measure for this required field represents a minute. |
Both the CDR Agent and the CDR Repository Manager process files with an interval that is independent of the CDR File Time Interval. The CDR Repository Manager sends all existing CDR files to the billing application servers, sleeps for 6 seconds before checking the new files to send, and continues that 6-second interval. If the destination (the external billing application servers) does not respond, the system attempts the process again by using a doubled length of the sleep interval (12 seconds). Each delivery failure results in double the sleep time (6, 12, 24, 48,and so on, seconds) until 2 minutes occurs, then stays at 2-minute intervals until successful delivery occurs. After successful delivery, the 6-second interval automatically resumes.
Users cannot configure the 6-second processing time, with the sleep time interval doubling in case of failure. Users can configure only the CDR File Time Interval enterprise parameter. No alert gets sent after the first file delivery failure. By default, the system generates the CDRFileDeliveryFailed alert after the second delivery failure of the Cisco CDR Repository Manager service to deliver files to any billing application server. You can configure the alert to send you an e-mail or to page you. For information on configuring alerts, see the "Working with Alerts" chapter in the Cisco Unified Real-Time Monitoring Tool Administration Guide.
The system generates the CDRFileDeliveryFailureContinues syslog alarm upon subsequent failures to deliver the files to the billing application servers.
The CDR Agent behaves in almost the same manner. First, it sends all the existing CDR files to the publisher. If no additional files to send exist, the CDR Agent sleeps for 6 seconds before checking for new files. Each delivery failure results in the immediate change of the sleep interval to 1 minute, then says at 1-minute intervals until successful delivery. After the first successful delivery of files, the 6-second interval resumes.
The system sends no alert after the first file delivery failure by the CDR Agent. By default, the system generates the CDRAgentSendFileFailed alert after the second delivery failure of the CDR Agent. You can configure the alert to send you an email or to page you. For information on configuring alerts, see the "Working with Alerts" chapter in the Cisco Unified Real-Time Monitoring Tool Administration Guide
The system generates the CDRAgentSendFileFailedContinues syslog alarm upon subsequent failures to deliver the files.
If you need to start or restart the file transfer timer, you can restart the Cisco CDR Repository Manager or CDR Agent process by going to the Cisco Unified Serviceability window and selecting .
When you enable the file deletion based on high water mark parameter, the CDR repository manager service monitors the amount of disk space that CDR and CMR files use. If disk usage exceeds the high water mark that you configure, the system purges the CDR and CMR files that have been successfully delivered to all destinations and loaded into the CAR database (if CAR is activated) until the disk space reaches the low water mark or the system deletes all successfully delivered files. If disk usage still exceeds the high water mark after the system deletes all successfully delivered files, it does not delete any more files, unless the disk usage still exceeds the disk allocation that you configure. If the disk usage still exceeds the disk allocation that you configure, the system purges files beginning with the oldest, regardless of whether the files fall within the preservation window or have been successfully delivered, until the disk usage falls below the high water mark.
Note |
Regardless of whether you enable the deletion of files based on the high water mark parameter, if disk usage exceeds the disk allocation that you configure, the CDR repository manager service deletes CDR and CMR files, beginning with the oldest files, until disk utilization falls below the high water mark. |
The Cisco Log Partition Monitoring Tool service monitors the disk usage of CDR and CMR flat files that have not been delivered to the CDR repository manager.
Cisco Unified Communications Manager only: If the disk usage of the log partition on a server exceeds the configured limit and the service has deleted all other log and trace files, the log partition monitor service deletes CDR/CMR files on the subsequent nodes that have not been delivered to the CDR repository manager.
For more information about log partition monitoring, see the Cisco Unified Real-Time Monitoring Tool Administration Guide.
- Set up general parameters
- General parameter settings
- Set up application billing servers
- Application billing server parameter settings
- Delete application billing servers
Set up general parameters
To set disk utilization and file preservation parameters for CDRs, perform the following procedure.
| Step 1 |
Choose . The CDR Management window displays. |
||
| Step 2 | Click the CDR Manager general parameter value that you want to change. | ||
| Step 3 | Enter the appropriate CDR Repository Manager general parameter settings. | ||
| Step 4 |
Click Update.
|
General parameter settings
| Field | Description | ||
|---|---|---|---|
Choose the number of megabytes that you want to allocate to CDR and CMR flat file storage. The default disk allocation and range vary depending on the size of the server hard drive.
|
|||
This field specifies the maximum percentage of the allocated disk space for CDR and CMR files. For example, if you choose 2000 megabytes from the Disk Allocation field and 80% from the High Water Mark (%) field, the high water mark equals 1600 megabytes. In addition to the high water mark percentage, the number of CDRs in the CAR database cannot exceed two million records for a Cisco Unified Communications Manager server. When the disk usage exceeds the percentage that you specify, or the total number of CDRs is exceeded, and the Disable CDR/CMR Files Deletion Based on HWM check box is unchecked, the system automatically purges all successfully processed CDR and CMR files (those delivered to billing servers and loaded to CAR) beginning with the oldest files to reduce disk usage to the amount that you specify in the Low Water Mark (%) drop-down list box. If the disk usage still exceeds the low water mark or high water mark, the system does not delete any undelivered or unloaded files, unless the disk usage exceeds the disk allocation. If you check the Disable CDR/CMR Files Deletion Based on HWM check box, the system does not delete CDRs and CMRs based on the percentage that you specify in this field.
|
|||
This field specifies the percentage of disk space that is allocated to CDR and CMR files that is always available for use. For example, if you choose 2000 megabytes from the Disk Allocation field and 40% from the Low Water Mark (%) field, the low water mark equals 800 megabytes. |
|||
Choose the number of days that you want to retain CDR and CMR files. The CDR Repository Manager deletes files that fall outside the preservation window.
|
|||
If you do not want to delete CDRs and CMRs even if disk usage exceeds the percentage that you specify in the High Water Mark (%) field, check this check box. By default, this check box remains unchecked, so the system deletes CDRs and CMRs if disk usage exceeds the high water mark. |
|||
This field lists the hostname of the CDR repository manager server. |
|||
This field lists the IP address of the CDR repository manager server. |
Set up application billing servers
Use the following procedure to configure application billing servers to which you want to send CDRs. You can configure up to three billing servers.
| Step 1 |
Choose . The CDR Management Configuration window displays. |
| Step 2 | Perform one of the following tasks: |
| Step 3 | Enter the application billing server parameter settings. |
| Step 4 | Click Add or Update. |
Application billing server parameter settings
| Field | Description | ||
|---|---|---|---|
Enter the hostname or IP address of the application billing server to which you want to send CDRs. If you change the value in this field, a prompt asks whether you want to send the undelivered files to the new destination. |
|||
Choose the protocol, either FTP or SFTP, that you want to use to send the CDR files to the configured billing servers. |
|||
Enter the directory path on the application billing server to which you want to send the CDRs. You should end the path that you specify with a "/" or "\", depending on the operating system that is running on the application billing server.
|
|||
Enter the password that is used to access the application billing server. |
|||
When you check the Resend on Failure box, this option informs CDRM to send outdated CDR and CMR files to the billing server after the FTP or SFTP connection is restored. When the box is checked, the Resend on Failure flag is set to True. When the box is not checked, the Resend on Failure flag is set to False. There are several different scenarios that can occur. When the billing server Resend on Failure flag is set to True, all CDR files get moved to the billing server. When the Resend On Failure flag is set to False, CDR files that get generated during shutdown of the billing server get moved to the processed folder, but do not get moved to the billing server. When the Resend on Failure flag gets set to True at the beginning, and then gets changed several times, the result is that the CDR files get moved to the billing server whenever the Resend on Failure box gets checked. |
|||
Click on the Reset button to generate new keys and reset the connection to the SFTP server. |
Delete application billing servers
Use the following procedure to delete an application billing server.
| Step 1 |
Choose . The CDR Management Configuration window displays. |
||
| Step 2 |
Check the check box next to the application billing server that you want to delete and click Delete Selected. A message displays that indicates that if you delete this server, any CDR or CMR files that have not been sent to this server will not be delivered to this server and will be treated as successfully delivered files.
|
||
| Step 3 | To complete the deletion, click OK. |
Audit logs
With audit logging, configuration changes to the system get logged in separate log files for auditing.
Audit logging
With audit logging, configuration changes to the system get logged in separate log files for auditing. The Cisco Audit Event Service, which displays under Control Center - Network Services in the serviceability GUI, monitors and logs any configuration changes to the system that are made by a user or as a result of the user action.
You access the Audit Log Configuration window in the serviceability GUI to configure the settings for the audit logs.
Audit logging contains the following parts:
-
Audit logging framework - The framework comprises an API that uses an alarm library to write audit events into audit logs. An alarm catalog that is defined as GenericAlarmCatalog.xml applies for these alarms. Different system components provide their own logging. The following example displays an API that a Cisco Unified Communications Manager component can use to send an alarm:
User ID: CCMAdministratorClient IP Address: 172.19.240.207
Severity: 3
EventType: ServiceStatusUpdated
ResourceAccessed: CCMService
EventStatus: Successful
Description: CallManager Service status is stopped
-
Audit event logging - An audit event represents any event that is required to be logged. The following example displays a sample audit event:
CCM_TOMCAT-GENERIC-3-AuditEventGenerated: Audit Event Generated UserID:CCMAdministrator Client IP Address:172.19.240.207 Severity:3 EventType:ServiceStatusUpdated ResourceAccessed: CCMService EventStatus:Successful Description: Call Manager Service status is stopped App ID:Cisco Tomcat Cluster ID:StandAloneCluster Node ID:sa-cm1-3
Tip |
Be aware that audit event logging is centralized and enabled by default. An alarm monitor called Syslog Audit writes the logs. By default, the logs are configured to rotate. If the AuditLogAlarmMonitor cannot write an audit event, the AuditLogAlarmMonitor logs this failure as a critical error in the syslog file. The Alert Manager reports this error as part of a SeverityMatchFound alert. The actual operation continues even if the event logging fails. All audit logs get collected, viewed, and deleted from Trace and Log Central in the Cisco Unified Real-Time Monitoring Tool. |
Cisco Unified Serviceability events logging
Cisco Unified Serviceability logs the following events:
- Activation, deactivation, start, or stop of a service.
- Changes in trace configurations and alarm configurations.
- Changes in SNMP configurations.
- Changes in CDR management. (Cisco Unified Communications Manager only)
- Review of any report in the Serviceability Reports Archive. This log gets viewed on the reporter node. (Cisco Unified Communications Manager only)
Cisco Unified Real-Time Monitoring Tool events logging
Cisco Unified Real-Time Monitoring Tool logs the following events with an audit event alarm:
Cisco Unified Communications Manager CDR Analysis and Reporting events logging
Cisco Unified Communications Manager CDR Analysis and Reporting (CAR) creates audit logs for these events:
- Loader scheduling
- Daily, weekly, and monthly reports scheduling
- Mail parameters configuration
- Dial plan configuration
- Gateway configuration
- System preferences configuration
- Autopurge configuration
- Rating engine configurations for duration, time of day, and voice quality
- QoS configurations
- Automatic generation/alert of pregenerated reports configurations.
- Notification limits configuration
Cisco Unified Communications Manager Administration events logging
The following events get logged for various components of Cisco Unified Communications Manager Administration:
- User logging (user logins and user logouts)
- User role membership updates (user added, user deleted, user role updated)
- Role updates (new roles added, deleted, or updated)
- Device updates (phones and gateways)
- Server configuration updates (changes to alarm or trace configurations, service parameters, enterprise parameters, IP addresses, hostnames, Ethernet settings, and Cisco Unified Communications Manager server additions or deletions)
Cisco Unified Communications Manager User Options logging
User logging (user login and user logout) events are logged for Cisco Unified Communications Manager User Options.
Command-Line Interface events logging
All commands issued via the command-line interface are logged (for both Cisco Unified Communications Manager and Cisco Unity Connection).
Cisco Unity Connection Administration events logging
Cisco Unity Connection Administration logs the following events:
- User logging (user logins and user logouts)
- All configuration changes, including but not limited to users, contacts, call management objects, networking, system settings, and telephony
- Task management (enabling or disabling a task)
- Bulk Administration Tool (bulk creates, bulk deletes)
- Custom Keypad Map (map updates)
Cisco Personal Communications Assistant (Cisco PCA)
The Cisco Personal Communications Assistant client logs the following events:
Cisco Unity Connection Serviceability events logging
Cisco Unity Connection Serviceability logs the following events:
Cisco Unity Connection Clients that Use the Representational State Transfer APIs events logging
Cisco Unity Connection clients that use the Representational State Transfer (REST) APIs log the following events:
Cisco Unified IM and Presence Serviceability events logging
Cisco Unified IM and Presence Real-Time Monitoring Tool events logging
Cisco Unified Communications Manager IM and Presence Administration events logging
- Administrator logging (logins and logouts on IM and Presence interfaces such as Administration, OS Administration, Disaster Recovery System, and Reporting)
- User role membership updates (user added, user deleted, user role updated)
- Role updates (new roles added, deleted, or updated)
- Device updates (phones and gateways)
- Server configuration updates (changes to alarm or trace configurations, service parameters, enterprise parameters, IP addresses, hostnames, Ethernet settings, and IM and Presence server additions or deletions)
IM and Presence Application events logging
Command Line Interface events logging
All commands issued through the command line interface are logged.
System audit logs
System audit logs track activities such as the creation, modification, or deletion of Linux OS users, log tampering, and any changes to file or directory permissions. This type of audit log is disabled by default due to the high volume of data gathered. To enable this function, you must manually enable utils auditd using the CLI. After you have enabled the system audit log feature, you can collect, view, download, or delete selected logs through Trace & Log Central from the Real-Time Monitoring Tool. System audit logs take on the format of vos-audit.log.
For information about how to enable this feature, see the Command Line Interface Reference Guide for Cisco Unified Communications Solutions. For information about how to access collected logs from the Real-Time Monitoring Tool, see the Cisco Unified Real-Time Monitoring Tool Administration Guide .
Application audit logs
Database audit logs
Database Audit Logs track all activities associated with access to the Informix Database, such as logins.
Set up audit log
To configure the audit log using the serviceability GUI, perform the following procedure.
Note |
The Application Audit Logs (Linux auditd) can be enabled or disabled only through the CLI. Other than the collection of vos-audit.log through the Real-Time Monitoring Tool, you can not change any settings for this type of audit log. |
| Step 1 |
Select . The Audit Log Configuration window displays. |
||
| Step 2 | Configure the audit log settings. | ||
| Step 3 |
Click Save.
|
Audit log configuration settings
Before You Begin
Be aware that only a user with an audit role can change the audit log settings. By default, for Cisco Unified Communications Manager, the CCMAdministrator possesses the audit role after fresh installs and upgrades. The CCMAdministrator can assign any user that has auditing privileges to the Standard Audit Users group in the User Group Configuration window in Cisco Unified Communications Manager Administration. If you want to do so, you can then remove CCMAdministrator from the Standard Audit Users group.
For IM and Presence Service, the administrator possesses the audit role after fresh installs and upgrades, and can assign any user that has auditing privileges to the Standard Audit Users group.
For Cisco Unity Connection, the application administration account that was created during installation has the Audit Administrator role and can assign other administrative users to the role. You can also remove the Audit Administrator role from this account.
The Standard Audit Log Configuration role is to provide the ability to delete audit logs and to read/update access to Cisco Unified Real-Time Monitoring Tool, IM and Presence Real-Time Monitoring Tool, Trace Collection Tool, RTMT Alert Configuration, Control Center - Network Services in the serviceability GUI, RTMT Profile Saving, Audit Configuration in the serviceability GUI, and a resource that is called Audit Traces.
The Standard Audit Log Configuration role is to provide the ability to delete audit logs and to read/update access to Cisco Unified Real-Time Monitoring Tool, Trace Collection Tool, RTMT Alert Configuration, Control Center - Network Services in Cisco Unified Serviceability, RTMT Profile Saving, Audit Configuration in Cisco Unified Serviceability, and a resource that is called Audit Traces.
The Audit Administrator role in Cisco Unity Connection provides the ability to view, download and delete audit logs in Cisco Unified Real-Time Monitoring Tool.
For information on roles, users, and user groups in Cisco Unified Communications Manager, refer to the Cisco Unified Communications Manager Administration Guide.
For information on roles and users in Cisco Unity Connection, refer to the User Moves, Adds, and Changes Guide for Cisco Unity Connection.
For information on roles, users, and user groups in IM and Presence, refer to the Deployment Guide for IM and Presence Service on Cisco Unified Communications Manager.
| Choose the server (node) where you want to configure audit logs; then, click Go. |
|||||
| If you want to apply the audit log configuration to all nodes in the cluster, check the Apply to all Nodes box. |
|||||
| When you check this check box, an audit log gets created for the application audit log. For Cisco Unified Communications Manager, the application audit log supports configuration updates for Cisco Unified Communications Manager GUIs, such as Cisco Unified Communications Manager Administration, Cisco Unified Real-Time Monitoring Tool, Cisco Unified Communications Manager CDR Analysis and Reporting, and Cisco Unified Serviceability. For IM and Presence Service, the application audit log supports configuration updates for IM and Presence GUIs, such as Cisco Unified Communications Manager IM and Presence Administration, Cisco Unified IM and Presence Real-Time Monitoring Tool, and Cisco Unified IM and Presence Serviceability. For Cisco Unity Connection, the application audit log supports configuration updates for Cisco Unity Connection graphical user interfaces, including Cisco Unity Connection Administration, Cisco Unity Connection Serviceability, Cisco Personal Communications Assistant, and clients that use the Connection REST APIs. This setting displays as enabled by default.
|
|||||
| The Log Partition Monitor (LPM) looks at the Enable Purging option to determine whether it needs to purge audit logs. When you check this check box, LPM purges all the audit log files in RTMT whenever the common partition disk usage goes above the high water mark; however, you can disable purging by unchecking the check box. If purging is disabled, the number of audit logs continues to increase until the disk is full. This action could cause a disruption of the system. A message that describes the risk of disabling the purge displays when you uncheck the Enable Purging check box. Be aware that this option is available for audit logs in an active partition. If the audit logs reside in an inactive partition, the audit logs get purged when the disk usage goes above the high water mark. You can access the audit logs by choosing in RTMT.
|
|||||
| The system reads this option to determine whether it needs to rotate the audit log files or it needs to continue to create new files. The maximum number of files cannot exceed 5000. When the Enable Rotation check box is checked, the system begins to overwrite the oldest audit log files after the maximum number of files gets reached.
|
|||||
| Server Name |
Enter the name or IP address of the remote syslog server that you want to use to accept syslog messages. If server name is not specified, Cisco Unified IM and Presence Serviceability does not send the syslog messages. Do not specify a Cisco Unified Communications Manager node as the destination because the Cisco Unified Communications Manager node does not accept syslog messages from another server. This applies to IM and Presence Service only. |
||||
| Remote Syslog Audit Event Level |
Select the desired syslog messages severity for the remote syslog server. All the syslog messages with selected or higher severity level are sent to the remote syslog. This applies to IM and Presence Service only. |
||||
| Enter the maximum number of files that you want to include in the log. The default setting specifies 250. The maximum number specifies 5000. |
|||||
| Enter the maximum file size for the audit log. The file size value must remain between 1 MB and 10 MB. You must specify a number between 1 and 10. |
|||||
| When you enable this check box, an audit log gets created for the Cisco Unified Communications Manager and Cisco Unity Connection databases. Use this setting in conjunction with the Debug Audit Level setting, which allows you create a log for certain aspects of the database. |
|||||
| This setting allows you to choose which aspects of the database you want to audit in the log. From the drop-down list box, choose one of the following options. Be aware that each audit log filter level is cumulative.
|
|||||
| The system reads this option to determine whether it needs to rotate the database audit log files or it needs to continue to create new files. When the Audit Enable Rotation option is checked, the system begins to overwrite the oldest audit log files after the maximum number of files gets reached. When this setting is unchecked, audit log ignores the Maximum No. of Files setting. |
|||||
| Enter the maximum number of files that you want to include in the log. Ensure that the value that you enter for the Maximum No. of Files setting is greater than the value that you enter for the No. of Files Deleted on Log Rotation setting. |
|||||
| Enter the maximum number of files that the system can delete when database audit log rotation occurs. The minimum that you can enter in this field is 1. The maximum value is 2 numbers less than the value that you enter for the Max No. of Files setting; for example, if you enter 40 in the Maximum No. of Files field, the highest number that you can enter in the No. of Files Deleted on Log Rotation field is 38. |
|||||
 Caution |
When enabled, database logging can generate large amounts of data in a short period, particularly if the debug audit level is set to Database Updates or Database Reads. This can result in a significant performance impact during heavy usage periods. In general, we recommend that you keep database logging disabled. If you do need to enable logging to track changes in the database, we recommend that you do so only for short periods of time, by using the Database Updates level. Similarly, administrative logging does impact on the overall performance of the web user interface, especially when polling database entries (for example, pulling up 250 devices from the database). |
Locations
This section does not apply to IM and Presence Service.
This section explains the Locations feature (Tools > Locations) in Cisco Unified Serviceability. This feature enables an administrator to view details of the configured locations in an enterprise, understand the link and intralocation discrepancies, view effective path between the two locations, and identify disconnected groups of locations.
Locations Topology
Cisco Unified Serviceability Locations Topology provides details of configured locations in your enterprise. Location Topology refers to a modeled topology representing the flow of media in a network.
The following are some commonly used terms and their definitions:
Assertion
An assertion refers to the location and link bandwidth and weight values configured in a cluster. Asserted values may be replicated to another cluster.
Discrepancy
A discrepancy occurs if there is a difference in the location bandwidth values or link bandwidth and weight values asserted across various clusters.
Effective Path
An Effective Path is a sequence of intermediate locations connecting two end locations, with weight assigned to each link between each adjacent pair of locations. The Effective Path, as determined by the least cumulative weight, is the only path used for bandwidth deductions between any two end locations.
View locations topology
This section describes how to search and view location topology in Cisco Unified Serviceability.
| Step 1 |
In Cisco Unified Serviceability, choose . The Locations Topology window appears. |
||||
| Step 2 | From the Find Locations Where Location Name drop-down box, choose the filter criteria. | ||||
| Step 3 |
Enter the search string in the Find Locations Where Location Name field and then click Find.
The list of locations is displayed for the chosen filter criteria. |
||||
| Step 4 |
In the list, click to expand any location to view its intralocation details and link details. The intralocation details include audio, video, and immersive bandwidth whereas the link details contain the details of the link connecting two locations such as its weight, audio, video and immersive bandwidth.
|
||||
| Step 5 |
To view the assertion details of any location, click View Assertion Details link at the bottom of the expanded details section. The Assertion Details window appears. |
||||
| Step 6 |
To return to the Locations Topology window, click Close.
For more information about the topology data in XML format, see the Cisco Unified Communications Manager XML Developers Guide. |
View assertion details
- Intralocation configuration assertions—Includes the intralocation assertion details such as Asserted by Cluster, Audio, Video and Immersive bandwidth. Asserted by Cluster column lists the names of all the clusters that assert a particular location.
- Link assertions—Includes the assertion details of the link that connects two locations, such as Asserted by Cluster, Weight, Audio, Video, and Immersive bandwidth.
| Step 1 | Select . |
| Step 2 | Click the View Assertion Details link in the Locations Topology window. |
Locations discrepancy
The Locations Discrepancy screen displays the conflicts in assertions for various locations configurations.
The following details are displayed:
View locations discrepancy
| Step 1 |
In Cisco Unified Serviceability, choose . The Location Discrepancy window appears. |
||
| Step 2 |
The list of link configuration discrepancies and intralocation configuration discrepancies is displayed.
If no discrepancies are found, the following status message is displayed: No discrepancies found |
||
| Step 3 |
In the list, click on a link name or location name to expand and view its configuration details as asserted by different clusters, in a tabular view. The bottom row displays the effective values considered for audio, video, and immersive bandwidth pools and weight (in the case of links). The values that do not match with the effective values are highlighted in red.
|
Effective path
The Cisco Unified Serviceability Effective Path screen provides details of the effective path that media takes for audio, video, or immersive calls made between two locations provided by the administrator. This screen displays the Available bandwidth and the Configured bandwidth across each link and intralocation in the effective path. An administrator can use this report to determine bandwidth availability across a link and intra-location when there are bandwidth issues in making calls. Cisco Unified Serviceability Effective Path can also be used to troubleshoot bandwidth issues in making calls and find out where the bandwidth availability is low.
The Cisco Unified Serviceability Effective Path screen displays the following details between two selected locations:
- Quick Path Overview —Displays the cumulative weight and the least of the configured and available Audio, Video, and Immersive Bandwidth values across the effective path.
- Detailed Path View—Displays the weight and bandwidth values (Available and Configured) for Audio, Video, and Immersive calls for locations and links constituting the effective path, in a tabular view ordered from source location at top to the destination location at bottom.
Note |
The Available bandwidth values displayed in the report are the value at the time of viewing the Effective Path. You can view the real-time values in the Cisco Unified Real-Time Monitoring Tool. |
View effective path
| Step 1 |
In Cisco Unified Serviceability, choose . The Effective Path window appears. |
| Step 2 |
From the Location drop-down boxes, select any two locations between which effective path is required and then click Find. Alternatively, start typing the location name in the input box to shortlist the matching location names and then click Find. The effective path details, which include the Quick Path Overview and Detailed Path View sections, are displayed. If there is no path between the two selected locations, the following status message is displayed: No path exists between <From_Location> and <To_Location>. |
Disconnected groups
Cisco Unified Serviceability Disconnected Groups screen enables an administrator to view and analyze any disconnect between the locations that are part of the topology. It displays a list of disconnected groups of locations, which helps an administrator understand which locations need to be connected.
The disconnect in the topology can occur when a link between two locations is not configured or a shared location name is misspelled.
Note |
The Disconnected Groups screen displays and compares only disconnected groups of locations. For information on connecting locations, see topics related to location configuration in Cisco Unified Communications Manager Administration Guide. |
View disconnected groups
This section describes how to view disconnected groups in Cisco Unified Serviceability.
|
The Disconnected Groups screen appears. |
| Setting | Description | ||
|---|---|---|---|
List of Disconnected Groups |
|||
Select |
Check this box to select a disconnected group to be compared with another disconnected group.
|
||
Group ID |
Auto-generated unique identification number of the selected group is displayed here. |
||
Description |
The names of the first and last location (as per the alphabetical order) in the group are displayed here.
|
||
No of Locations |
The number of locations in a group is displayed here. |
||
Compare Selected Groups |
Click this button to display and compare the selected groups. After you click this button, the details that pertain to the selected groups are displayed. For every group you select, names of the locations that are part of that group and the corresponding clusters that assert a location are displayed. See Comparison view for the selected groups below. |
||
Comparison view for the selected groups |
|||
Location Name |
The names of all the locations that are part of a group are listed in this column. |
||
Asserted by Cluster |
The names of all the clusters that assert a particular location are listed in this column. |
||
If there are no disconnected groups of locations, the following status message is displayed:
No disconnected groups of locations found
Note |
The List of Disconnected Groups can be sorted by any column. By default, the groups are sorted by the No. of Locations column. |
 Feedback