- Home
- /
- Article

 In this article
New and Changed Information
This table covers new features or functionality, changes to existing content, and any major errors that were fixed in the Deployment Guide.
For information about Webex Video Mesh node software updates, see the https://help.webex.com/en-us/article/jgobq2/Webex-Video-Mesh-release-notes.
|
Date |
Change |
|---|---|
|
February 09, 2024 |
|
|
August 31, 2023 |
|
|
July 31, 2023 |
|
|
July 28, 2023 |
|
|
June 15, 2023 |
|
| May 16, 2023 |
|
|
March 27, 2023 |
|
|
March 02, 2023 |
|
|
July 7, 2022 |
|
|
June 30, 2022 |
Added information on the new bulk provisioning scripts at https://github.com/CiscoDevNet/webex-video-mesh-node-provisioning. |
|
June 14, 2022 |
Changed steps to exchange certificate chains to include ECDSA certificates in Exchange Certificate Chains Between Unified CM and Video Mesh Nodes |
|
May 18, 2022 |
Changed the download site for the Reflector Tool to https://github.com/CiscoDevNet/webex-video-mesh-reflector-client. |
|
April 29,2022 |
Added information on the new feature in Keep your media on Video Mesh for all external Webex meetings. |
|
March 25, 2022 |
Updates to port usage in Ports and Protocols for Management. |
|
Decemeber 10, 2021 |
Added CMS 2000 and noted upgrade issue for older CMS 1000s upgrading to ESXi 7 in System and Platform Requirements for Video Mesh Node Software. |
|
August 30, 2021 |
Added information on verifying that Webex has the correct source country for your deployment in Verify That the Source Country Is Correct. |
|
August 27, 2021 |
Added note on analytics reports visibility in Support and Limitations for Private Meetings. |
|
August 13, 2021 |
Added information on the new Private Meetings feature in:
|
|
July 22, 2021 |
Added information on how to verify that the system has the correct source location for calls. Correct source locations aid in efficient routing. See Verify That the Source Country Is Correct. |
|
June 25, 2021 |
Noted that the Full Featured Webex Experience feature of the Webex App is incompatible with Video Mesh in Clients and Devices That Use Video Mesh Node. |
|
May 7, 2021 |
Corrected the recommended cluster size to 100 in Guidelines for Video Mesh Cluster Deployment. |
|
April 12, 2021 |
Updated Configure Expressway TCP SIP Traffic Routing for Video Mesh to use the Webex zone, instead of a new DNS zone. |
|
February 9, 2021 |
|
|
December 11, 2020 |
|
|
October 22, 2020 |
|
| October 19, 2020 |
|
| September 18, 2020 |
|
| August 26, 2020 |
|
|
August 4, 2020 |
|
| July 9, 2020 |
|
|
June 26, 2020 |
|
| June 9, 2020 |
|
| May 21, 2020 | Updated Ports and Protocols for Management and Requirements for Proxy Support for Video Mesh. |
| May 15, 2020 | Updated Video Mesh Overview. |
| April 25, 2020 |
|
|
January 22, 2020 |
|
|
December 12, 2019 |
|
|
December 10, 2019 |
|
|
November 4, 2019 |
|
| October 18, 2019 |
|
|
September 26, 2019 |
|
|
September 13, 2019 |
|
| August 29, 2019 |
|
|
July 24, 2019 |
|
|
July 9, 2019 |
|
|
May 24, 2019 |
|
|
April 25, 2019 |
|
|
April 11, 2019 |
|
Webex Video Mesh Overview
Webex Video Mesh dynamically finds the optimal mix of on-premises and cloud conferencing resources. On-premises conferences stay on premises when there are enough local resources. When local resources are exhausted, conferences then expand to the cloud.
Video Mesh Node is software that is installed on an on-premises Cisco UCS server, registered to the cloud, and managed in Control Hub. Webex meetings, Webex Personal Meeting Room, Webex Space Meetings, and Webex App calls between two people can be routed to the local, on-net Video Mesh nodes. Video Mesh selects the most efficient way to use the available resources.
Video Mesh provides these benefits:
-
Improves quality and reduces latency by allowing you to keep your calls on premises.
-
Extends your calls transparently to the cloud when on-premises resources have reached their limit or are unavailable.
-
Manage your Video Mesh clusters from the cloud with a single administrative interface: Control Hub ( https://admin.webex.com).
-
Optimize resources and scale capacity, as needed.
-
Combines the features of cloud and on-premises conferencing in one seamless user experience.
-
Reduces capacity concerns, because the cloud is always available when additional conferencing resources are needed. No need to do capacity planning for the worst case scenario.
-
Provides advanced analytics on capacity and usage and troubleshooting report data in https://admin.webex.com.
-
Uses local media processing when users dial in to a Webex meeting from on-premises standards-based SIP endpoints and clients:
-
SIP based endpoints and clients (Cisco endpoints, Jabber, 3rd party SIP), registered to on-premises call control (Cisco Unified Communications Manager or Expressway), that call into a Cisco Webex meeting.
-
Webex App (including paired with room devices) that join a Webex meeting.
-
Webex room and desk devices that directly join a Webex meeting.
-
-
Provides optimized audio and video interactive voice response (IVR) to on-net SIP based endpoints and clients.
-
H.323, IP dial-in, and Skype for Business (S4B) endpoints continue to join meetings from the cloud.
-
Supports 1080p 30fps high definition video as an option for meetings, if meeting participants that can support 1080p are hosted through the local on-premises Video Mesh nodes. (If a participant joins an in-progress meeting from the cloud, on-premises users continue to experience 1080p 30fps on supported endpoints.)
-
Enhanced and differentiated Quality of Service (QoS) marking: separate audio (EF) and video (AF41).

Webex Video Mesh currently does not support Webex Webinars. -
Supports End to End Encrypted Meetings (E2EE meetings). If a customer deploys Video Mesh and selects the E2EE meeting type, it adds an additional layer of security, ensuring your data (media, files, whiteboards, annotations) remains secure and blocks third parties from accessing or modifying it. For detailed information, see Deploy Zero-Trust Meetings.
Private meetings currently do not support End to End Encryption.
Clients and Devices That Use Video Mesh Node
We endeavor to make Video Mesh interoperable with relevant clients and device types. Although it is not possible to test all scenarios, the testing on which this data is based covers most common functions of the listed endpoints and infrastructure. The absence of a device or client implies a lack of testing and a lack of official support from Cisco.
|
Client or Device Type |
Uses Video Mesh Node on Point to Point Call |
Uses Video Mesh Node on Multiparty Meeting |
|---|---|---|
|
Webex App (desktop and mobile) |
Yes |
Yes |
|
Webex devices, including room devices and Webex Board. (See the Endpoint and Webex App Requirements section for a full list.) |
Yes |
Yes |
|
In-room wireless share between Webex App and supported Room, Desk, and Board devices. |
Yes |
Yes |
|
Unified CM-registered devices (including IX endpoints) and clients (including Jabber VDI 12.6 and later, and Webex VDI 39.3 and later), calling into a Webex scheduled or Webex Personal Room meeting.* |
No |
Yes |
|
VCS/Expressway-registered devices, calling into a Webex scheduled or Webex Personal Room meeting.* |
No |
Yes |
|
Webex Call My Video System to Webex cloud-registered video devices |
N/A |
Yes |
|
Webex App web client ( https://web.webex.com) |
Yes |
Yes |
|
Phones registered to Cisco Webex Calling |
No |
No |
|
Webex Call My Video System to premises-registered SIP devices |
N/A |
No |
* It is not possible to guarantee that all on-premises devices and clients have been tested with the Video Mesh solution.
Video Mesh Incompatibility with the Full Feature Webex Experience
If you enable the Full Featured Webex Experience for the Webex App, then the Webex App isn't supported with the Video Mesh Nodes. That feature currently sends signaling and media directly to Webex. Future releases will make the Webex App and Video Mesh compatible. By default, we did not enable that feature for customers with Video Mesh.
You might have issues with Video Mesh and the Full Featured Webex Experience:
-
If you added Video Mesh to your deployment after the introduction of that feature.
-
If you enabled that feature without knowing its impact on Video Mesh.
If you notice issues, contact you Cisco Account team to disable the Full Featured Webex Experience toggle.
Quality of Service on Video Mesh Node
Video Mesh nodes conforms to recommended quality of service (QoS) best practices by enabling port ranges that allow you to differentiate audio and video streams in all flows to and from the Video Mesh nodes. This change will let you create QoS policies and effectively remark traffic to and from the Video Mesh Nodes.
Accompanying these port changes are QoS changes. Video Mesh nodes automatically mark media traffic from SIP registered endpoints (on-premises Unified CM or VCS Expressway registered) for both audio (EF) and video (AF41) separately with appropriate class of service and use well-known port ranges for specific media types.
The source traffic from the on-premises registered endpoints is always determined by the configuration on the call control (Unified CM or VCS Expressway).
For more information, see the QoS table at Ports and Protocols Used by Video Mesh and the steps to enable or disable QoS in the Video Mesh Deployment Task Flow
Webex App continue to connect to Video Mesh nodes over shared port 5004. These ports are also used by Webex App and endpoints for STUN reachability tests to Video Mesh nodes. Video Mesh node to Video Mesh node for cascades use the destination port range 10000–40000.Proxy Support for Video Mesh
Video Mesh supports explicit, transparent inspecting, and non-inspecting proxies. You can tie these proxies to your Video Mesh deployment so that you can secure and monitor traffic from the enterprise out to the cloud. This feature sends signaling and management https-based traffic to the proxy. For transparent proxies, network requests from Video Mesh nodes are forwarded to a specific proxy through enterprise network routing rules. You can use the Video Mesh admin interface for certificate management and the overall connectivity status after you implement the proxy with the nodes.
Media does not travel through the proxy. You must still open the required ports for media streams to reach the cloud directly. See Ports and Protocols for Management. |
The following proxy types are supported by Video Mesh:
-
Explicit Proxy (inspecting or non-inspecting)—With explicit proxy, you tell the client (Video Mesh nodes) which proxy server to use. This option supports one of the following authentication types:
-
None—No further authentication is required. (For HTTP or HTTPS explicit proxy.)
-
Basic—Used for an HTTP user agent to provide a username and password when making a request, and uses Base64 encoding. (For HTTP or HTTPS explicit proxy.)
-
Digest—Used to confirm the identity of the account before sending sensitive information, and applies a hash function on the username and password before sending over the network. (For HTTPS explicit proxy.)
-
NTLM—Like Digest, NTLM is used to confirm the identity of the account before sending sensitive information. Uses Windows credentials instead of the username and password. This authentication scheme requires multiple exchanges to complete. (For HTTP explicit proxy.)
-
-
Transparent Proxy (non-inspecting)—Video Mesh nodes are not configured to use a specific proxy server address and should not require any changes to work with a non-inspecting proxy.
-
Transparent Proxy (inspecting)—Video Mesh nodes are not configured to use a specific proxy server address. No http(s) configuration changes are necessary on Video Mesh, however, the Video Mesh nodes need a root certificate so that they trust the proxy. Inspecting proxies are typically used by IT to enforce policies regarding which websites can be visited and types of content that are not permitted. This type of proxy decrypts all your traffic (even https).
Supported Resolutions and Framerates for Video Mesh
This table covers the supported resolutions and framerates from a sender-receiver perspective in a meeting that is hosted on a Video Mesh node. The sender client (app or device) is across the top row of the table, whereas the receiver client is on the left side column of the table. The corresponding cell between the two participants captures the negotiated content resolution, frames per section, and audio source.
Resolution affects the call capacity on any Video Mesh node. For more information, see Capacity for Video Mesh nodes. |
The resolution and framerate value is combined as XXXpYY—For example, 720p10 means 720p at 10 frames per second.
The definition abbreviations (SD, HD, and FHD) in the sender row and receiver column refer to the upper resolution of the client or device:
-
SD—Standard Definition (576p)
-
HD—High Definition (720p)
-
FHD—Full High Definition (1080p)
|
Receiver |
Sender | ||||||
|---|---|---|---|---|---|---|---|
|
Webex App |
Webex App Mobile |
SIP Registered Devices (HD) |
SIP Registered Devices (FHD) |
Webex Registered Devices (SD) |
Webex Registered Devices (HD) |
Webex Registered Devices (FHD) | |
|
Webex App Desktop |
720p10 Mixed audio* |
720p10 Mixed audio |
720p30 Mixed audio |
720p30 Mixed audio |
576p15 Content audio** |
720p30 Mixed audio |
720p30 Mixed audio |
|
Webex App Mobile |
— |
— |
— |
— |
— |
— |
— |
|
SIP Registered Devices (HD) |
720p30 Content audio |
720p15 Mixed audio |
1080p15 Mixed audio |
1080p15 Mixed audio |
576p15 Mixed audio |
1080p15 Mixed audio |
1080p15 Mixed audio |
|
SIP Registered Devices (FHD) |
1080p30 Mixed audio |
720p15 Mixed audio |
1080p15 Mixed audio |
1080p30 Mixed audio |
576p15 Mixed audio |
1080p15 Mixed audio |
1080p30 Mixed audio |
| Webex Registered Devices (SD) |
1080p15 Mixed audio |
720p15 Mixed audio |
1080p15 Mixed audio |
1080p15 Mixed audio |
576p15 Mixed audio |
1080p15 Mixed audio |
1080p15 Mixed audio |
|
Webex Registered Devices (FHD) |
1080p30 Mixed audio |
720p15 Mixed audio |
1080p15 Mixed audio |
1080p30 Mixed audio |
576p15 Mixed audio |
1080p15 Mixed audio |
1080p30 Mixed audio |
* Content Audio refers to the audio that is played from the specific content being shared, such as a streaming video. This audio stream is separate from the regular meeting audio.
** Mixed Audio refers to a mix of the meeting participant audio and audio from the content share.
Requirements for Video Mesh
Video Mesh is available with the offers documented in License Requirements for Hybrid Services.
Call Control and Meeting Integration Requirements for Video Mesh
Call control and existing meetings infrastructure are not required to use Video Mesh, but you can integrate the two. If you're integrating Video Mesh with your call control and meeting infrastructure, make sure your environment meets the minimum criteria that are documented in the following table.
|
Component Purpose |
Minimum Supported Version |
|---|---|
|
On-Premises call control |
Cisco Unified Communications Manager, Release 11.5(1) SU3 or later. (We recommend the latest SU release.) Cisco Expressway-C or E, Release X8.11.4 or later. (See the "Important Information" section in the Expressway Release Notes for more information.) |
|
Meeting infrastructure |
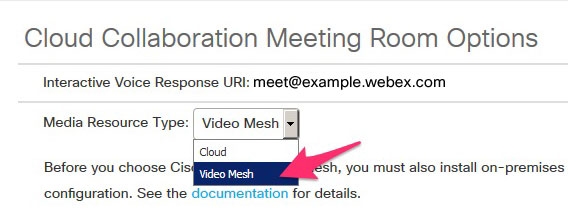
Webex Meetings WBS33 or later. (You can verify that your Webex site is on the correct platform if it has the Media Resource Type list available in the Cloud Collaboration Meeting Room site options.)
To ensure that your site is ready for Video Mesh, contact your customer success manager (CSM) or partner. |
|
Failover handling |
Cisco Expressway-C or E, Release X8.11.4 or later. (See the "Important Information" section in the Expressway Release Notes for more information.) |
Endpoint and Webex App Requirements
|
Component Purpose |
Details |
|---|---|
|
Supported Endpoints | |
|
Supported versions of the Webex App |
Video Mesh supports Webex App for desktop (Windows, Mac) and mobile (Android, iPhone, and iPad). To download the app for a supported platform, go to https://www.webex.com/downloads.html. |
|
Supported codecs |
See Webex| Video Specifications for Calls and Meetings for the supported audio and video codecs. Note these caveats for Video Mesh:
|
|
Supported Webex-registered Room, Desk, and Board devices |
The following devices are tested and confirmed to work with Video Mesh nodes: |
System and Platform Requirements for Video Mesh Node Software
Production Environments
In production deployments, there are two ways to deploy Video Mesh Node software on a particular hardware configuration:
-
You can set up each server as a single virtual machine, which is best for deployments that include many SIP endpoints.
-
Using the VMNLite option, you can set up each server with multiple smaller virtual machines. VMNLite is best for deployments where the majority of clients and devices are the Webex app and Webex registered endpoints.
These requirements are common for all configurations:
-
VMware ESXi 7 or 8, vSphere 7 or 8
-
Hyperthreading enabled
The Video Mesh nodes running independent of the platform hardware need dedicated vCPUs and RAM. Sharing resources with other applications is not supported. This applies to all images of the Video Mesh software.
For Video Mesh Lite (VMNLite) images on a CMS platform, we only support having VMNLite images. No other Video Mesh image or non-Video Mesh application can be on the CMS hardware with the VMNLite software.
|
Hardware Configuration |
Production Deployment as a Single Virtual Machine |
Production Deployment with VMNLite VMs |
Notes | ||
|---|---|---|---|---|---|
|
Cisco Meeting Server 1000 (CMS 1000) |
|
Deploy as 3 identical virtual machine instances, each with:
|
We recommend this platform for Video Mesh Node.
| ||
|
Specifications-based Configuration (2.6-GHz Intel Xeon E5-2600v3 or later processor required) |
|
Deploy as 3 identical virtual machine instances, each with:
|
Each Video Mesh virtual machine must have CPU, RAM and hard drives reserved for itself. Use either the CMS1000 or VMNLite option during configuration. Peak IOPs (input/output operations per second) for NFS storage is 300 IOPS. | ||
|
Cisco Meeting Server 2000 (CMS 2000) |
Deploy as 8 identical virtual machine instances, each with:
|
Deploy as 24 identical virtual machine instances, each with:
|
We recommend this platform for Video Mesh Node. Each blade must be a complete Cisco Meeting Server 1000 with reserved CPU, RAM and hard drives per blade. Peak IOPs for NFS storage is 300 IOPS. |
Demo Environments
For basic demo purposes, you can use a specifications-based hardware configuration, with the following minimum requirements:
-
14vCPUs (12 for Video Mesh Node, 2 for ESXi)
-
8 GB main memory
-
20 GB local hard disk space
-
2.6 GHz Intel Xeon E5-2600v3 or later processor
This configuration of Video Mesh is not Cisco TAC supported. |
For more information about the demo software, see Video Mesh Node Demo Software.
Bandwidth Requirements
Video Mesh Nodes must have a minimum internet bandwidth of 10 Mbps for both upload and download to function properly.
Requirements for Proxy Support for Video Mesh
-
We officially support the following proxy solutions that can integrate with your Video Mesh nodes.
-
Cisco Web Security Appliance (WSA) for transparent proxy
-
Squid for explicit proxy
-
-
For an explicit proxy or transparent inspecting proxy that inspects (decrypts traffic), you must have a copy of the proxy's root certificate that you'll need to upload to the Video Mesh node trust store on the web interface.
-
We support the following explicit proxy and authentication type combinations:
-
No authentication with http and https
-
Basic authentication with http and https
-
Digest authentication with https only
-
NTLM authentication with http only
-
-
For transparent proxies, you must use the router/switch to force HTTPS/443 traffic to go to the proxy. You can also force Web Socket to go to proxy. (Web Socket uses https.)
Video Mesh requires web socket connections to cloud services, so that the nodes function correctly. On explicit inspecting and transparent inspecting proxies, http headers are required for a proper websocket connection. If they are altered, the websocket connection will fail.
When the websocket connection failure occurs on port 443 (with transparent inspecting proxy enabled), it leads to a post-registration warning in Control Hub: “Webex Video Mesh SIP calling is not working correctly.” The same alarm can occur for other reasons when proxy is not enabled. When websocket headers are blocked on port 443, media does not flow between apps and SIP clients.
If media is not flowing, this often occurs when https traffic from the node over port 443 is failing:
-
Port 443 traffic is allowed by the proxy, but it is an inspecting proxy and is breaking the websocket.
To correct these problems, you may have to “bypass” or “splice” (disable inspection) on port 443 to: *.wbx2.com and *.ciscospark.com.
-
Capacity for Video Mesh nodes
Because Video Mesh is a software-based media product, the capacity of your Video Mesh nodes varies. In particular, meeting participants on the Webex cloud place a heavier load on nodes. You get lower capacities when you have more cascades to the Webex cloud. Other factors that impact capacity are:
-
Types of devices and clients
-
Video resolution
-
Network quality
-
Peak load
-
Deployment model
Video Mesh usage doesn't impact your Webex license counts. |
In general, adding more nodes to the cluster doesn't double the capacity because of the overhead for setting up cascades. Use these numbers as general guidance. We recommend the following:
-
Test out common meeting scenarios for your deployment.
-
Use the analytics in Control Hub to see how your deployment is evolving and add capacity as needed.
Overflows on low call volume (especially SIP calls that originate on-premises) aren't a true reflection of scale. Video Mesh analytics (under Control Hub > Resources > Call Activity) indicate the call legs that originate on-premises. They don't specify the call streams that came in through the cascade to the Video Mesh node for media processing. As remote participant numbers increase in a meeting, cascades increase and consume on-premises media resources on the Video Mesh node. |
This table lists capacity ranges for different mixes participants and endpoints on regular Video Mesh nodes. Our testing included meetings with all participants on the local node and meetings with a mix of local and cloud participants. With more participants on the Webex cloud, expect your capacity to fall in the lower end of the range.
|
Scenario |
Resolution |
Participant capacity |
|---|---|---|
|
Meetings with only Webex App participants |
720p |
100–130 |
|
1080p |
90–100 | |
|
Meetings and 1-to-1 calls with only Webex App participants |
720p |
60–100 |
|
1080p |
90–100 | |
|
Meetings with only SIP participants |
720p |
70–80 |
|
Meetings with only SIP participants |
1080p |
30–40 |
|
Meetings with Webex App and SIP participants |
720p |
75–110 |
|
Capacity for VMNLite
We recommend VMNLite for deployments that mainly include Webex App and cloud-registered endpoints. In these deployments, the nodes use more switching and fewer transcoding resources than the standard configuration provides. Deploying several smaller virtual machines on the host optimizes resources for this scenario.
This table lists capacity ranges of different mixes participants and endpoints. Our testing included meetings with all participants on the local node and meetings with a mix of local and cloud participants. With more participants on the Webex cloud, expect your capacity to fall in the lower end of the range.
|
Scenario |
Resolution |
Participant capacity with 3 VMNLite nodes on a server |
|---|---|---|
|
Meetings with only Webex App participants |
720p |
250–300 |
|
1080p |
230–240 | |
|
Meetings and 1-to-1 calls with only Webex App participants |
720p |
175–275 |
|
1080p |
230–240 |
The base resolution for Webex App meetings is 720p. But when you share, the participant thumbnails are at 180p. |
Clusters in Video Mesh
You deploy Video Mesh nodes in clusters. A cluster defines Video Mesh nodes with similar attributes, such as network proximity. Participants use a particular cluster or the cloud, depending on the following conditions:
-
A client on a corporate network that can reach an on-premises cluster connects to it—the primary preference for clients on the corporate network.
-
Clients joining a Video Mesh private meeting only connect to on-premise clusters. You can create a separate cluster specifically for these private meetings.
-
A client that can't reach an on-premises cluster connects to the cloud—the case for a mobile device unconnected to the corporate network.
-
The chosen cluster also depends on latency, rather than just location. For example, a cloud cluster with lower STUN round-trip (SRT) delay than a Video Mesh cluster may be a better candidate for the meeting. This logic prevents a user from landing on a geographically far cluster with a high SRT delay.
Each cluster contains logic that cascades meetings, except for Video Mesh private meetings, across other cloud meeting clusters, as needed. Cascading provides a data path for media between clients in their meetings. Meetings are distributed across nodes, and clients land on the most efficient node nearest to them, depending on factors such as network topology, WAN link, and resource utilization.
The client's ability to ping media nodes determines reachability. An actual call uses a variety of potential connection mechanisms, such as UDP and TCP. Before the call, the Webex device (Room, Desk, Board, and Webex App) registers with the Webex cloud, which provides a list of cluster candidates for the call.
The nodes in a Video Mesh cluster require unimpeded communication with each other. They also require unimpeded communication with the nodes in all your other Video Mesh clusters. Ensure that your firewalls allow all communication between the Video Mesh nodes. |
Clusters for Private Meetings
You can reserve a Video Mesh cluster for private meetings. When the reserved cluster is full, the private meeting media cascades out to your other Video Mesh clusters. When the reserved cluster is full, private meetings and non-private meetings share the resources of your remaining clusters.
Non-private meetings won’t use a reserved cluster, reserving those resources for the private meetings. If a non-private meeting runs out of resources on your network, it cascades out to the Webex cloud instead.
For details on the Video Mesh private meetings feature, see Private Meetings.
You can't use the short video address format (meet@your_site) if you reserve all Video Mesh clusters for private meetings. These calls currently fail without a proper error message. If you leave some clusters unreserved, calls with the short video address format can connect through those clusters. |
Guidelines for Video Mesh Cluster Deployment
-
In typical enterprise deployments, we recommend that customers use up to 100 nodes per cluster. There are no hard limits set in the system to block a cluster size with greater than 100 nodes. However, if you need to create larger clusters, we strongly recommend that you review this option with Cisco engineering through your Cisco Account Team.
-
Create fewer clusters when resources have similar network proximity (affinity).
-
When creating clusters, only add nodes that are in the same geographical region and the same data center. Clustering across the wide area network (WAN) is not supported.
-
Typically, deploy clusters in enterprises that host frequent localized meetings. Plan where you place clusters on the bandwidth available at various WAN locations inside the enterprise. Over time, you can deploy and grow cluster-by-cluster based on observed user patterns.
-
Clusters located in different time zones can effectively serve multiple geographies by taking advantage of different peak/busy hour calling patterns.
-
If you have two Video Mesh nodes in two separate data centers (EU and NA, for example), and you have endpoints join through each data center, the nodes in each data center would cascade to a single Video Mesh node in the cloud. Theses cascades would go over the Internet. If there is a cloud participant (that joins before one of the Video Mesh participants), the nodes would be cascaded through the cloud participant’s media node.
Time Zone Diversity
Time zone diversity can allow clusters to be shared during off-peak times. For example: A company with a Northern California cluster and a New York cluster might find that overall network latency is not that high between the two locations that serve a geographically diverse user population. When resources are at peak usage in the Northern California cluster, the New York cluster is likely to be off peak and have additional capacity. The same applies for the Northern California cluster, during peak times in the New York cluster. These aren't the only mechanisms used for effective deployment of resources, but they are the two main ones.
Overflow to the Cloud
When the capacity of all on-premises clusters is reached, an on-premises participant overflows to the Webex cloud. This doesn't mean that all calls are hosted in the cloud. Webex only directs to the cloud those participants that are either remote or can't connect to an on-premises cluster. In a call with both on-premises and cloud participants, the on-premises cluster is bridged (cascaded) to the cloud to combine all participants into a single call.
If you set up the meeting as the private meeting type, Webex keeps all the calls on your on-premises clusters. Private meetings never overflow to the cloud.
Webex Device Registers with Webex
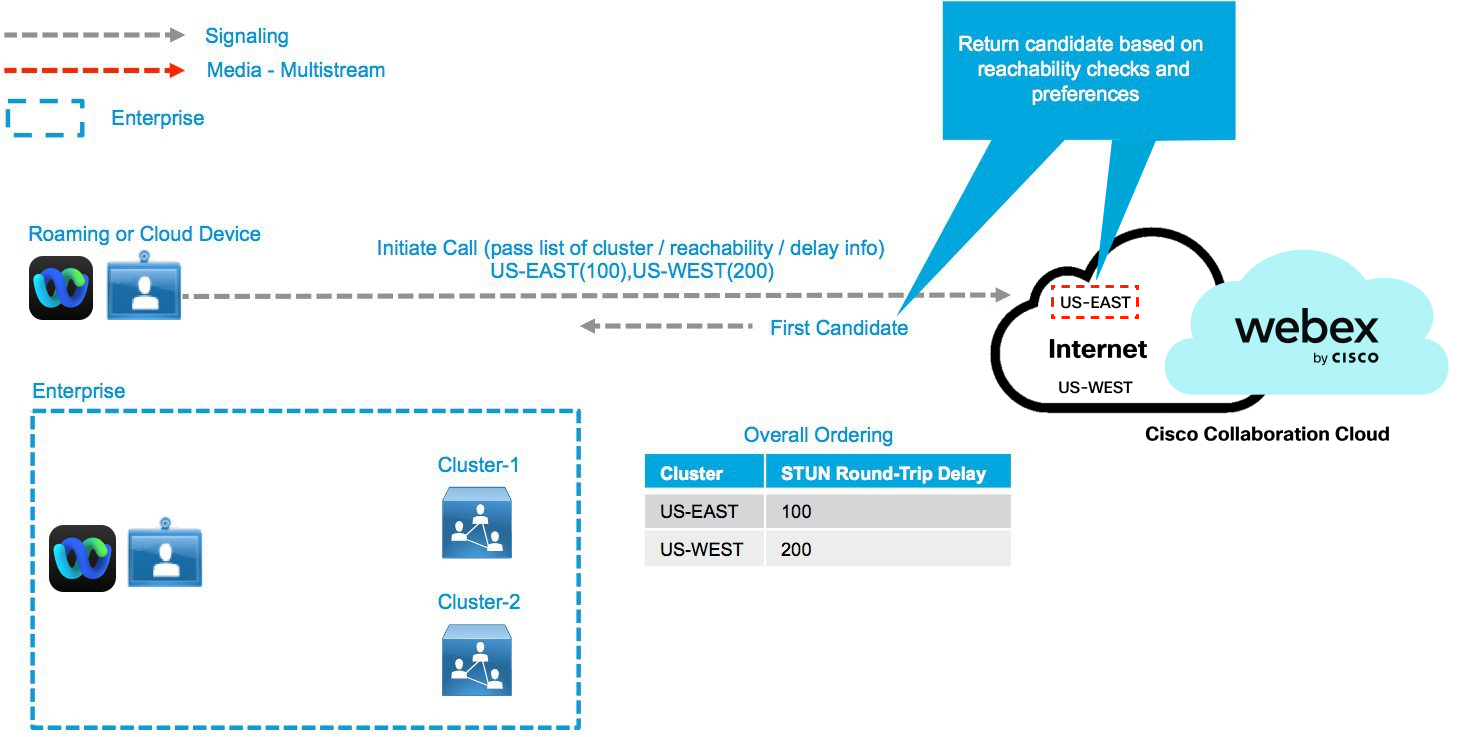
In addition to determining reachability, the clients also perform periodic round-trip delay tests using Simple Traversal of UDP through NAT (STUN). STUN round-trip (SRT) delay is an important factor when selecting potential resources during an actual call. When multiple clusters are deployed, the primary selection criteria are based on the learned SRT delay. Reachability tests are performed in the background, initiated by a number of factors including network changes, and do not introduce delays that affect call setup times. The following two examples show possible reachability test outcomes.
Round-trip Delay Tests—Cloud Device Fails to Reach On-Premises Cluster
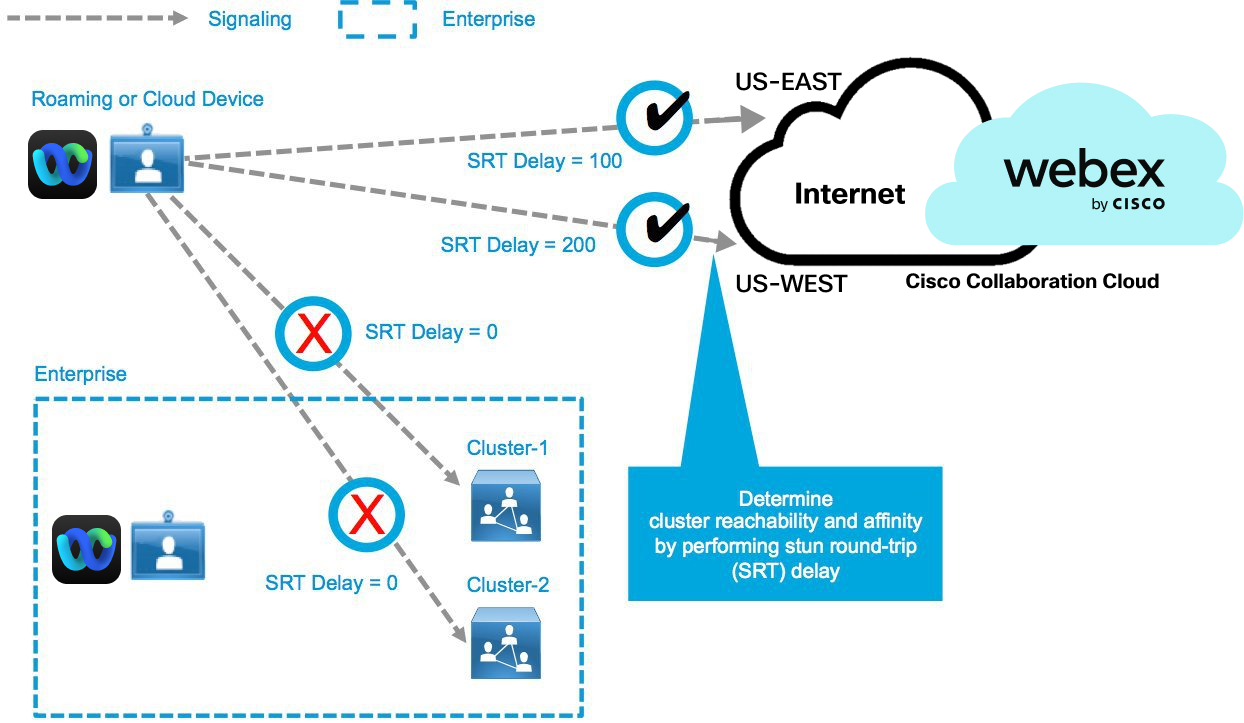
Round-trip Delay Tests—Cloud Device Successfully Reaches On-Premises Cluster
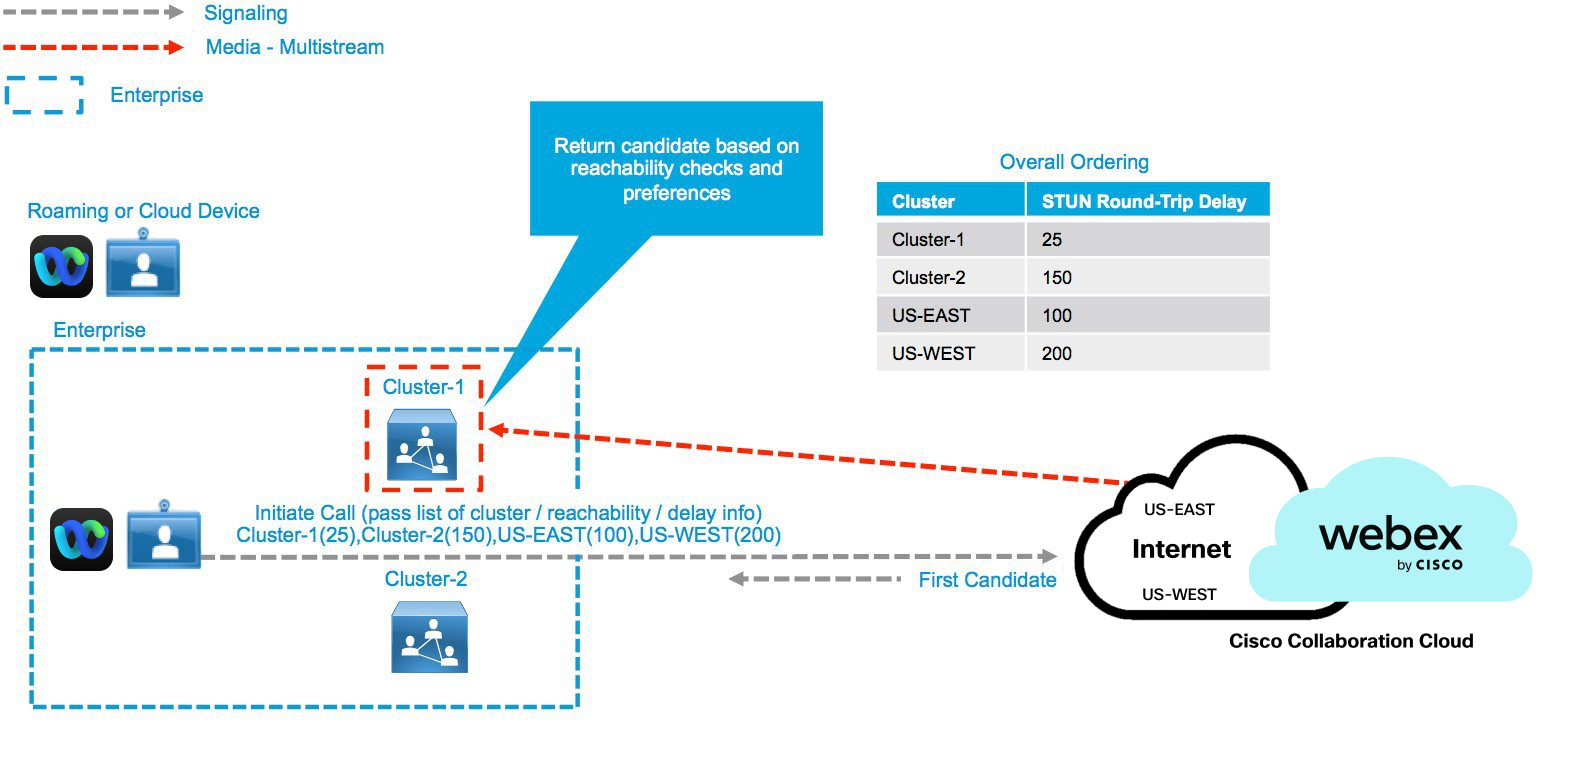
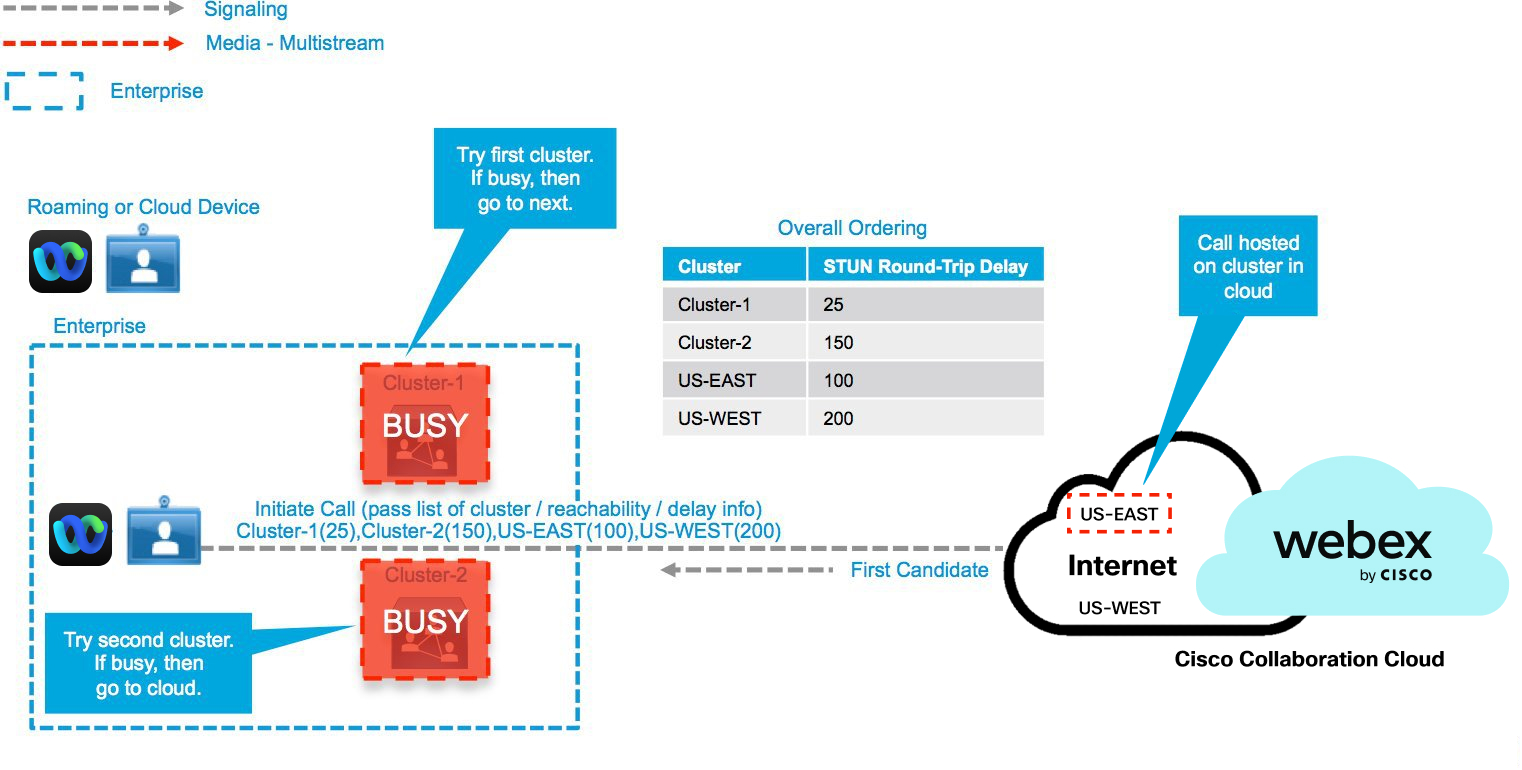
Learned reachability information is provided to the Webex cloud every time a call is set up. This information allows the cloud to select the best resource (cluster or cloud), depending on the relative location of the client to available clusters and the type of call. If no resources are available in the preferred cluster, all clusters are tested for availability based on SRT delay. A preferred cluster is chosen with the lowest SRT delay. Calls are served on premises from a secondary cluster when the primary cluster is busy. Local reachable Video Mesh resources are tried first, in order of lowest SRT delay. When all local resources are exhausted, the participant connects to the cloud.
Cluster definition and location is critical for a deployment that provides the best overall experience for participants. Ideally, a deployment should provide resources where the clients are located. If not enough resources are allocated where the clients make the majority of calls, more internal network bandwidth is consumed to connect users to distant clusters.
On-Premises and Cloud Call
On-premises Webex devices that have the same cluster affinity (preference, based on proximity to the cluster) connect to the same cluster for a call. On-premises Webex devices with different on-premises cluster affinities, connect to different clusters and the clusters then cascade to the cloud to combine the two environments into a single call. This creates a hub and spoke design with Webex cloud as the hub and the on-premises clusters acting as the spokes in the meeting.
On-Premises Call with Different Cluster Affinities
The Webex device connects to either on-premises cluster or cloud based upon its reachability. The following show examples of the most-common scenarios.
Webex Cloud Device Connects to Cloud
Webex On-Premises Device Connects to On-Premises Cluster
Webex On-Premises Device Connects to Cloud
Cloud Cluster Selection for Overflow Based on 250 ms or Higher STUN Round-Trip Delay
While the preference for node selection is your locally deployed Video Mesh nodes, we support a scenario where, if the STUN round-trip (SRT) delay to an on-premises Video Mesh cluster exceeds the tolerable round-trip delay of 250 ms (which usually happens if the on-premises cluster is configured in a different continent), then the system selects the closest cloud media node in that geography instead of a Video Mesh node.
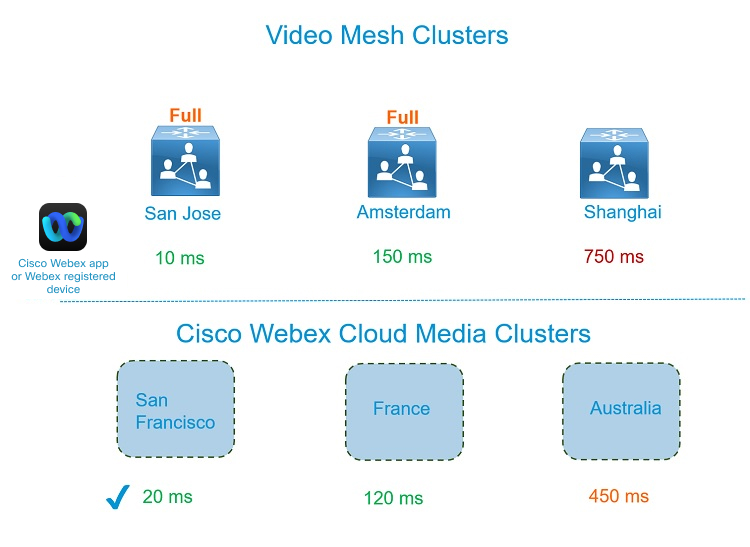
-
The Webex App or Webex device is on the enterprise network in San Jose.
-
San Jose and Amsterdam clusters are at capacity or unavailable.
-
SRT delay to the Shanghai cluster is greater than 250 ms and will likely introduce media quality issues.
-
The San Francisco cloud cluster has an optimal SRT delay.
-
The Shanghai Video Mesh cluster is excluded from consideration.
-
As a result, the Webex App overflows to the San Francisco cloud cluster.
Private Meetings
Private meetings isolate all media to your network through Video Mesh. Unlike normal meetings, if the local nodes are full, the media doesn't cascade to the Webex cloud. But, by default, private meetings can cascade to different Video Mesh clusters on your network. For private meetings across geographic locations, your Video Mesh clusters must have direct connectivity to each other to allow intercluster cascades, like HQ1_VMN to Remote1_VMN in the figure.
Make sure the necessary ports are open in your firewall, to allow unimpeded cascade between clusters. See Ports and Protocols for Management.
All participants in a private meeting must belong to your meeting host's Webex organization. They can join using the Webex App or an authenticated video system (SIP endpoints registered to UCM/VCS or Webex registered video device). Participants with VPN or MRA access to your network can join a private meeting. But nobody can join a private meeting from outside your network.
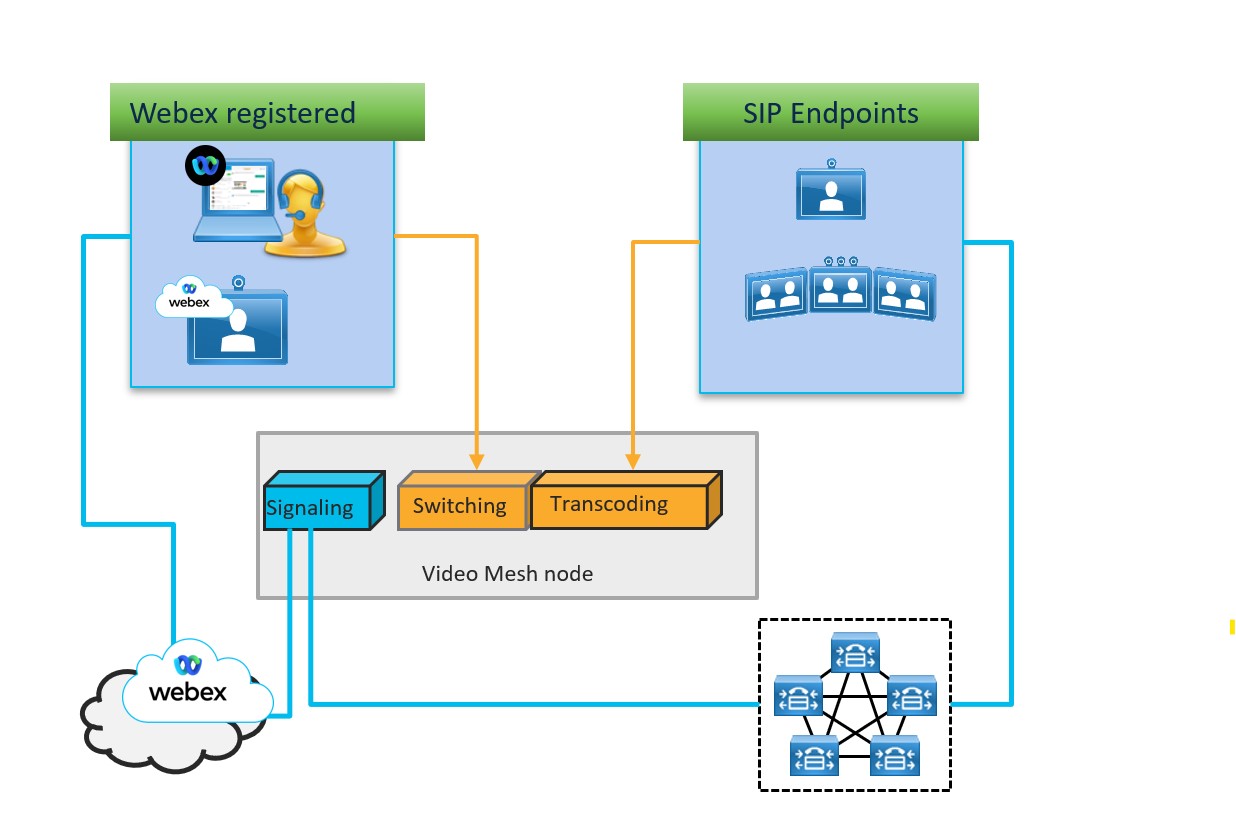
Deployment Models Supported by Video Mesh
- Supported in a Video Mesh Deployment
-
-
You can deploy a Video Mesh Node in either a data center (preferred) or demilitarized zone (DMZ). For guidance, see Ports and Protocols Used by Video Mesh.
-
For a DMZ deployment, you can set up the Video Mesh nodes in a cluster with the dual network interface (NIC). This deployment lets you separate the internal enterprise network traffic (used for interbox communication, cascades between node clusters, and to access the node's management interface) from the external cloud network traffic (used for connectivity to the outside world and cascades to the cloud).
Dual NIC works on the full, VMNLite and demo version of Video Mesh node software. You can also deploy the Video Mesh behind a 1:1 NAT setup.
-
You can integrate Video Mesh nodes with your call control environment. For example deployments with Video Mesh integrated with Unified CM, see Deployment Models For Video Mesh and Cisco Unified Communications Manager.
-
The following types of address translation are supported:
-
Dynamic Network Address Translation (NAT) using an IP pool
-
Dynamic Port Address Translation (PAT)
-
1:1 NAT
-
Other forms of NAT should work as long as the correct ports and protocols are used, but we do not officially support them because they have not been tested.
-
-
IPv4
-
Static IP address for the Video Mesh Node
-
- Not Supported in a Video Mesh Deployment
-
-
IPv6
-
DHCP for the Video Mesh Node
-
A cluster with a mixture of single NIC and dual NIC
-
Clustering Video Mesh nodes over the wide area network (WAN)
-
Audio, video, or media that does not pass through a Video Mesh Node:
-
Audio from phones
-
Peer-to-peer call between Webex App and standards-based endpoint
-
Audio termination on Video Mesh Node
-
Media sent through Expressway C/E pair
-
Video call back from Webex
-
-
Deployment Models For Video Mesh and Cisco Unified Communications Manager
These examples show common Video Mesh deployments and help you understand where Video Mesh clusters can fit in to your network. Keep in mind that Video Mesh deployment depends on factors in your network topology:
-
Data center locations
-
Office locations and size
-
Internet access location and capacity
In general, try to tie the Video Mesh nodes to the Unified CM or Session Management Edition (SME) clusters. As a best practice, keep the nodes as centralized as possible to the local branches.
Video Mesh supports Session Management Edition (SME). Unified CM clusters can be connected through an SME, and then you must create a SME trunk that connects to the Video Mesh nodes.
Hub and Spoke Architecture
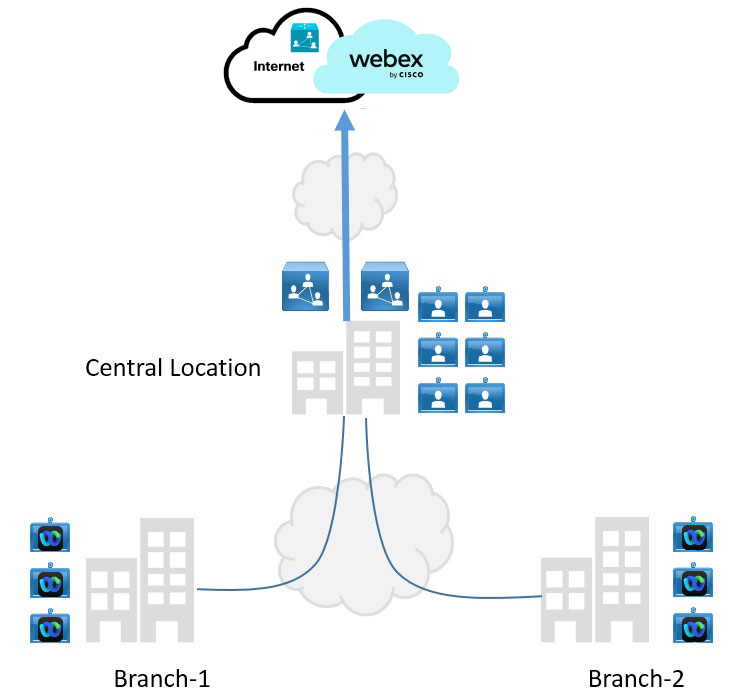
This deployment model involves centralized networking and internet access. Typically, the central location has a high employee concentration. In this case, a Video Mesh cluster can be located at central location for optimized media handling.
Locating clusters in branch locations may not yield benefits in the short term and may lead to suboptimal routing. We recommend that you deploy clusters in a branch only if there is frequent communication between branches.
Geographic Distribution
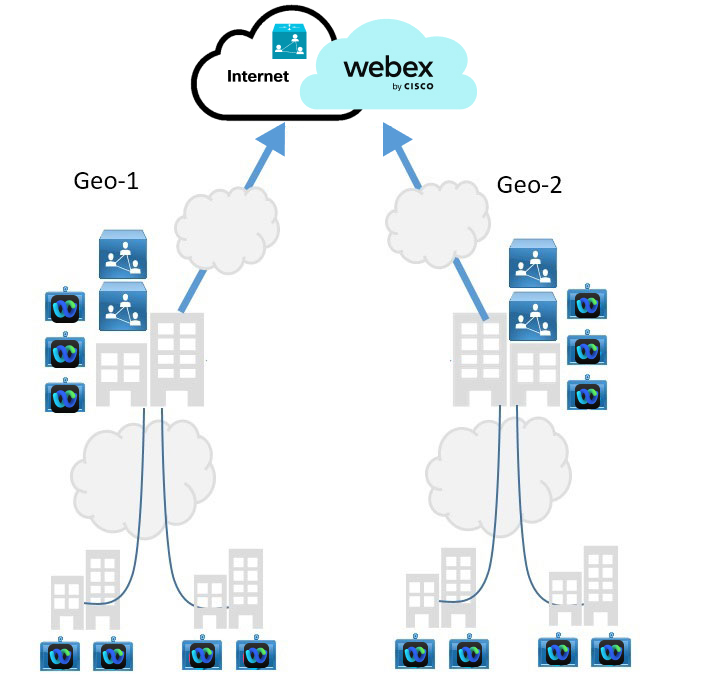
The geographically distributed deployment is interconnected but can exhibit noticeable latency between regions. Lack of resources can cause suboptimal cascades to be setup in the short term when there are meetings between users in each geographical location. In this model, we recommend that you allocate of Video Mesh nodes near regional internet access.
Geographic Distribution with SIP Dialing
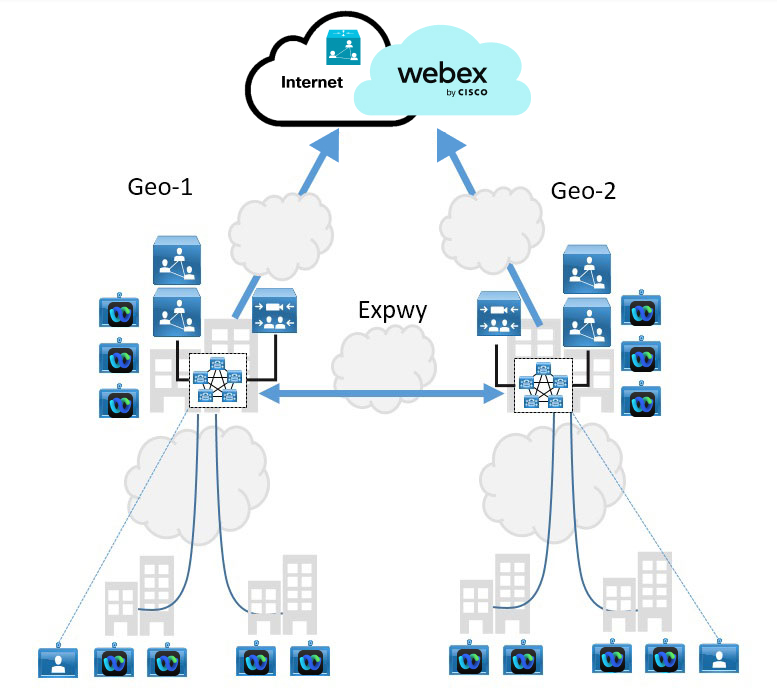
This deployment model contains regional Unified CM clusters. Each cluster can contain a SIP trunk to select resources in the local Video Mesh cluster. A second trunk can provide a failover path to an Expressway pair if resources become limited.
Ports and Protocols Used by Video Mesh
To ensure a successful deployment of Video Mesh and for trouble-free operation of the Video Mesh nodes, open the following ports on your firewall for use with the protocols.
-
See Network Requirements for Webex Services to understand the overall network requirements for Webex Teams.
-
See the Firewall Traversal Whitepaper for more information about firewall and network practices for Webex services.
-
To mitigate potential DNS query issues, follow the DNS Best Practices, Network Protections, and Attack Identification documentation when you configure your enterprise firewall.
-
For more design information, see the Preferred Architecture for Hybrid Services, CVD.
Ports and Protocols for Management
The nodes in a Video Mesh cluster require unimpeded communication with each other. They also require unimpeded communication with the nodes in all your other Video Mesh clusters. Ensure that your firewalls allow all communication between the Video Mesh nodes. |
The Video Mesh nodes in a cluster must be in the same VLAN or subnet mask.
|
Purpose |
Source |
Destination |
Source IP |
Source Port |
Transport Protocol |
Destination IP |
Destination Port |
|---|---|---|---|---|---|---|---|
|
Management |
Management computer |
Video Mesh node |
As required |
Any |
TCP, HTTPS |
Video Mesh node |
443 |
|
SSH for access to Video Mesh admin console |
Management computer |
Video Mesh node |
As required |
Any |
TCP |
Video Mesh node |
22 |
|
Intracluster Communication |
Video Mesh node |
Video Mesh node |
IP address of other Video Mesh nodes in the cluster |
Any |
TCP |
Video Mesh nodes |
8443 |
|
Management |
Video Mesh node |
Webex cloud |
As required |
Any |
UDP, NTP UDP, DNS TCP, HTTPS (WebSockets) |
Any |
123* 53* |
|
Cascade Signaling |
Video Mesh node |
Webex cloud |
Any |
Any |
TCP |
Any |
443 |
|
Cascade Media |
Video Mesh node |
Webex cloud |
Video Mesh node |
Any*** |
UDP |
Any For specific addresses ranges, see the "IP subnets for Webex Media services" section in Network Requirements for Webex Services. |
5004 50000 to 53000 For details, see the "Webex Services – Port Numbers and Protocols" section in Network Requirements for Webex Services. |
|
Cascade Signaling |
Vido Mesh Cluster (1) |
Vido Mesh Cluster (2) |
Any |
Any |
TCP |
Any |
443 |
|
Cascade Media |
Vido Mesh Cluster (1) |
Vido Mesh Cluster (2) |
Vido Mesh Cluster (1) |
Any*** |
UDP |
Any |
5004 50000 to 53000 |
|
Management |
Video Mesh node |
Webex cloud |
As required |
Any |
TCP, HTTPS |
Any** |
443 |
|
Management |
Video Mesh node (1) |
Video Mesh node (2) |
Video Mesh node (1) |
Any |
TCP, HTTPS (WebSockets) |
Video Mesh node (2) |
443 |
|
Internal Communication |
Video Mesh node |
All other Video Mesh nodes |
Video Mesh node |
Any |
UDP |
Any |
10000 to 40000 |
* The default configuration in the OVA is configured for NTP and DNS. The OVA requires that you open those ports outbound to the internet. If you configure a local NTP and DNS server, then you don't have to open ports 53 and 123 through the firewall.
** Because some cloud service URLs are subject to change without warning, ANY is the recommended destination for trouble-free operation of the Video Mesh nodes. If you prefer to filter traffic based on URLs, see the Webex Teams URLs for Hybrid Services
section of the Network Requirements for Webex Services for more information.
***The ports vary depending on if you enable QoS. With QoS enabled, the ports are 52,500-59499, 63000-64667, 59500-62999 and 64688-65500. With QoS off, the ports are 34,000-34,999.
Traffic Signatures for Video Mesh (Quality of Service Enabled)
For deployments where the Video Mesh node sits in the enterprise side of the DMZ or inside the firewall, there is a Video Mesh Node configuration setting in the Webex Control Hub that allows the administrator to optimize the port ranges used by the Video Mesh Node for QoS network marking. This Quality of Service setting is enabled by default and changes the source ports that are used for audio, video, and content sharing to the values in this table. This setting allows you to configure QoS marking policies based on UDP port ranges to differentiate audio from video or content sharing and mark all Audio with recommended value of EF and Video and Content sharing with a recommended value of AF41.
The table and diagram show UDP ports that are used for audio and video streams, which are the main focus of QoS network configurations. While network QoS marking policies for media over UDP are the focus of the following table, Webex Video Mesh nodes also terminate TCP traffic for presentation and content sharing for Webex app using ephemeral ports 52500–65500. If a firewall sits between the Video Mesh nodes and the Webex app, those TCP ports also must be allowed for proper functioning.
Video Mesh Node marks traffic natively. This native marking is asymmetric in some flows and depends on whether the source ports are shared ports (single port like 5004 for multiple flows to various destinations and destination ports) or whether they are not (where the port falls in a range but is unique to that specific bidirectional session). To understand the native marking by a Video Mesh Node, note that the Video Mesh node marks audio EF when it is not using the 5004 port as a source port. Some bidirectional flows like Video Mesh to Video Mesh cascades or Video Mesh to Webex App will be asymmetrically marked, a reason to use the network to remark traffic based on the UDP port ranges provided. |
| Source IP Address | Destination IP Address | Source UDP Ports | Destination UDP Ports | Native DSCP Marking | Media Type |
|
Video Mesh Node |
Webex cloud media services |
35000 to 52499 |
5004 |
AF41 |
Test STUN packets |
| Video Mesh Node | Webex cloud media services | 52500 to 59499 | 5004 | EF | Audio |
| Video Mesh Node | Webex cloud media services | 63000 to 64667 | 5004 | AF41 | Video |
| Video Mesh Node | Webex cloud media services |
59500 to 62999 |
50000 to 51499 |
EF |
Audio |
| Video Mesh Node | Webex cloud media services |
64668 to 65500 |
51500 to 53000 | AF41 |
Video |
| Video Mesh Node | Video Mesh Node | 10000 to 40000 | 10000 to 40000 | — | Audio |
| Video Mesh Node | Video Mesh Node | 10000 to 40000 | 10000 to 40000 | — | Video |
| Video Mesh Node | Unified CM SIP endpoints | 52500 to 59499 | Unified CM SIP Profile | EF | Audio |
| Video Mesh Node | Unified CM SIP endpoints | 63000 to 64667 | Unified CM SIP Profile | AF41 | Video |
|
Video Mesh Cluster |
Video Mesh Cluster | 52500 to 59499 | 5004 | EF | Audio |
|
Video Mesh Cluster |
Video Mesh Cluster | 63000 to 64667 | 5004 | AF41 | Video |
|
Video Mesh Cluster |
Video Mesh Cluster |
59500 to 62999 |
50000 to 51499 |
EF |
Audio |
|
Video Mesh Cluster |
Video Mesh Cluster |
64668 to 65500 |
51500 to 53000 | AF41 |
Video |
| Video Mesh Node | Webex Teams application or endpoint* | 5004 | 52000 to 52099 | AF41 | Audio |
| Video Mesh Node | Webex Teams application or endpoint | 5004 | 52100 to 52299 | AF41 | Video |
*The direction of media traffic determines the DSCP markings. If the source ports are from the Video Mesh node (from the Video Mesh node to Webex Teams app), the traffic is marked as AF41 only. Media traffic that originates from the Webex Teams app or Webex endpoints has the separate DSCP markings, but the return traffic from the Video Mesh node shared ports does not.
UDP Source Port Differentiation (Windows Webex App clients): Contact your local account team if you would like UDP Source Port Differentiation enabled for your organization. If this is not enabled, audio and video share cannot be differentiated by Windows OS. The source ports will be the same for audio, video and content share on Windows devices. |
Traffic Signatures for Video Mesh (Quality of Service Disabled)
For deployments where the Video Mesh node sits in the DMZ, there is a Video Mesh Node configuration setting in the Webex Control Hub that allows you to optimize the port ranges used by the Video Mesh node. This Quality of Service setting, when disabled (enabled by default), changes the source ports that are used for audio, video, and content sharing from the Video Mesh node to the range 34000 to 34999. The Video Mesh node then natively marks all audio, video, and content sharing to a single DSCP of AF41.
Because the source ports are the same for all media regardless of destination, you cannot differentiate the audio from video or content sharing based on port range with this setting disabled. This configuration does let you configure firewall pin holes for media more easily that with Quality of Service enabled. |
The table and diagram show UDP ports that are used for audio and video streams when QoS is disabled.
| Source IP Address | Destination IP Address | Source UDP Ports | Destination UDP Ports |
Native DSCP Marking | Media Type |
| Video Mesh Node | Webex cloud media services | 34000 to 34999 | 5004 | AF41 | Audio |
| Video Mesh Node | Webex cloud media services | 34000 to 34999 | 5004 | AF41 | Video |
| Video Mesh Node | Webex cloud media services | 34000 to 34999 | 50000 to 51499 | AF41 | Audio |
| Video Mesh Node | Webex cloud media services | 34000 to 34999 | 51500 to 53000 | AF41 | Video |
| Video Mesh Node | Video Mesh Node | 10000 to 40000 | 10000 to 40000 | AF41 | Audio |
| Video Mesh Node | Video Mesh Node | 10000 to 40000 | 10000 to 40000 | AF41 | Video |
|
Video Mesh Cluster |
Video Mesh Cluster | 34000 to 34999 | 5004 | AF41 | Audio |
|
Video Mesh Cluster |
Video Mesh Cluster | 34000 to 34999 | 5004 | AF41 | Video |
|
Video Mesh Cluster |
Video Mesh Cluster | 34000 to 34999 | 50000 to 51499 | AF41 | Audio |
|
Video Mesh Cluster |
Video Mesh Cluster | 34000 to 34999 | 51500 to 53000 | AF41 | Video |
| Video Mesh Node | Unified CM SIP endpoints | 52500 to 59499 | Unified CM SIP Profile | AF41 | Audio |
| Video Mesh Node | Unified CM SIP endpoints | 63000 to 64667 | Unified CM SIP Profile | AF41 | Video |
|
Video Mesh Node |
Webex cloud media services |
35000 to 52499 |
5004 |
AF41 |
Test STUN packets |
| Video Mesh Node | Webex Teams application or endpoint | 5004 | 52000 to 52099 | AF41 | Audio |
| Video Mesh Node | Webex Teams application or endpoint | 5004 | 52100 to 52299 | AF41 | Video |
Ports and Protocols for Webex Meetings Traffic
|
Purpose |
Source |
Destination |
Source IP |
Source Port |
Transport Protocol |
Destination IP |
Destination Port |
|---|---|---|---|---|---|---|---|
|
Calling to meeting |
Apps (Webex App desktop and mobile apps) Webex registered devices |
Video Mesh node |
As required |
Any |
UDP and TCP (Used by the Webex App) SRTP (Any) |
Any** |
5004 |
|
SIP device calling to meeting (SIP signaling) |
Unified CM or Cisco Expressway call control |
Video Mesh node |
As required |
Ephemeral (>=1024) |
TCP or TLS |
Any** |
5060 or 5061 |
|
Cascade |
Video Mesh node |
Webex cloud |
As required |
34000 to 34999 |
UDP, SRTP (Any)* |
Any** |
5004 50000 to 53000*** |
|
Cascade |
Video Mesh node |
Video Mesh node |
As required |
34000 to 34999 |
UDP, SRTP (Any)* |
Any** |
5004 |
Port 5004 is used for all cloud media and on-premises Video Mesh nodes. Webex App continue to connect to Video Mesh nodes over shared ports 5004. These ports are also used by Webex App and Webex registered endpoints for STUN tests to Video Mesh nodes. Video Mesh node to Video Mesh node for cascades use destination port range of 10000–40000.* TCP is also supported, but not preferred because it may affect media quality. |
** If you want to restrict by IP addresses, see the IP address ranges that are documented in Network Requirements for Webex Services.
*** The Expressway already uses this port range for the Webex cloud. So, most deployments won't require any updates to support this new requirement for Video Mesh. But, if your deployment has more stringent firewall rules, you might need to update your firewall configuration to open these ports for Video Mesh.
For the best experience using Webex in your organization, configure your firewall to allow all outbound TCP and UDP traffic that is destined toward ports 5004 as well as any inbound replies to that traffic. The port requirements that are listed above assume that Video Mesh nodes are deployed either in the LAN (preferred) or in a DMZ and that Webex App are in the LAN.
Video Quality and Scaling for Video Mesh
Below are some common meeting scenarios when a cascade is created. Video Mesh is adaptive depending on the available bandwidth and distributes resources accordingly. For devices in the meeting that use the Video Mesh node, the cascade link provides the benefit of reducing average bandwidth and improving the meeting experience for the user.
For bandwidth provisioning and capacity planning guidelines, see the Preferred Architecture documentation. |
Based on the active speakers in the meeting, the cascade links are established. Each cascade can contain up to 6 streams and the cascade is limited to 6 participants (6 in the direction of Webex app/SIP to Webex cloud and 5 in the opposite direction). Each media resource (cloud and Video Mesh) ask the remote side for the streams that are needed to fulfil the local endpoint requirements of all remote participants across the cascade.
To provide a flexible user experience, the Webex platform can do multistream video to meeting participants. This same ability applies to the cascade link between Video Mesh nodes and the cloud. In this architecture, the bandwidth requirements vary depending on a number of factors, such as the endpoint layouts.
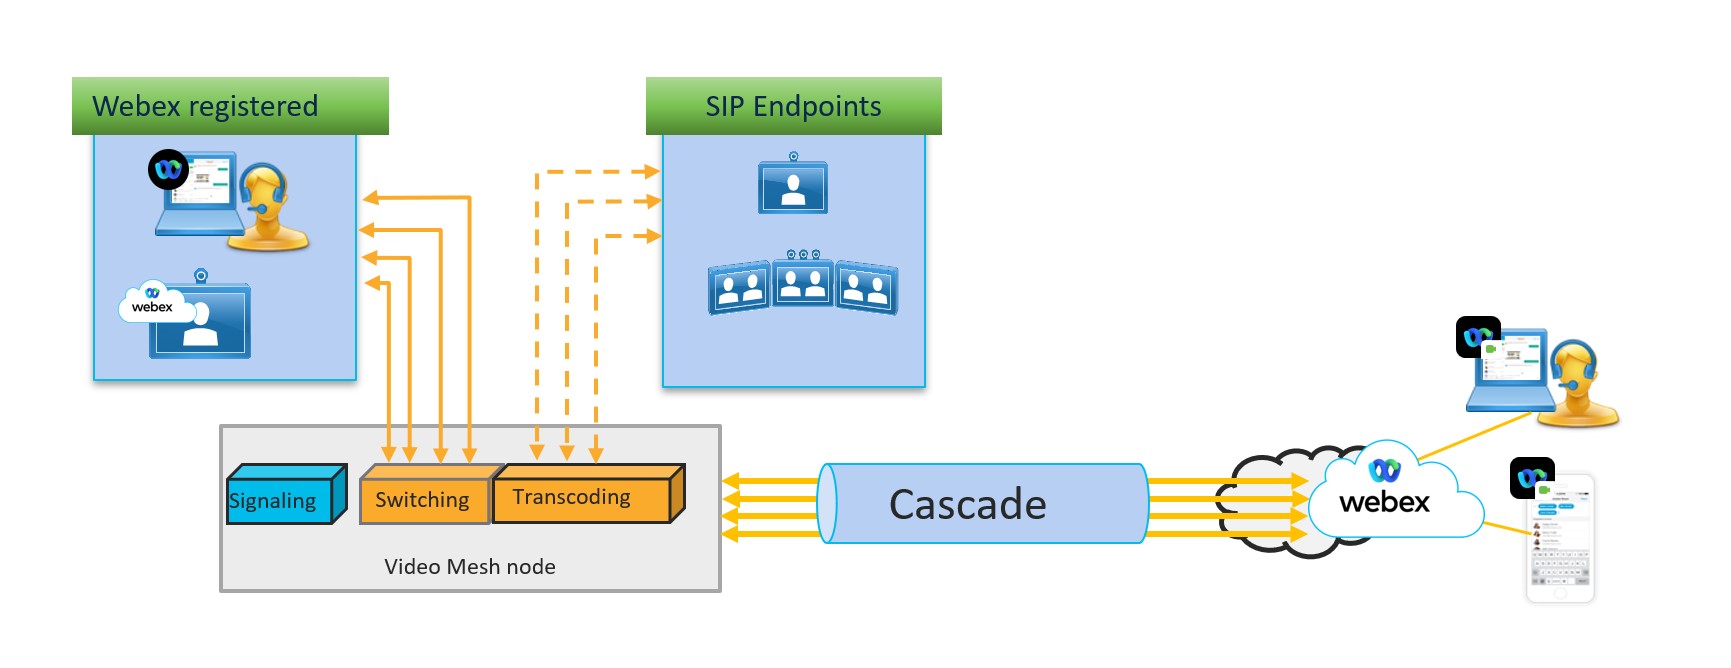
Architecture
In this architecture, Cisco Webex-registered endpoints send signaling to the cloud and media to the switching services. On-premises SIP endpoints send signaling to the call control environment (Unified CM or Expressway), which then sends it to the Video Mesh node. Media is sent to the transcoding service.
Cloud and Premises Participants
Local on-premises participants on the Video Mesh node request the desired streams based on their layout requirements. Those streams are forwarded from the Video Mesh node to the endpoint for local device rendering.
Each cloud and Video Mesh node requests HD and SD resolutions from all participants that are cloud registered-devices or Webex app. Depending on the endpoint, it will send up to 4 resolutions, typically 1080p, 720p, 360p, and 180p.
Cascades
Most Cisco endpoints can send 3 or 4 streams from a single source in a range of resolutions (from 1080p to 180p). The layout of the endpoint dictates the requirement for the streams needed on the far end of the cascade. For active presence, the main video stream is 1080p or 720p, the video panes (PiPS) are 180p. For equal view, the resolution is 480p or 360p for all participants in most cases. The cascade created between Video Mesh nodes and the cloud also sends 720p, 360p and 180p in both directions. Content is sent as single stream, and audio is sent as multiple streams.
Cascade bandwidth graphs that provide a per-cluster measurement are available in the Analytics menu in Webex Control Hub. You cannot configure cascade bandwidth per meeting in Control Hub.
The maximum negotiated cascade bandwidth per meeting is 20Mbps for main video for all sources and the multiple main video streams that they could send. This maximum value does not include the content channel or audio. |
Main Video With Multiple Layout Example
The following diagrams illustrate an example meeting scenario and how the bandwidth is influenced when multiple factors are at play. In the example, all Webex app and Webex-registered devices are transmitting 1x720p, 1x360p and 1x180p streams to Video Mesh. On the cascade, streams of 720p, 360p, and 180p are transmitted in both directions. The reason is because there are Webex app and Webex-registered devices that are receiving 720p, 360p and 180p on both sides of the cascade.
In the diagrams, the bandwidth numbers for transmitted and received data are for example purposes only. They are not an exhaustive coverage of all possible meetings and accompanying bandwidth requirements. Different meeting scenarios (joined participants, device capabilities, content sharing within the meeting, activity at any given point in time during the meeting) will yield different bandwidth levels. |
The diagram below shows a meeting with cloud and premises registered endpoints and an active speaker.
In the same meeting, the diagram below shows an example of a cascade created between the Video Mesh nodes and the cloud in both directions.
In the same meeting, the diagram below shows an example of a cascade from the cloud.
The diagram below shows a meeting with the same devices above, along with a Webex Meetings client. The system sends the active speaker and last active speaker in high definition, along with an extra HD stream of the active speaker for Webex Meeting clients because Video Mesh nodes do not support the Webex Meetings at this time.
Requirements for Webex Services
Work with your partner, customer success manager (CSM), or trials representative to correctly provision the Cisco Webex site and Webex services for Video Mesh:
-
You must have a Webex organization with a paid subscription to Webex services.
-
To take full advantage of Video Mesh, make sure your Webex site is on video platform version 2.0. (You can verify that your site is on video platform version 2.0 if it has the Media Resource Type list available in the Cloud Collaboration Meeting Room site options.)
-
You must enable CMR for your Webex site under user profiles. (You can do this in a bulk update CSV with the SupportCMR attribute).
For further information, see Feature Comparison and Migration Path from Collaboration Meeting Room Hybrid to Video Mesh in the Appendix.
Verify That the Source Country Is Correct
Video Mesh uses the globally distributed media (GDM) capabilities of Webex to achieve better media routing. To achieve optimal connectivity, Webex selects the nearest cloud media node to your enterprise when performing Video Mesh cascades to Webex. Traffic then passes through the Webex backbone to interact with the Webex microservices for the meeting. This routing minimizes latency and keeps most of the traffic on the Webex backbone and off the internet.
To support GDM, we use MaxMind as the GeoIP location provider for this process. Verify that MaxMind correctly identifies the location of your Public IP address to ensure efficient routing.
| 1 |
In a web browser, enter this URL with the public IP address of your Expressway or endpoint at the end. You receive a response like the following: |
| 2 |
Verify that the |
| 3 |
If the location is incorrect, submit a request to correct the location of your public IP address to MaxMind at https://support.maxmind.com/geoip-data-correction-request/correct-a-geoip-location. |
Complete the Prerequisites for Video Mesh
Use this checklist to ensure you are ready to install and configure Video Mesh nodes and integrate a Webex site with Video Mesh.
| 1 |
Ensure that you:
| ||
| 2 |
Work with your partner, customer success manager, or trials representative to understand and prepare your Webex environment so that it's ready to connect to Video Mesh. For more information, see Requirements for Webex Services. | ||
| 3 |
Record the following network information to assign to your Video Mesh nodes:
| ||
| 4 |
Before starting installation, make sure your Webex organization is enabled for Video Mesh. This service is available for organizations with certain paid Webex service subscriptions as documented in License Requirements for Cisco Webex Hybrid Services. Contact your Cisco partner or account manager for assistance. | ||
| 5 |
Choose a supported hardware or specifications-based configuration for your Video Mesh node, as described in System and Platform Requirements for Video Mesh Node Software. | ||
| 6 |
Make sure your server is running VMware ESXi 7 or 8, and vSphere 7 or 8, with a VM host operational. | ||
| 7 |
If you're integrating Video Mesh with your Unified CM call control environment and you want the participant lists to be consistent across meeting platforms, make sure your Unified CM cluster security mode is set to mixed mode so that it supports TLS-encrypted traffic. End-to-end encrypted traffic is required for this functionality to work. See the TLS setup chapter in the Security Guide for Cisco Unified Communications Manager for more information about switching your Unified CM environment to mixed mode. See the Active Control solution guide for more information about the features and about how to set up end-to-end encryption. | ||
| 8 |
If you're integrating a proxy (explicit, transparent inspecting, or transparent non-inspecting) with Video Mesh, make sure you following the requirements as documented in Requirements for Proxy Support for Video Mesh. |
What to do next
Video Mesh Deployment Task Flow
Before you begin
| 1 |
Install and Configure Video Mesh Node Software Use this procedure to deploy a Video Mesh Node to your host server running VMware ESXi or vCenter. You install the software on-premises which creates a node and then perform initial configuration, such as network settings. You'll register it to the cloud later. |
| 2 |
Log in to the Video Mesh Node Console Sign in to the console for the first time. The Video Mesh Node software has a default password. You need to change this value before you configure the node. |
| 3 |
Set the Network Configuration of the Video Mesh Node in the Console Use this procedure to configure the network settings for the Video Mesh Node if you didn't configure them when you set up the node on a virtual machine. You'll set a static IP address and change the FQDN/hostname and NTP servers. DHCP is not currently supported. |
| 4 |
Use these steps to configure the external interface for a dual network interface (dual NIC) deployment: After the node is back online and you verified the internal network configuration, you can configure the external network interface if you're deploying the Video Mesh Node in your network's DMZ so that you can isolate the enterprise (internal) traffic from the outside (external) traffic. You can also make exceptions or overrides to the default routing rules. |
| 5 |
Register the Video Mesh Node to the Webex Cloud Use this procedure to register Video Mesh nodes to the Webex cloud and complete additional configuration. When you use Control Hub to register your node, you create a cluster to which the node is assigned. A cluster contains one or more media nodes that serve users in a specific geographic region. The registration steps also configure SIP call settings, set an upgrade schedule, and subscribe to email notifications. |
| 6 |
Enable and verify Quality of Service (QoS) with the following tasks:
Enable QoS if you want Video Mesh nodes to automatically mark SIP traffic (on-premises SIP registered endpoints) for both audio (EF) and video (AF41) separately with appropriate class of service and use well-known port ranges for specific media types. This change will let you create QoS policies and effectively remark return traffic from the cloud if desired. Use the Reflector Tool steps to verify the correct ports are opened on your firewall. |
| 7 |
Configure Video Mesh Node for Proxy Integration Use this procedure to specify the type of proxy that you want to integrate with a Video Mesh. If you choose a transparent inspecting proxy, you can use the node's interface to upload and install the root certificate, check the proxy, and troubleshoot any potential issues. |
| 8 |
Follow Integrate Video Mesh With Call Control Task Flow and choose one of the following, depending on your call control, security requirements, and whether you want to integrate Video Mesh with your call control environment:
SIP devices don't support direct reachability, so you must use Unified CM or VCS Expressway configuration to establish a relationship between on-premises registered SIP devices and your Video Meshclusters. You only need to trunk your Unified CM or VCS Expressway to Video Mesh Node, depending on your call control environment. |
| 9 |
Exchange Certificate Chains Between Unified CM and Video Mesh Nodes In this task, you download certificates from the Unified CM and Video Mesh interfaces and upload one to the other. This step establishes secure trust between the two products and, in conjunction with the secure trunk configuration, allows encrypted SIP traffic and SRTP media in your organization to land on Video Mesh nodes. |
| 10 |
Enable Media Encryption for the Organization and Video Mesh Clusters Use this procedure to turn on media encryption for your organization and individual Video Mesh clusters. This setting forces end-to-end TLS setup and you must have a secure TLS SIP trunk in place on your Unified CM that points to your Video Mesh nodes. |
| 11 |
Enable Video Mesh for the Webex Site To use optimized media to the Video Mesh Node for a Webex meeting to all the Webex app and devices to join, this configuration needs to be enabled for the Webex site. Enabling this setting links Video Mesh and meeting instances in the cloud together and allows cascades to occur from Video Mesh nodes. If this setting is not enabled, the Webex app and devices will not use the Video Mesh node for Webex meetings. |
| 12 | |
| 13 |
Verify the meeting experience on the secure endpoint If you are using media encryption through the end-to-end TLS setup, use these steps to verify that the endpoints are securely registered and the correct meeting experience appears. |
Bulk Provisioning Script for Video Mesh
If you need to deploy many nodes in your Video Mesh deployment, the process is time-consuming. You can use the script at https://github.com/CiscoDevNet/webex-video-mesh-node-provisioning to deploy Video mesh nodes on VMWare ESXi servers quickly. Read through the readme file for instructions on using the script.
Install and Configure Video Mesh Node Software
Use this procedure to deploy a Video Mesh Node to your host server running VMware ESXi or vCenter. You install the software on-premises which creates a node and then perform initial configuration, such as network settings. You'll register it to the cloud later.
You must download the software package (OVA) from Control Hub ( https://admin.webex.com), rather than using a previously downloaded version. This OVA is signed by Cisco certificates and can be downloaded after you sign in to Control Hub with your customer administrator credentials.
Before you begin
-
See System and Platform Requirements for Video Mesh Node Software for supported hardware platforms and specifications requirements for the Video Mesh Node.
-
Make sure you have these required items:
-
A computer with:
-
VMware vSphere client 7 or 8.
For a list of supported operating systems, refer to VMware documentation.
-
Video Mesh software OVA file downloaded.
Download the latest Video Mesh software from Control Hub, rather than using a previously downloaded version. You can also access the software from this link. (The file is approximately 1.5 GB.)
Older versions of the software package (OVA) will not be compatible with the latest Video Mesh upgrades. This can result in issues while upgrading the application. Make sure you download the latest version of the OVA file from this link.
-
-
A supported server with VMware ESXi or vCenter 7 or 8 installed and running
-
Disable virtual machine backups and live migration. Video Mesh Node clusters are realtime systems; any virtual machine pauses can make these systems unstable. (For maintenance activities on a Video Mesh Node, use maintenance mode from Control Hub.)
-
| 1 |
Using your computer, open the VMware vSphere client and sign in to the vCenter or ESXi system on the server. | ||||
| 2 |
Go to . | ||||
| 3 |
On the Select an OVF tempate page, click Local File, then Choose Files. Navigate to where the videomesh.ova file is located, choose the file, and then click Next.
| ||||
| 4 |
On the Select a name and folder page, enter a Virtual machine name for the Video Mesh Node (for example, "Video_Mesh_Node_1"), choose a location where the virtual machine node deployment can reside, and then click Next. A validation check runs. After it finishes, the template details appear. | ||||
| 5 |
Verify the template details and then click Next. | ||||
| 6 |
On the Configuration page, choose the type of deployment configuration, and then click Next.
The options are listed in the order of increasing resource requirements.
| ||||
| 7 |
On the Select storage page, ensure that the default disk format of Thick Provision Lazy Zeroed and VM storage policy of Datastore Default are selected and then click Next. | ||||
| 8 |
On the Select networks page, choose the network option from the list of entries to provide the desired connectivity to the VM.
For a DMZ deployment, you can set up the Video Mesh node with the dual network interface (NIC). This deployment lets you separate the internal enterprise network traffic (used for interbox communication, cascades between node clusters, and to access the node's management interface) from the external cloud network traffic (used for connectivity to the outside world and cascades to Webex). All nodes in a cluster must be in dual NIC mode; a mixture of single and dual NIC is not supported.
| ||||
| 9 |
On the Customize template page, configure the following network settings:
If preferred, you can skip the network setting configuration and follow the steps in Set the Network Configuration of the Video Mesh Node in the Console after you sign into the node. | ||||
| 10 |
On the Ready to Complete page, verify that all the settings that you entered match the guidelines in this procedure, and then click Finish. After deployment of the OVA is complete, your Video Mesh Node appears in the list of VMs. | ||||
| 11 |
Right-click the Video Mesh Node VM, and then choose . The Video Mesh Node software is installed as a guest on the VM Host. You are now ready to sign in to the console and configure the Video Mesh Node. You may experience a delay of a few minutes before the node containers come up. A bridge firewall message appears on the console during first boot, during which you can't sign in. |
What to do next
Log in to the Video Mesh Node Console
Sign in to the console for the first time. The Video Mesh Node software has a default password. You need to change this value before you configure the node.
| 1 |
From the VMware vSphere client, go to the Video Mesh Node VM, and then choose Console. The Video Mesh Node VM boots up and a login prompt appears. If the login prompt does not appear, press Enter. You may briefly see a message that indicates the system is being initialized. |
| 2 |
Use the following default username and password to log in: Because you are logging in to the Video Mesh Node for the first time, you must change the administrator passphrase (password). |
| 3 |
For (current) password, enter the default password (from above), and then press Enter. |
| 4 |
For new password, enter a new passphrase, and then press Enter. |
| 5 |
For retype new password, retype the new passphrase, and then press Enter. A "Password successfully changed" message appears, and then the initial Video Mesh Node screen appears with a message about unauthorized access being prohibited. |
| 6 |
Press Enter to load the main menu. |
What to do next
Set the Network Configuration of the Video Mesh Node in the Console
Set the Network Configuration of the Video Mesh Node in the Console
Use this procedure to configure the network settings for the Video Mesh Node if you didn't configure them when you set up the node on a virtual machine. You'll set a static IP address and change the FQDN/hostname and NTP servers. DHCP is not currently supported.
These steps are required if you didn't configure network settings at the time of OVA deployment.
The inside interface (the default interface for traffic) is used for CLI, SIP trunks, SIP traffic and node management. The outside (external) interface is for HTTPS and websockets communication to Webex, along with the cascades traffic from the nodes to Webex. |
| 1 |
Open the node console interface through the VMware vSphere client and then sign in using the admin credentials. After first time setup of the network settings and if the Video Mesh is reachable, you can access the node interface through secure shell (SSH). | ||
| 2 |
From the main menu of the Video Mesh Node console, choose option 2 Edit Configuration and then click Select. | ||
| 3 |
Read the prompt that the calls will end on the Video Mesh Node, and then click Yes. | ||
| 4 |
Click Static, enter the IP address for the internal interface, Mask, Gateway, and DNS values for your network.
| ||
| 5 |
Enter your organization's NTP server or another external NTP server that can be used in your organization. After you configure the NTP server and save network settings, you can follow the steps in Check Health of Video Mesh Node From Console to verify that the time is synchronizing correctly through the specified NTP servers.
| ||
| 6 |
(Optional) Change the hostname or domain, if required.
| ||
| 7 |
Click Save, and then click Save Changes & Reboot. During the save, DNS validation is performed if you provided a domain. A warning is displayed if the FQDN (hostname and domain) is not resolvable using the DNS server addresses provided. You may choose to save by ignoring the Warning, but calls will not work until the FQDN can resolve to the DNS configured on the node. After the Video Mesh Node reboots, the network configuration changes take effect. |
What to do next
Once the software image is installed and configured with the network settings (IP Address, DNS, NTP, and so on) and accessible on the enterprise network, you can move to the next step of securely registering it to the cloud. The IP address that is configured on the Video Mesh Node is accessible only from the enterprise network. From a security perspective, the node is hardened whereby only customer administrators can access the node interface to perform configuration.
Set The External Network Interface of the Video Mesh Node
After the node is back online and you verified the internal network configuration, you can configure the external network interface if you're deploying the Video Mesh Node in your network's DMZ so that you can isolate the enterprise (internal) traffic from the outside (external) traffic.
| 1 |
From the main menu of the Video Mesh Node console, choose option 5 External IP Configuration and then click Select. | ||
| 2 |
Click 1 Enable/Disable, then Select, and then Yes to enable the external IP address options on the node. | ||
| 3 |
As you did with the initial network configuration, enter the IP Address (external), Mask, and Gateway values.
| ||
| 4 |
Click Save and Restart. The node once again reboots to enable the dual IP address, and then automatically configures the basic static routing rules. These rules determine that traffic to and from a private class IP address uses an internal interface; traffic to and from a public class IP address uses an external interface. Later, you can create your own routing rules—For example, if you need to configure an override and allow access to an external domain from the internal interface.
| ||
| 5 |
To validate the internal and external IP address configuration, from the main menu of the console, go to 4 Diagnostics, and then choose Ping. | ||
| 6 |
In the ping field, enter a destination address that you want to test, such as an external destination or an internal IP address, and then click OK.
|
What to do next
Video Mesh Node APIs
Video Mesh Node APIs enable organization admins to manage password, internal & external network settings, maintenance mode and server certificates related to Video Mesh Nodes. These APIs can be invoked via any API tool like Postman, or you can create your own script to call them. The user needs to call the APIs using the appropriate endpoint (you can use either node IP or FQDN), method, body, headers, authorization, etc. to perform the desired action and get a suitable response, as per the information provided below.
VMN Administration APIs
Video Mesh Administration APIs enable organization admins to manage maintenance mode and admin account password of the Video Mesh Nodes.
Get the Maintenance Mode status
Retrieves the current maintenance mode status (Expected status: on, off, pending or requested).
[GET] https://<node_ip>/api/v1/external/maintenanceMode
Authorization: Basic Authentication utilizing the Video Mesh username (‘admin’) and the password.
Sample Responses:
Sample Response 1:
{
    "status": {
        "code": 200,
        "message": "Success"
    },
    "result": {
        "isRegistered": true,
        "maintenanceMode": "pending/requested/on/off",
        "maintenanceModeLastUpdated": 1691135731847
    }
}
Sample Response 2:
{
    "status": {
        "code": 401,
        "message": "login failed: incorrect password or username"
    }
}
Sample Response 3:
{
    "status": {
        "code": 429,
        "message": "Too Many Requests"
    }
}
Enable or Disable Maintenance Mode
When you place a Video Mesh node into maintenance mode, it does a graceful shutdown of calling services (stops accepting new calls and waits up to 2 hours for existing calls to complete).
[PUT] https://<node_ip>/api/v1/external/maintenanceMode
Call this API only when there are no active calls. |
Authorization: Basic Authentication utilizing the Video Mesh username (‘admin’) and the password.
Body:
{
      "maintenanceMode": "on"
}-
maintenanceMode - Status of Maintenance Mode to be set - "on" or "off".
Request Headers:
'Content-type': 'application/json'
Sample Responses:
Sample Response 1:
{
        "status": {
            "code": 200,
            "message": "Your request to enable/disable maintenance mode was successful."
    }
}
Sample Response 2:
{
      "status": {
          "code": 409,
          "message": "Maintenance Mode is already on/off"
    }
}
Sample Response 3 :
{
      "status": {
          "code": 400,
          "message": "Bad Request - wrong input"
    }
}
Change admin password
Changes the admin user's password.
[PUT] https://<node_ip>/api/v1/external/password
Authorization: Basic Authentication utilizing the Video Mesh username (‘admin’) and the password.
Body:
{
  "newPassword": "new"
}-
newPassword- The new password to be set for the 'admin' account of the Video Mesh Node.
Request Headers:
'Content-type': 'application/json'
Sample Responses:
Sample Response 1:
{
    "status": {
        "code": 200,
        "message": "Successfully set the new passphrase for user admin."
    }
}
Sample Response 2:
{
    "status": {
        "code": 400,
        "message": "Enter a new passphrase that wasn't used for one of the previous 3 passphrases."
    }
}
VMN Network APIs
Video Mesh Network APIs enable organization admins to manage internal and external network settings.
Get External Network Configuration
Detects if the external network is enabled or disabled. If the external network is enabled, it also fetches the External IP Address, External Subnet Mask and the External Gateway.
[GET] https://<node_ip>/api/v1/external/externalNetwork
Authorization: Basic Authentication utilizing the Video Mesh username (‘admin’) and the password.
Sample Responses:
Sample Response 1:
{
    "status": {
        "code": 200,
        "message": "Successfully fetched external network configuration."
    },
    "result": {
        "ip": "1.1.1.1",
        "mask": "2.2.2.2",
        "gateway": "3.3.3.3"
    }
}
Sample Response 2:
{
    "status": {
        "code": 200,
        "message": "External network not enabled."
    }
}
Sample Response 3:
{
    "status": {
        "code": 500,
        "message": "Failed to get external network configuration."
    }
}
Edit External Network Configuration
Changes the External Network settings. This API can be used to either enable the external network along with setting or editing the External Network Interface with External IP Address, External Subnet Mask and External Gateway. It can also be used to disable the external network. After you make external network configuration changes, the node reboots to apply these changes.
[PUT] https://<node_ip>/api/v1/external/externalNetwork
You can configure this only for newly deployed Video Mesh Nodes, whose default admin password has changed. Do not use this API after registering the node to an organisation. |
Authorization: Basic Authentication utilizing the Video Mesh username (‘admin’) and the password.
Body:
Enabling external network:
{
  "externalNetworkEnabled": true,
  "externalIp": "1.1.1.1",
  "externalMask": "2.2.2.2",
  "externalGateway": "3.3.3.3"
}
Disabling external network:
{
  "externalNetworkEnabled": false
}-
externalNetworkEnabled- Boolean value (true or false) to enable/disable External Network
-
externalIp - The External IP to be added
-
externalMask - The Netmask for the External Network
-
externalGateway - The Gateway for the External Network
Request Headers:
'Content-type': 'application/json'
Sample Responses:
Sample Response 1:
{
    "status": {
        "code": 200,
        "message": "Successfully saved the external network configuration. This node will reboot soon to apply the changes. Please wait for a minute and relogin to the node to verify that all changes were applied."
    }
}
Sample Response 2:
{
    "status": {
        "code": 200,
        "message": "Successfully disabled the external network. This node will reboot soon to apply the changes. Please wait for a minute and relogin to the node to verify that all changes were applied."
    }
}
Sample Response 3:
{
    "status": {
        "code": 400,
        "message": "One or more errors in the input: Value should be boolean for 'externalNetworkEnabled'"
    }
}
Sample Response 4:
{
    "status": {
        "code": 400,
        "message": "External network configuration has not changed; skipping save of the external network configuration."
    }
}
Get Internal Network details
Retrieves the internal network configuration details which includes Network Mode, IP Address, Subnet Mask, Gateway, DNS Caching details, DNS servers, NTP servers, Internal Interface MTU, Hostname and Domain.
[GET] https://<node_ip>/api/v1/external/internalNetwork
Authorization: Basic Authentication utilizing the Video Mesh username (‘admin’) and the password.
Sample Responses:
Sample Response 1:
{
    "status": {
        "code": 200,
        "message": "Successfully fetched internal network details"
    },
    "result": {
        "dhcp": false,
        "ip": "1.1.1.1",
        "mask": "2.2.2.2",
        "gateway": "3.3.3.3",
        "dnsCaching": false,
        "dnsServers": [
            "4.4.4.4",
            "5.5.5.5"
        ],
        "mtu": 1500,
        "ntpServers": [
            "6.6.6.6"
        ],
        "hostName": "test-vmn",
        "domain": ""
    }
}
Sample Response 2:
{
      "status": {
          "code": 500,
          "message": "Failed to get Network details."
    }
}
Sample Response 3:
{
      "status": {
          "code": 500,
          "message": "Failed to get host details."
    }
}
Edit DNS servers
Updates DNS Servers with new ones.
[PUT] https://<node_ip>/api/v1/external/internalNetwork/dns
Place the Node in Maintenance Mode before making this change. See Enable or Disable Maintenance Mode for more information on moving a node into maintenance mode. |
Authorization: Basic Authentication utilizing the Video Mesh username (‘admin’) and the password.
Body:
{
    "dnsServers": "1.1.1.1 2.2.2.2"
}-
dnsServers - DNS servers to be updated. Multiple space-separated DNS servers are allowed.
Request Headers:
'Content-type': 'application/json'
Sample Responses:
Sample Response 1:
{
    "status": {
        "code": 200,
        "message": "Successfully saved DNS servers"
    }
}
Sample Response 2:
{
    "status": {
        "code": 409,
        "message": "Requested DNS server(s) already exist."
    }
}
Sample Response 3:
{
    "status": {
        "code": 424,
        "message": "Maintenance Mode is not enabled. Kindly enable Maintenance Mode and try again for this node."
    }
}
Edit NTP servers
Updates NTP servers with new ones.
[PUT] https://<node_ip>/api/v1/external/internalNetwork/ntp
Place the Node in Maintenance Mode before making this change. See Enable or Disable Maintenance Mode for more information on moving a node into maintenance mode. |
Authorization: Basic Authentication utilizing the Video Mesh username (‘admin’) and the password.
Body:
{
    "ntpServers": "1.1.1.1 2.2.2.2"
}-
ntpServers - NTP servers to be updated. Multiple space-separated NTP servers are allowed.
Request Headers:
'Content-type': 'application/json'
Sample Responses:
Sample Response 1:
{
    "status": {
        "code": 200,
        "message": "Successfully saved the NTP servers."
    }
}
Sample Response 2:
{
    "status": {
        "code": 409,
        "message": "Requested NTP server(s) already exist."
    }
}
Sample Response 3:
{
    "status": {
        "code": 424,
        "message": "Maintenance Mode is not enabled. Kindly enable Maintenance Mode and try again for this node."
    }
}
Edit host name and domain
Updates the Hostname and Domain of the Video Mesh Node.
[PUT] https://<node_ip>/api/v1/external/internalNetwork/host
Place the Node in Maintenance Mode before making this change. The Node reboots to apply the change. See Enable or Disable Maintenance Mode for more information on moving a node into maintenance mode. |
Authorization: Basic Authentication utilizing the Video Mesh username (‘admin’) and the password.
Body:
{
    "hostName": "test-vmn",
    "domain": "abc.com"
}-
hostName - The new hostname of the node.
-
domain - The new domain for the hostname of the node (optional).
Request Headers:
'Content-type': 'application/json'
Sample Responses:
Sample Response 1:
{
    "status": {
        "code": 200,
        "message": "Successfully saved the host FQDN. This node will reboot soon to apply the changes. Please wait for a minute and relogin to the node to verify that all changes were applied."
    }
}
Sample Response 2:
{
    "status": {
        "code": 400,
        "message": "Unable to resolve FQDN"
    }
}
Sample Response 3:
{
    "status": {
        "code": 409,
        "message": "Entered hostname and domain already set to same."
    }
}
Enable or Disable DNS Caching
Enables or Disables DNS Caching. Consider enabling caching if DNS checks often take over 750 ms to resolve, or if recommended by Cisco Support.
[PUT] https://<node_ip>/api/v1/external/internalNetwork/dnsCaching
Place the Node in Maintenance Mode before making this change. The Node reboots to apply the change. See Enable or Disable Maintenance Mode for more information on moving a node into maintenance mode. |
Authorization: Basic Authentication utilizing the Video Mesh username (‘admin’) and the password.
Body:
{
    "dnsCaching": true
}-
dnsCaching - DNS Caching Configuration. Accepts Boolean value (true or false).
Request Headers:
'Content-type': 'application/json'
Sample Responses:
Sample Response 1:
{
    "status": {
        "code": 200,
        "message": "Successfully saved DNS settings changes. This node will reboot soon to apply the changes. Please wait for a minute and relogin to the node to verify that all changes were applied."
    }
}
Sample Response 2:
{
    "status": {
        "code": 400,
        "message": "One or more errors in the input: 'dnsCaching' field value should be a boolean"
    }
}
Sample Response 3:
{
    "status": {
        "code": 409,
        "message": "dnsCaching is already set to false"
    }
}
Edit Interface MTU
Changes the Maximum Transmission Unit (MTU) for the node's network interfaces from the default value of 1500. Values between 1280 and 9000 are allowed.
[PUT] https://<node_ip>/api/v1/external/internalNetwork/mtu
Place the Node in Maintenance Mode before making this change. The Node reboots to apply the change. See Enable or Disable Maintenance Mode for more information on moving a node into maintenance mode. |
Authorization: Basic Authentication utilizing the Video Mesh username (‘admin’) and the password.
Body:
{
    "internalInterfaceMtu": 1500
}-
internalInterfaceMtu - Maximum Transmission Unit for the node's network interfaces. The value should be between 1280 and 9000.
Request Headers:
'Content-type': 'application/json'
Sample Responses:
Sample Response 1:
{
    "status": {
        "code": 200,
        "message": "Successfully saved the internal interface MTU settings. This node will reboot soon to apply the changes. Please wait for a minute and relogin to the node to verify that all changes were applied."
    }
}
Sample Response 2:
{
    "status": {
        "code": 400,
        "message": "One or more errors in the input: 'internalInterfaceMtu' field value should be a number"
    }
}
Sample Response 3:
{
    "status": {
        "code": 400,
        "message": "Please enter a number between 1280 and 9000."
    }
}
VMN Server Certificate APIs
Video Mesh Server Certificate APIs enable organization admins to create, update, download, and delete the certificates related to Video Mesh Nodes. For more information, see Exchange Certificate Chains Between Unified CM and Video Mesh Nodes.
Create the CSR certificate
Generates a CSR (Certificate Signing Request) certificate, and the private key, based on the details provided.
[POST] https://<node_ip>/api/v1/externalCertManager/generateCsr
Authorization: Basic Authentication utilizing the Video Mesh username (‘admin’) and the password.
Body:
{
    "csrInfo":
    {
         "commonName": "1.2.3.4",
         "emailAddress": "abc@xyz.com",
         "altNames": "1.1.1.1 2.2.2.2",
         "organization": "VMN",
         "organizationUnit": "IT",
         "locality": "BLR",
         "state": "KA",
         "country": "IN",
         "passphrase": "",
         "keyBitSize": 2048
    }
}-
commonName - IP/FQDN of the Video Mesh Node given as common name. (mandatory)
-
emailAddress - User's Email Address. (optional)
-
altNames - Subject Alternative Name(s) (optional). Multiple space separated FQDNs are allowed. If provided, it must contain the common name. If altNames are not provided, it takes the commonName as the value of altNames.
-
organization - Organization/Company name. (optional)
-
organizationUnit - Organizational Unit or Department or Group Name, etc. (optional)
-
locality - City/Locality. (optional)
-
state - State/Province. (optional)
-
country - Country/Region. Two-letter abbreviation. Do not provide more than two letters. (optional)
-
passphrase - Private Key Passphrase. (optional)
-
keyBitSize - Private Key Bit Size. Accepted values are 2048, by default, or 4096. (optional)
Request Headers:
Content-Type: 'application/json'
Sample Responses:
Sample Response 1:
{
    "status": {
        "code": 200,
        "message": "Successfully generated CSR"
    },
    "result": {
        "caCert": {},
        "caKey": {
            "fileName": "VideoMeshGeneratedPrivate.key",
            "localFileName": "CaPrivateKey.key",
            "fileLastModified": "Fri Jul 21 2023 08:12:25 GMT+0000 (Coordinated Universal Time)",
            "uploadDate": 1689927145422,
            "size": 1678,
            "type": "application/pkcs8",
            "modulus": "S4MP1EM0DULU2"
        },
        "certInstallRequestPending": false,
        "certInstallStarted": null,
        "certInstallCompleted": null,
        "isRegistered": true,
        "caCertsInstalled": false,
        "csr": {
            "keyBitsize": 2048,
            "commonName": "1.2.3.4",
            "organization": "VMN",
            "organizationUnit": "IT",
            "locality": "BLR",
            "state": "KA",
            "country": "IN",
            "emailAddress": "abc@xyz.com",
            "altNames": [
                "1.1.1.1",
                "2.2.2.2"
            ],
            "csrContent": "-----BEGIN CERTIFICATE REQUEST-----\nS4MP1E_C3RT_C0NT3NT\n-----END CERTIFICATE REQUEST-----"
        },
        "encryptedPassphrase": null
    }
}
Sample Response 2:
{
    "status": {
        "code": 400,
        "message": "Private key already exists. Delete it before generating new CSR."
    }
}
Sample Response 3:
{
    "status": {
        "code": 400,
        "message": "CSR certificate already exists. Delete it before generating new CSR."
    }
}
Sample Response 4:
{
    "status": {
        "code": 400,
        "message": "CSR certificate and private key already exist. Delete them before generating new CSR."
    }
}
Sample Response 5:
{
    "status": {
        "code": 400,
        "message": "There were one or more errors while generating the CSR: The \"Country\" field must contain exactly two A-Z characters."
    }
}
Download the CSR certificate
Downloads the generated CSR certificate.
[GET] https://<node_ip>/api/v1/externalCertManager/csr
You can also download the file through the Send and Download option.
Authorization: Basic Authentication utilizing the Video Mesh username (‘admin’) and the password.
Sample Responses:
Sample Response 1:
-----BEGIN CERTIFICATE REQUEST-----
S4MP1E_C3RT_C0NT3NT
-----END CERTIFICATE REQUEST-----
Sample Response 2:
{
    "status": {
        "code": 404,
        "message": "Could not download, CSR certificate does not exist."
    }
}
Download the private key
Downloads the private key generated along with the CSR certificate.
[GET] https://<node_ip>/api/v1/externalCertManager/key
You can also download the file through the Send and Download option.
Authorization: Basic Authentication utilizing the Video Mesh username (‘admin’) and the password.
Sample Responses:
Sample Response 1:
-----BEGIN RSA PRIVATE KEY-----
S4MP1E_PR1V4T3_K3Y
-----END RSA PRIVATE KEY-----
Sample Response 2:
{
    "status": {
        "code": 404,
        "message": "Could not download, private key does not exist."
    }
}
Delete the CSR certificate
Deletes the existing CSR certificate.
[DELETE] https://<node_ip>/api/v1/externalCertManager/csr
Authorization: Basic Authentication utilizing the Video Mesh username (‘admin’) and the password.
Sample Responses:
Sample Response 1:
{
    "status": {
        "code": 200,
        "message": "Successfully deleted the CSR certificate"
    }
}
Sample Response 2:
{
    "status": {
        "code": 404,
        "message": "CSR certificate does not exist."
    }
}
Delete the private key
Deletes the existing private key.
[DELETE] https://<node_ip>/api/v1/externalCertManager/key
Authorization: Basic Authentication utilizing the Video Mesh username (‘admin’) and the password.
Sample Responses:
Sample Response 1:
{
    "status": {
        "code": 200,
        "message": "Successfully deleted the private key"
    }
}
Sample Response 2:
{
    "status": {
        "code": 404,
        "message": "Private key does not exist."
    }
}
Install the CA signed certificate and private key
Uploads the provided CA signed certificate and the private key on the Video Mesh node and installs the certificate on the node.
[POST] https://<node_ip>/api/v1/externalCertManager/uploadInstallCaCert
Authorization: Basic Authentication utilizing the Video Mesh username (‘admin’) and the password.
Body:
Use 'form-data' to upload the following files:
-
CA Signed Certificate (.crt) file with key as 'crtFile'.
-
Private Key (.key) file with key as 'keyFile'.
Request Headers:
Content-Type: 'multipart/form-data'
Sample Responses:
Sample Response 1:
{
    "status": {
        "code": 200,
        "message": "Successfully installed certificate and key. It might take a few seconds to reflect on the node."
    },
    "result": {
        "caCert": {
            "fileName": "videoMeshCsr.crt",
            "localFileName": "CaCert.crt",
            "fileLastModified": 1689931788598,
            "uploadDate": 1689931788605,
            "size": 1549,
            "type": "application/x-x509-ca-cert",
            "certStats": {
                "version": 0,
                "subject": {
                    "countryName": "IN",
                    "stateOrProvinceName": "KA",
                    "localityName": "BLR",
                    "organizationName": "VMN",
                    "organizationalUnitName": "IT",
                    "emailAddress": "abc@xyz.com",
                    "commonName": "1.2.3.4"
                },
                "issuer": {
                    "countryName": "AU",
                    "stateOrProvinceName": "Some-State",
                    "organizationName": "ABC"
                },
                "serial": "3X4MPL3",
                "notBefore": "2023-07-21T09:28:19.000Z",
                "notAfter": "2024-12-02T09:28:19.000Z",
                "signatureAlgorithm": "sha256WithRsaEncryption",
                "fingerPrint": "11:22:33:44:AA:BB:CC:DD",
                "publicKey": {
                    "algorithm": "rsaEncryption",
                    "e": 65537,
                    "n": "3X4MPL3",
                    "bitSize": 2048
                },
                "altNames": [],
                "extensions": {}
            }
        },
        "caKey": {
            "fileName": "VideoMeshGeneratedPrivate.key",
            "localFileName": "CaPrivateKey.key",
            "fileLastModified": 1689931788629,
            "uploadDate": 1689931788642,
            "size": 1678,
            "type": "application/pkcs8",
            "modulus": "S4MP1EM0DULU2"
        },
        "certInstallRequestPending": true,
        "certInstallStarted": null,
        "certInstallCompleted": null,
        "isRegistered": true,
        "caCertsInstalled": false,
        "csr": {
            "keyBitsize": 2048,
            "commonName": "1.2.3.4",
            "organization": "VMN",
            "organizationUnit": "IT",
            "locality": "BLR",
            "state": "KA",
            "country": "IN",
            "emailAddress": "abc@xyz.com",
            "altNames": [
                "1.1.1.1",
                "2.2.2.2"
            ],
            "csrContent": "-----BEGIN CERTIFICATE REQUEST-----\nS4MP1E_C3RT_C0NT3NT\n-----END CERTIFICATE REQUEST-----"
        },
        "encryptedPassphrase": null
    }
}
Sample Response 2:
{
    "status": {
        "code": 400,
        "message": "Could not parse the certificate file. Make sure it is a properly formatted certificate and try again."
    }
}
Sample Response 3:
{
    "status": {
        "code": 400,
        "message": "Private Key does not match Certificate (different modulus)"
    }
}
Sample Response 4:
{
    "status": {
        "code": 202,
        "message": "Certificate and private key PENDING installation. It might take a few seconds to reflect on the node. If the node is in maintenance mode, it will get installed once it is disabled."
    }
}
Download the CA signed certificate
Downloads the CA signed certificate installed on the node.
[GET] https://<node_ip>/api/v1/externalCertManager/caCert
You can also download the file through the Send and Download option.
Authorization: Basic Authentication utilizing the Video Mesh username (‘admin’) and the password.
Sample Responses:
Sample Response 1:
-----BEGIN CERTIFICATE-----
S4MP1E_C3RT_C0NT3NT
-----END CERTIFICATE-----
Sample Response 2:
{
    "status": {
        "code": 404,
        "message": "Could not download, CA certificate does not exist."
    }
}
Delete the CA signed certificate
Deletes the CA signed certificate installed on the node.
[DELETE] https://<node_ip>/api/v1/externalCertManager/caCert
Authorization: Basic Authentication utilizing the Video Mesh username (‘admin’) and the password.
Sample Responses:
Sample Response 1:
{
    "status": {
        "code": 200,
        "message": "Successfully deleted the CA certificate."
    }
}
Sample Response 2:
{
    "status": {
        "code": 404,
        "message": "CA certificate does not exist."
    }
}
Common API Responses
Listed below are some sample responses that you might encounter while using any of the APIs mentioned above.
Sample Response 1: Wrong Credentials provided in the Basic Authorization.
{
    "status": {
        "code": 401,
        "message": "login failed: incorrect password or username"
    }
}
Sample Response 2: VMN is not upgraded to the required version that supports these APIs.
{
    "status": {
        "code": 421,
        "message": "Misdirected Request 1:[undefined]"
    }
}
Sample Response 3: Wrong referer entered in the header (when header wasn't expected).
{
    "status": {
        "code": 421,
        "message": "Misdirected Request 2:[https://x.x.x.x/setup]"
    }
}
Sample Response 4: Rate limit exceeded, try after some time.
{
    "status": {
        "code": 429,
        "message": "Too Many Requests"
    }
}
Add Internal and External Routing Rules
In a dual network interface (NIC) deployment, you can fine tune the routing for Video Mesh nodes by adding user-defined route rules for external and internal interfaces. The default routes are added to the nodes, but you can make exceptions—for example, external subnets or host addresses that need to be accessed through the internal interface, or internal subnets or host addresses that need to be accessed from the external interface. Perform the following steps as needed.
| 1 |
From the Video Mesh node interface, choose 5 External IP Configuration and then click Select. | ||
| 2 |
Choose 3 Manage Routing Rules, and then click Select. The first time you open this page, the default system routing rules appear in the list. By default, all internal traffic goes through the internal interface and external traffic through the external interface.
You can add manual overrides to these rules in the next steps. | ||
| 3 |
Follow these steps as needed:
As you add each rule, they appear in the routing rule list, categorized as user defined rules.
|
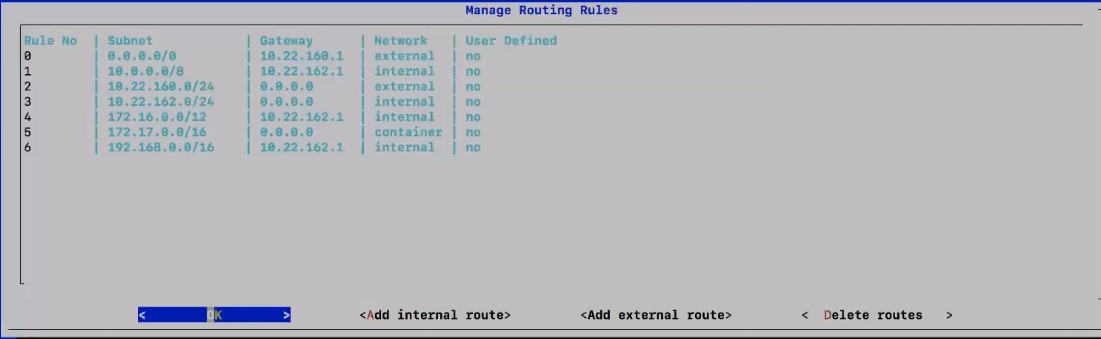
Custom routing rules may create potential for conflicts with other routing. For example, you may define a rule that freezes your SSH connection to the Video Mesh Node interface. If this happens, do one of the following and then remove or modify the routing rule:
|
Register the Video Mesh Node to the Webex Cloud
Use this procedure to register Video Mesh nodes to the Webex cloud and complete additional configuration. When you use Control Hub to register your node, you create a cluster to which the node is assigned. A cluster contains one or more media nodes that serve users in a specific geographic region. The registration steps also configure SIP call settings, set an upgrade schedule, and subscribe to email notifications.
Before you begin
-
Once you begin registration of a node, you must complete it within 60 minutes or you have to start over.
-
Ensure that any popup blockers in your browser are disabled or that you allow an exception for https://admin.webex.com.
-
For best results, deploy all nodes of a cluster in the same data center. See Clusters in Video Mesh for how they work and best practices.
-
From the host or machine where you're registering Video Mesh Nodes to the cloud, you must have connectivity to the Webex cloud and the Video Mesh IP addresses that are being registered (in a dual NIC environment, specifically the internal IP addresses of the Video Mesh Nodes).
| 1 |
Sign in to Control Hub. You sign in to Control Hub using the admin credentials. The Control Hub admin functionality is available only to users who are defined as admins in Control Hub. See Customer Account Roles for more information. | ||
| 2 |
Go to and choose one:
| ||
| 3 |
Make sure you have installed and configured your Video Mesh Node. Click Yes, I'm ready to register..., then click Next. | ||
| 4 |
In Create a new or select a cluster, choose one:
| ||
| 5 |
In Enter the FQDN or IP address, enter the fully qualified domain name (FQDN) or internal IP address of your Video Mesh Node and then click Next.
An FQDN must resolve directly to the IP address or it is not usable. We perform the validation on FQDN to rule out any typo or configuration mismatch.
| ||
| 6 |
Under Upgrade Schedule, choose a time, frequency, and time zone. The default is a daily upgrade schedule. You can change it to a weekly schedule on a specific day. When an upgrade is available, the Video Mesh Node software automatically upgrades during the time that you select.
| ||
| 7 |
Under Email Notifications, add administrator email addresses to subscribe to notifications about service alarms and software upgrades. Your administrator email address is automatically added. You can remove it if you want. | ||
| 8 |
Toggle the Video Quality setting on to enable 1080p 30fps video. With this setting, SIP participants that join a meeting that is hosted in a Video Mesh Node can use 1080p 30fps video if they are all inside the corporate network and they're using a high definition-capable device. The setting applies to all clusters of nodes.
| ||
| 9 |
Read the information under Complete Registration, then click Go to Node to register the node to the Webex cloud. A new browser tab opens to check the node. This step safelists the Video Mesh Node using the IP address of the node. During the registration process, Control Hub redirects you to the Video Mesh Node. The IP address must be safelisted, otherwise registration fails. The registration process must be completed from the enterprise network where the node is installed. | ||
| 10 |
Check Allow Access to the Webex Video Mesh Node, then click Continue. | ||
| 11 |
Click Allow. Your account is validated, your Video Mesh Node is registered and the message Registration Complete is shown, indicating your Video Mesh Node is now registered to Webex. The Video Mesh Node gets machine credentials based on your organization's entitlements. The generated machine credentials expire periodically and are refreshed. | ||
| 12 |
Click the portal link or close the tab to go back to the Video Mesh page. On the Video Mesh page, you now see the new cluster that contains the Video Mesh Node that you registered.
At this point, the Video Mesh Node is ready to communicate with Cisco cloud services over the secured channels using a token issued for authentication. The Video Mesh Node also communicates with Docker Hub (docker.com, docker.io). Docker is used by Video Mesh node to store containers for distribution to different Video Mesh nodes all over the world. Only Cisco has credentials to write to Docker Hub. The Video Mesh nodes can reach out to Docker Hub using read-only credentials to download the containers for upgrades.
|
Things to keep in mind
Keep the following information in mind about Video Mesh Node and how it works once registered to your Webex organization:
-
When you deploy a new Video Mesh Node, the Webex App and Webex-registered device won't recognize the new node for up to 2 hours. The clients check for cluster reachability during startup, a network change, or cache expiration. You can wait for 2 hours or, as a workaround, restart your Webex App or reboot the Webex room or desk device. Afterwards, call activity is captured in the Video Mesh reports in Control Hub.
-
A Video Mesh Node registers to a single Webex organization; it is not a multitenant device.
-
To understand what uses Video Mesh Node and what doesn't, see the table in Clients and Devices that use Video Mesh Node.
-
The Video Mesh Node can connect to your Webex site or to another customer or partner's Webex site. For example, Site A deployed a Video Mesh Node cluster and registered it with the example1.webex.com domain. If users in Site A dial in to mymeeting@example1.webex.com, they use the Video Mesh Node and a cascade can be created. If the users in site A dial yourmeeting@example2.webex.com, the Site A users will use their local Video Mesh Node and connect to the meeting on Site B's Webex organization.
What to do next
-
To register additional nodes, repeat these steps.
-
If an upgrade is available, we recommend that you apply it as soon as possible. To upgrade, complete the following steps:
-
The provisioning data is pushed to the Webex cloud by the Cisco development team over secured channels. The provisioning data is signed. For the containers, the provisioning data contains name, checksum, version, and so on. Video Mesh Node also gets its provisioning data from the Webex cloud over secured channels.
-
Once Video Mesh Node gets its provisioning data, the node authenticates with read-only credentials and downloads the container with specific checksum and name and upgrades the system. Each container running on Video Mesh Node has an image name and checksum. These attributes are uploaded to the Webex cloud using secured channels.
-
Enable Quality of Service (QoS) for Video Mesh Node
Before you begin
-
Make the necessary firewall port changes that are covered in the diagram and table. See Ports and Protocols Used by Video Mesh.
-
For Video Mesh nodes to be enabled for QoS, the nodes must be online. Nodes in maintenance mode or offline states are excluded when you enable this setting.
| 1 |
From the customer view in https://admin.webex.com, go to , click Edit settings on the Video Mesh card. | ||
| 2 |
Scroll to Quality of Service and click Enable. When enabled, you get the large, discrete port range (determined by on-premises call control configuration) that's used for audio and video for on-premises SIP clients/endpoints and intracluster cascades with unique DSCP markings:.
All SIP and cascade traffic from Video Mesh nodes is marked with EF for audio and AF41 for video. The discrete port ranges are used as source ports for cascade media to other Video Mesh nodes and cloud media nodes as well as source and destination ports for SIP client media. Webex Teams apps and cascade media continue to use the destination shared port of 5004 and port ramge 50000–53000.
A status message appears that shows which nodes are being enabled one-by-one for the QoS port range. You can click review pending nodes to see a list of nodes that are pending for QoS. Enabling this setting can take up to 2 hours, depending on call traffic on the nodes. | ||
| 3 |
If QoS is not fully enabled in 2 hours, open a case with support for further investigation. The nodes reboot and are updated with the new port range. |
If you decide to disable the setting, you get the small, consolidate port range that's used for both audio and video (34000–34999). All traffic from Video Mesh nodes (SIP, cascades, cloud traffic, and so on) gets a single marking of AF41.
Verify Video Mesh Node Port Ranges With Reflector Tool in the Web Interface
The reflector tool (a combination of a server on the Video Mesh node and client through a Python script) is used to verify whether the required TCP/UDP ports are open from Video Mesh nodes.
Before you begin
-
Download a copy of the Reflector Tool Client (a Python script) from https://github.com/CiscoDevNet/webex-video-mesh-reflector-client.
-
For the script to work properly, ensure that you're running Python 2.7.10 or later in your environment.
-
Currently, this tool supports SIP endpoints to Video Mesh nodes and intracluster verification.
| 1 |
From the customer view in https://admin.webex.com, enable maintenance node for the Video Mesh Node by following these instructions. |
| 2 |
Wait for the node to show a 'Ready for maintenance' status in Control Hub. |
| 3 |
Open the Webex Video Mesh node interface. For instructions, see Manage Video Mesh Node From the Web Interface. |
| 4 |
Scroll to Reflector Tool, and then start either the TCP Reflector Server or UDP Reflector Server, depending on what protocol you want to use. |
| 5 |
Click Start Reflector Server, and then wait for the server to start successfully. You'll see a notice when the server starts. |
| 6 |
From a system (such as a PC) on a network that you want Video Mesh nodes to reach, run the script with the following command:
At the end of the run, the client shows a success message if all the required ports are open:
The client shows a failed message if any required ports are not open:
|
| 7 |
Resolve any port issues on the firewall and then rerun the above steps. |
| 8 |
Run the client with
|
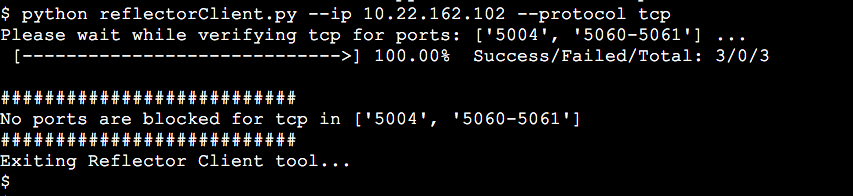
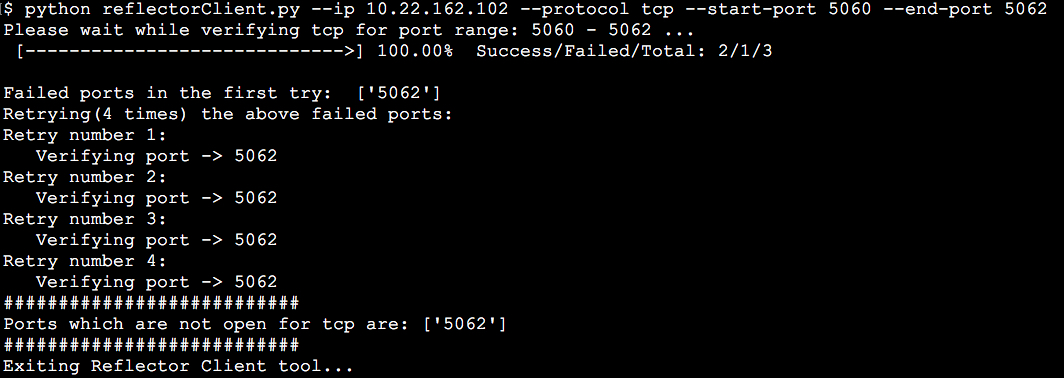
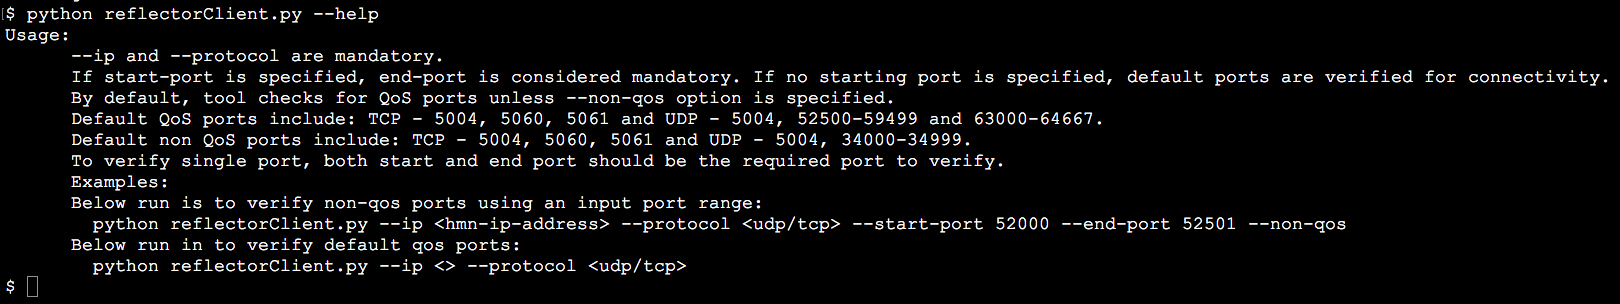
Configure Video Mesh Node for Proxy Integration
Use this procedure to specify the type of proxy that you want to integrate with a Video Mesh. If you choose a transparent inspecting proxy or an explicit proxy, you can use the node's interface to upload and install the root certificate, check the proxy connection, and troubleshoot any potential issues.
Before you begin
-
See Proxy Support for Video Mesh for an overview of the supported proxy options.
| 1 |
Enter the Video Mesh setup URL | ||||||||||
| 2 |
Go to Trust Store & Proxy, and then choose an option:
Follow the next steps for a transparent inspecting or explicit proxy. | ||||||||||
| 3 |
Click Upload a Root Certificate or End Entity Certificate, and then locate and choose the root certificate for the explicit or transparent inspecting proxy. The certificate is uploaded but not yet installed because the node needs to be rebooted to install the certificate. Click the arrow by the certificate issuer name to get more details or click Delete if you made a mistake and want to reupload the file. | ||||||||||
| 4 |
For transparent inspecting or explicit proxies, click Check Proxy Connection to test the network connectivity between the Video Mesh node and the proxy. If the connection test fails, you'll see an error message that shows the reason and how you can correct the issue. | ||||||||||
| 5 |
After the connection test passes, for explicit proxy, turn the toggle on to Route all port 443 https requests from this node through the explicit proxy. This setting requires 15 seconds to take effect. | ||||||||||
| 6 |
Click Install All Certificates Into the Trust Store (appears whenever a root certificate was added during proxy setup) or Reboot (appears if no root certificate was added), read the prompt, and then click Install if you're ready. The node reboots within a few minutes. | ||||||||||
| 7 |
After the node reboots, sign in again if needed, and then open the Overview page to check the connectivity checks to make sure they are all in green status. The proxy connection check only tests a subdomain of webex.com. If there are connectivity problems, a common issue is that some of the cloud domains listed in the install instructions are being blocked at the proxy. |
Integrate Video Mesh With Call Control Task Flow
Configure SIP trunks to route SIP dial-in for Webex meetings on Video Mesh. SIP devices don't support direct reachability, so you must use Unified CM or VCS Expressway configuration to establish a relationship between on-premises SIP devices and your Video Mesh clusters.
Before you begin
-
See Deployment Models For Video Mesh and Cisco Unified Communications Manager to understand common deployment examples.
-
Video Mesh supports either TCP or TLS between Unified CM and SIP signaling. SIP TLS is not supported for VCS Expressway.
-
In Unified CM, each SIP trunk can support up to 16 Video Mesh destinations (IP addresses).
-
In Unified CM, incoming ports on SIP trunk security profile can be default (Non Secure SIP Trunk Profile).
-
Video Mesh supports 2 route patterns: sitename.webex.com and meet.ciscospark.com. Other route patterns are unsupported.
-
Video Mesh supports 3 route patterns: webex.com (for short video addresses), sitename.webex.com and meet.ciscospark.com. Other route patterns are unsupported.
When you use the short video address format (meet@webex.com), the Video Mesh node always handles the call. The node handles the call even if the call is to a site that doesn't have Video Mesh enabled.
|
Choose one of these options, depending on your call control environment and security requirements:
|
Configure Unified CM Secure TLS SIP Traffic Routing for Video Mesh
| 1 |
Create a SIP profile for Video Mesh clusters: | ||
| 2 |
Add a new SIP trunk security profile for Video Mesh clusters: | ||
| 3 |
Add a new SIP trunk to point to your Video Mesh clusters:
| ||
| 4 |
Create a SIP trunk to point to an Expressway for Webex cloud failover.
| ||
| 5 |
Create a new route group for calls to Video Mesh clusters: | ||
| 6 |
For overflow to the cloud, create a new route group for calls to Expressway: | ||
| 7 |
Create a new route list for calls to Video Mesh clusters and Expressway: | ||
| 8 |
Create a SIP route pattern for the short video address dialing format for Webex meetings: With the short video address dialing feature, users no longer have to remember the Webex site name to join a Webex meeting or event using a video system. They can join the meeting faster because they only need to know the meeting or event number. | ||
| 9 |
Create a SIP route pattern for the Webex site: | ||
| 10 |
Create a SIP route pattern for Webex App meetings (backwards compatibility): |
Configure Unified CM TCP SIP Traffic Routing for Video Mesh
| 1 |
Create a SIP profile for Video Mesh clusters: | ||
| 2 |
Add a new SIP trunk security profile for Video Mesh clusters: | ||
| 3 |
Add a new SIP trunk to point to your Video Mesh clusters:
| ||
| 4 |
Create a new SIP trunk to point to an Expressway.
| ||
| 5 |
Create a new route group for calls to Video Mesh clusters: | ||
| 6 |
For overflow to the cloud, create a new route group for calls to Expressway: | ||
| 7 |
Create a new route list for calls to Video Mesh clusters and Expressway: | ||
| 8 |
Create a SIP route pattern for the short video address dialing format for Webex meetings: With the short video address dialing feature, users no longer have to remember the Webex site name to join a Webex meeting or event using a video system. They can join the meeting faster because they only need to know the meeting or event number. | ||
| 9 |
Create a SIP route pattern for the Webex site: | ||
| 10 |
Create a SIP route pattern for Webex App meetings: |
Configure Expressway TCP SIP Traffic Routing for Video Mesh
| 1 |
Create a zone that points to Video Mesh clusters: | ||||||||||||||||||||||
| 2 |
Create dial patterns for Video Mesh clusters for Webex sites:
| ||||||||||||||||||||||
| 3 |
Create a traversal client and zone pair that points to the cloud Expressway for failover: | ||||||||||||||||||||||
| 4 |
Create a fallback search rule to the Traversal Client Zone that leads to the Expressway-E: | ||||||||||||||||||||||
| 5 |
From Expressway-E, go to . Click New and add the Webex Zone. In versions before X8.11, you created a new DNS zone for this purpose. | ||||||||||||||||||||||
| 6 |
Create a dial pattern for the cloud Expressway: | ||||||||||||||||||||||
| 7 |
For SIP devices registered to the Expressway-C, open the device IP address in a browser, go to Setup, scroll to SIP, and choose Standards from the Type drop-down. |
Exchange Certificate Chains Between Unified CM and Video Mesh Nodes
Complete a certificate exchange to establish two-way trust between the Unified CM and Video Mesh interfaces. With the secure trunk configuration, the certificates allow encrypted SIP traffic and SRTP media in your organization from trusted Unified CMs to land on trusted Video Mesh nodes.
In a clustered environment, you must install CA and server certificates on each node individually. |
Before you begin
For security reasons, we recommend that you use a CA signed certificate on your Video Mesh nodes instead of the node's default self-signed certificate.
| 1 |
Open the Video Mesh node interface (IP address/setup, for example, | ||||
| 2 |
Go to Server Certificates and request and upload a certificate and key pair as needed:
| ||||
| 3 |
In another browser tab, from Cisco Unified OS Administration, go to . Enter your search criteria and click Find, then choose the filename of the certificate or Certificate Trust List (CTL) and click Download. Save the Unified CM file somewhere that's easy to remember and leave Unified CM instance open in the browser tab. | ||||
| 4 |
Go back to the Video Mesh node interface tab, click Trust Store & Proxy, and then choose an option:
A cloud-registered Video Mesh node gracefully shuts down, waiting up to 2 hours for any calls to end. To install the CallManager.pem certificate, the node automatically reboots. When it comes back online, a prompt appears when the CallManager.pem certificate installs on the Video Mesh node. You can then reload the page to view the new certificate. | ||||
| 5 |
Go back to the Cisco Unified OS Administration tab and click Upload Certificate/Certificate Chain. Choose the certificate name from the Certificate Purpose drop-down list, browse to the file that you downloaded from the Video Mesh node interface, and then click Open. | ||||
| 6 |
To upload the file to the server, click Upload File. If you're uploading a certificate chain, you must upload all certificates in the chain.
|
Enable Media Encryption for the Organization and Video Mesh Clusters
Use this procedure to turn on media encryption for your organization and individual Video Mesh clusters. This setting forces an end-to-end TLS setup and you must have a secure TLS SIP trunk in place on your Unified CM that points to your Video Mesh nodes.
|
Settings |
Result |
|---|---|
|
Unified CM is configured with a secure trunk and this Video Mesh Control Hub setting is not enabled. |
Calls fail. |
|
Unified CM is not configured with a secure trunk and this Video Mesh Control Hub setting is enabled. |
Calls won't fail but they fall back to non-secure mode. |
Cisco endpoints must also be configured with a security profile and TLS negotiation for end-to-end encryption to work. Otherwise, calls overflow to the cloud from endpoints that are not configured with TLS. We recommend that you enable this feature only if all endpoints can be configured to use TLS. |
Before you begin
| 1 |
From the customer view in https://admin.webex.com, go to , and then click Settings on the Video Mesh card. |
| 2 |
Scroll to Media Encryption and toggle on the setting. This setting makes encryption mandatory on all media channels that pass through Video Mesh nodes in your organization. Note the preceding table and caution note for situations where calls may fail and what's required for end-to-end encryption to work. |
| 3 |
Click Show all and repeat the following steps on each Video Mesh cluster that you want to enable for secure SIP traffic. |
Enable Video Mesh for the Webex Site
To use optimized media to the Video Mesh Node for a Webex meeting to all the Webex app and devices to join, this configuration needs to be enabled for the Webex site. Enabling this setting links Video Mesh and meeting instances in the cloud together and allows cascades to occur from Video Mesh nodes. If this setting is not enabled, the Webex app and devices will not use the Video Mesh node for Webex meetings.
| 1 |
From the customer view in https://admin.webex.com, go to , click the Webex site from the Meetings card, and then click Settings
|
| 2 |
Access Common Settings by clicking on Service > Meeting > Site Settings. From Common Settings, click Cloud Collaboration Meeting Rooms (CMR), choose Video Mesh for Media Resource Type, and then click Save at the bottom.
This setting links Video Mesh and meeting instances in the cloud together and allows cascades to occur from Video Mesh nodes. The setting should populate across your environment after 15 minutes. Webex meetings that start after this change is populated will pick up the new setting. If you leave this field set to Cloud (the default option), all meetings are hosted in the cloud and the Video Mesh node is not used. |
Assign Collaboration Meeting Rooms to Webex App Users
Verify the meeting experience on the secure endpoint
Use these steps to verify that the endpoints are securely registered and the correct meeting experience appears.
| 1 |
Join a meeting from the secured endpoint. |
| 2 |
Verify that the meeting roster list appears on the device. This example shows how the meeting list looks on an endpoint with a touch panel:
|
| 3 |
During the meeting, access the Webex Conference information from Call Details. |
| 4 |
Verify that Encryption section shows the Type as AES-128 and the Status as On.
|
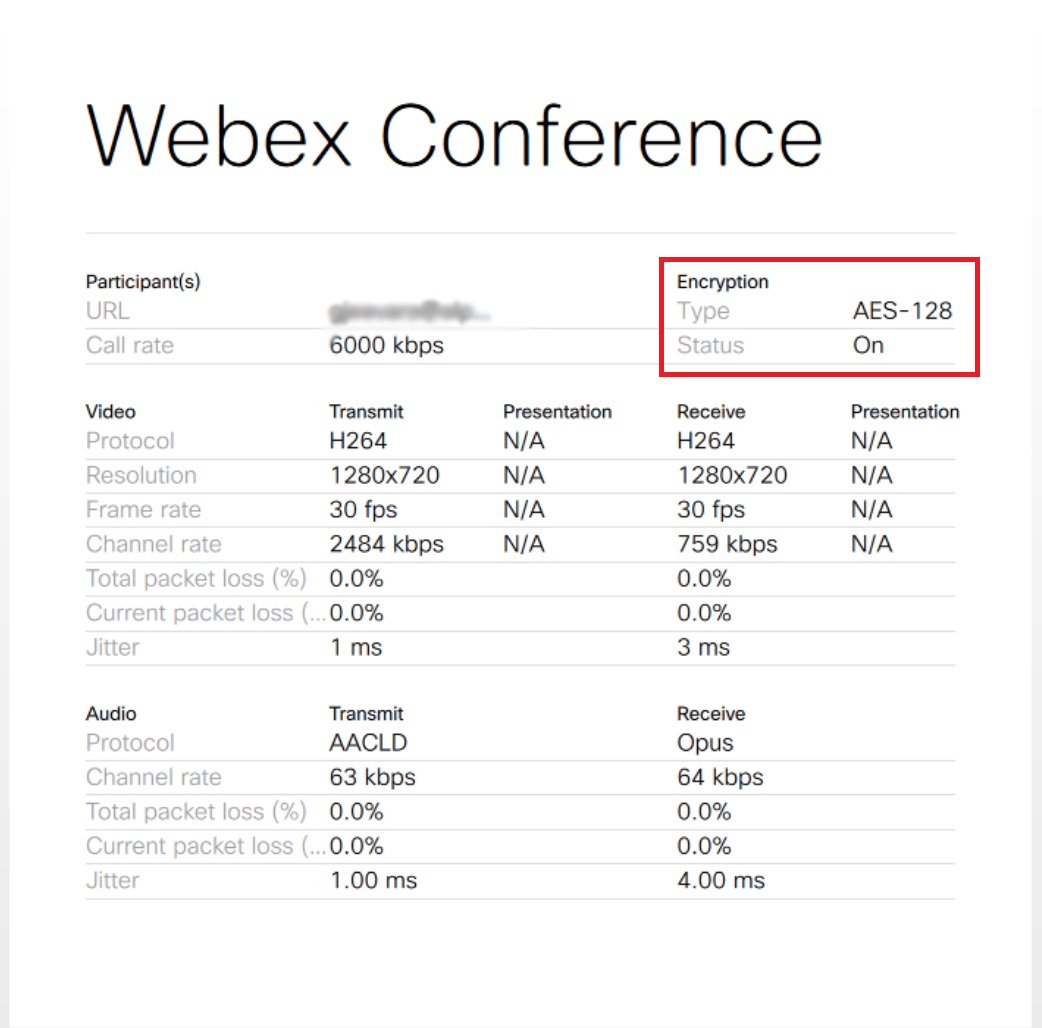
Video Mesh Analytics
Analytics provide information about how you use your on-premises Video Mesh nodes and clusters in your Webex organization. With the historical data in the metrics view, you can more effectively manage your Video Mesh resources by monitoring the capacity, utilization, and availability of your on-premises resources. You can use this information to make decisions about adding more Video Mesh nodes to a cluster or creating new clusters, for example. Video Mesh analytics can be found in Control Hub under .
To help with analyzing the data in your organization, you can zoom in on data that appears on the graph and isolate a specific time period. For Analytics, you can also slice and dice reports to show more granular details.
Video Mesh analytics and troubleshooting reports show data in the time zone that is set for the local browser. |
Analytics
Video Mesh analytics provide a long-term trend (up to 3 months of data) in the categories of engagement, resource usage, and bandwidth usage.
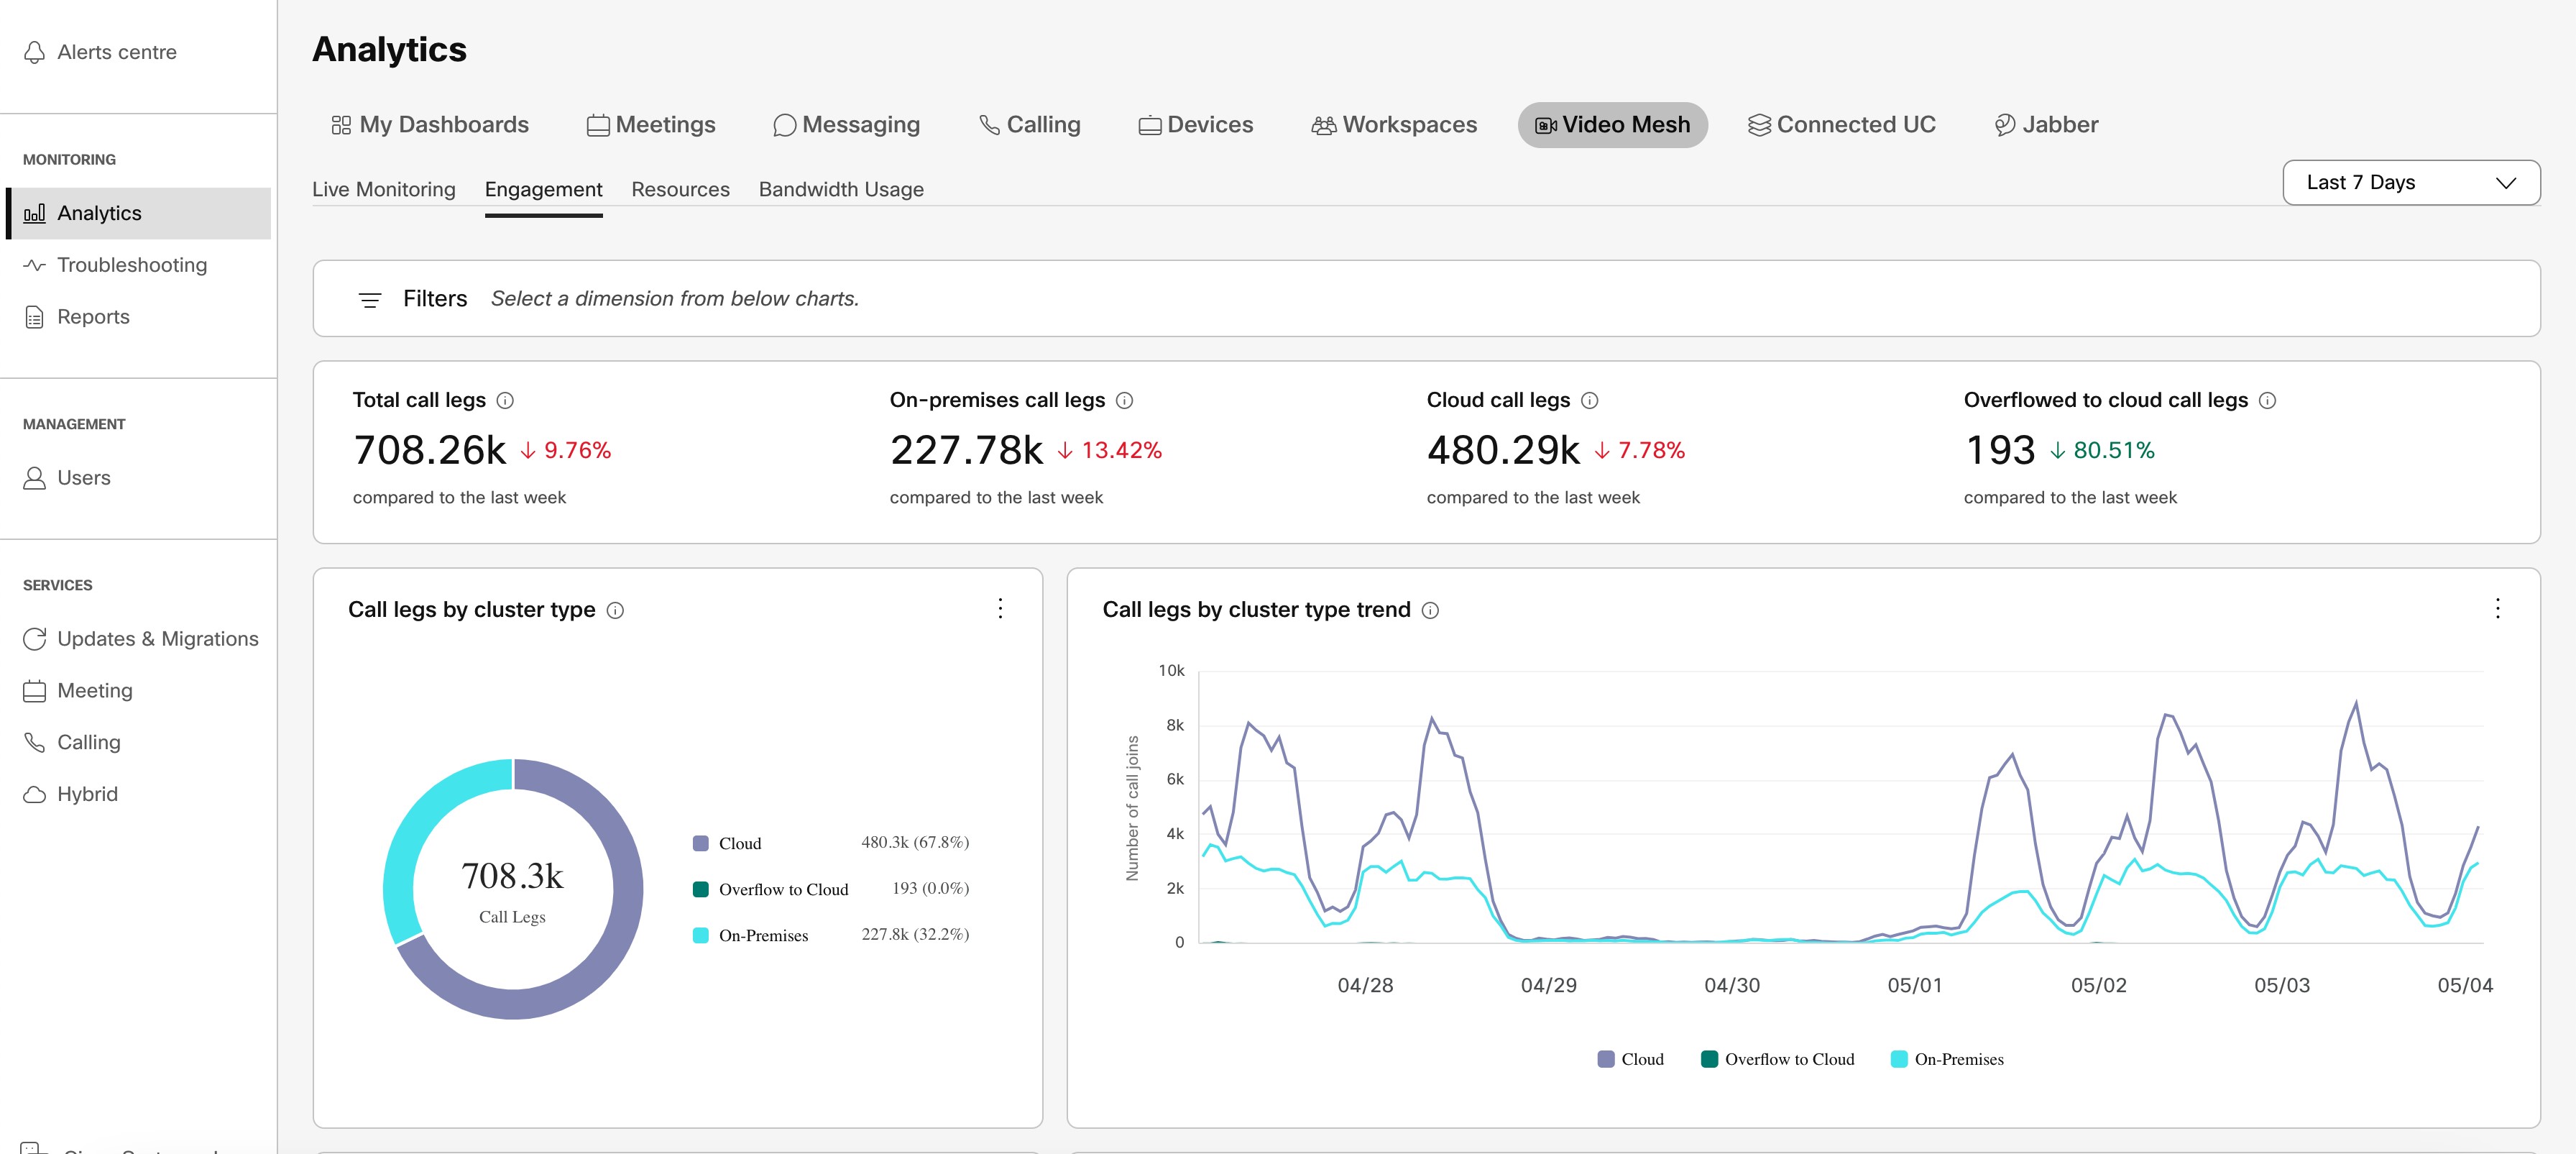
Live Monitoring
The live monitoring tab provides a near-realtime view of activity in your organization: up to 1 minute aggregation and the ability to view the last 4 hours or 24 hours on all clusters or specific clusters. This tab in Control Hub is automatically refreshed—every 1 minute for the last 4 hours and every 10 minutes for the last 24 hours.
Access, Filter, and Save Video Mesh Live Monitoring Reports
Video Mesh live monitoring reports are available on the Troubleshooting page of Control Hub ( https://admin.webex.com), once Video Mesh is active and has a cluster with at least one registered Video Mesh node.
| 1 |
From the customer view in https://admin.webex.com, choose Analytics, and then click Video Mesh on the upper-right side of the screen.
| ||||
| 2 |
From the toggle on the left, choose an option to filter on how far back in time you want to show data.
| ||||
| 3 |
Interact with the charts by using the following options as needed:
| ||||
| 4 |
After you've filtered data in the reports, click more
|
 to get a short description of the chart.
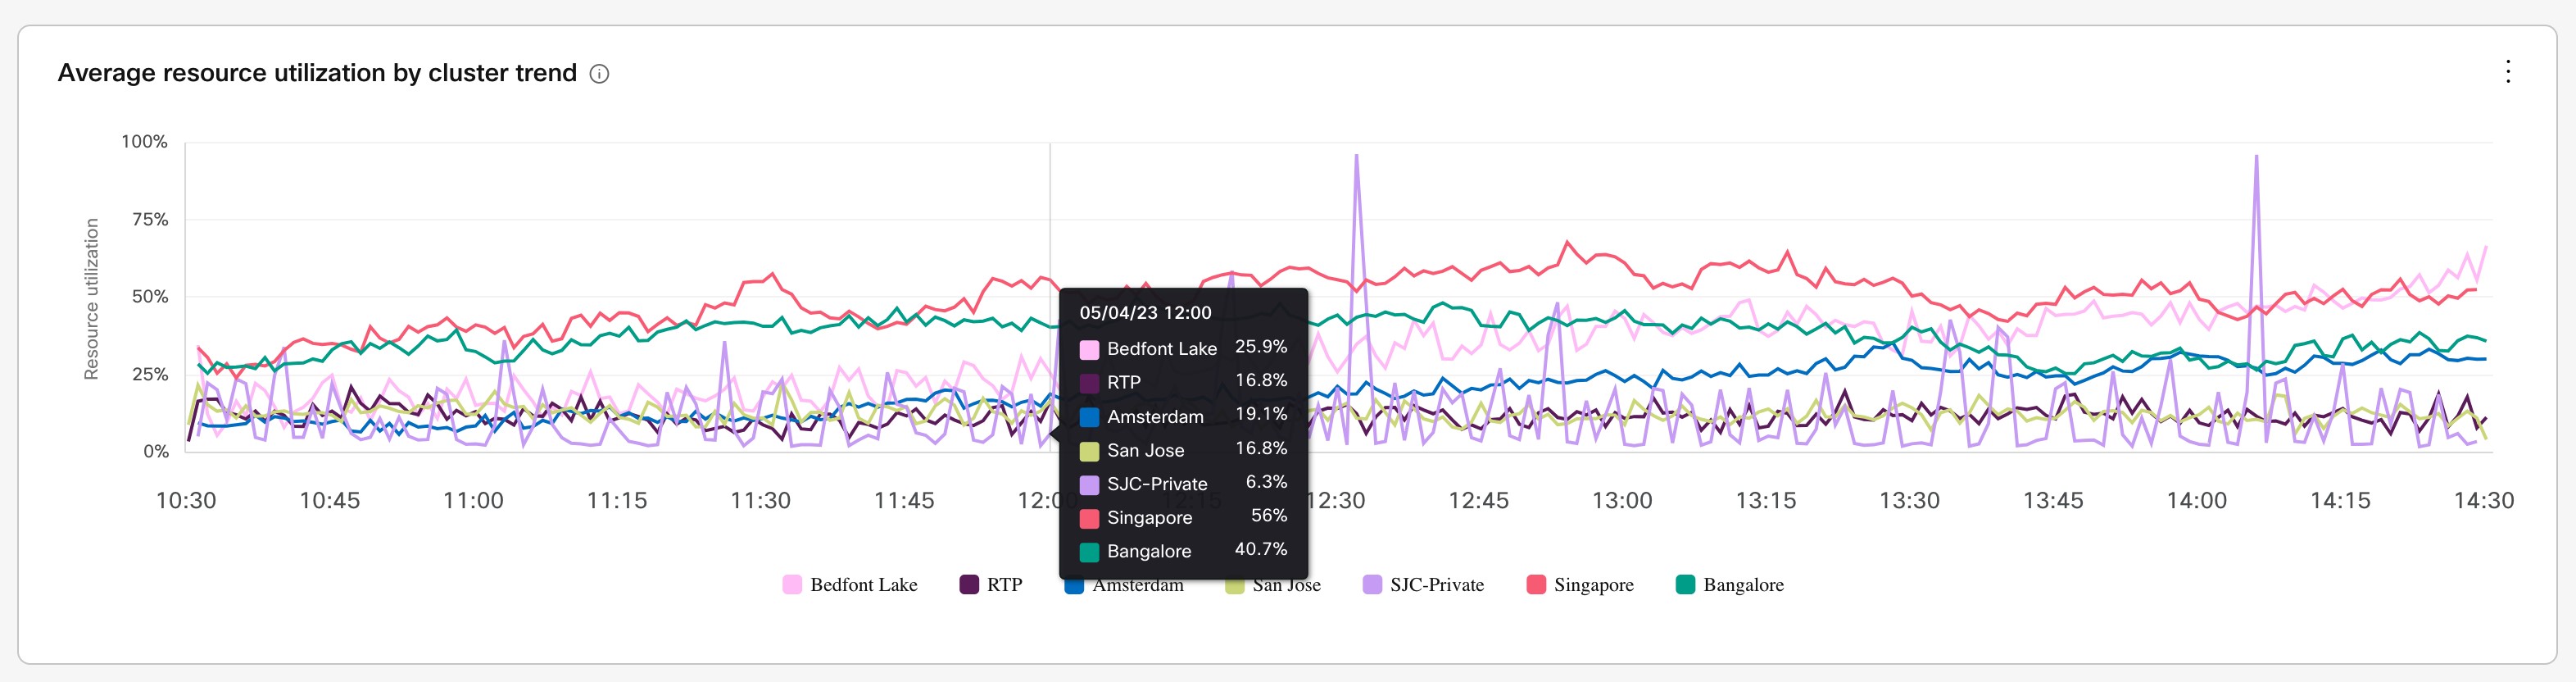
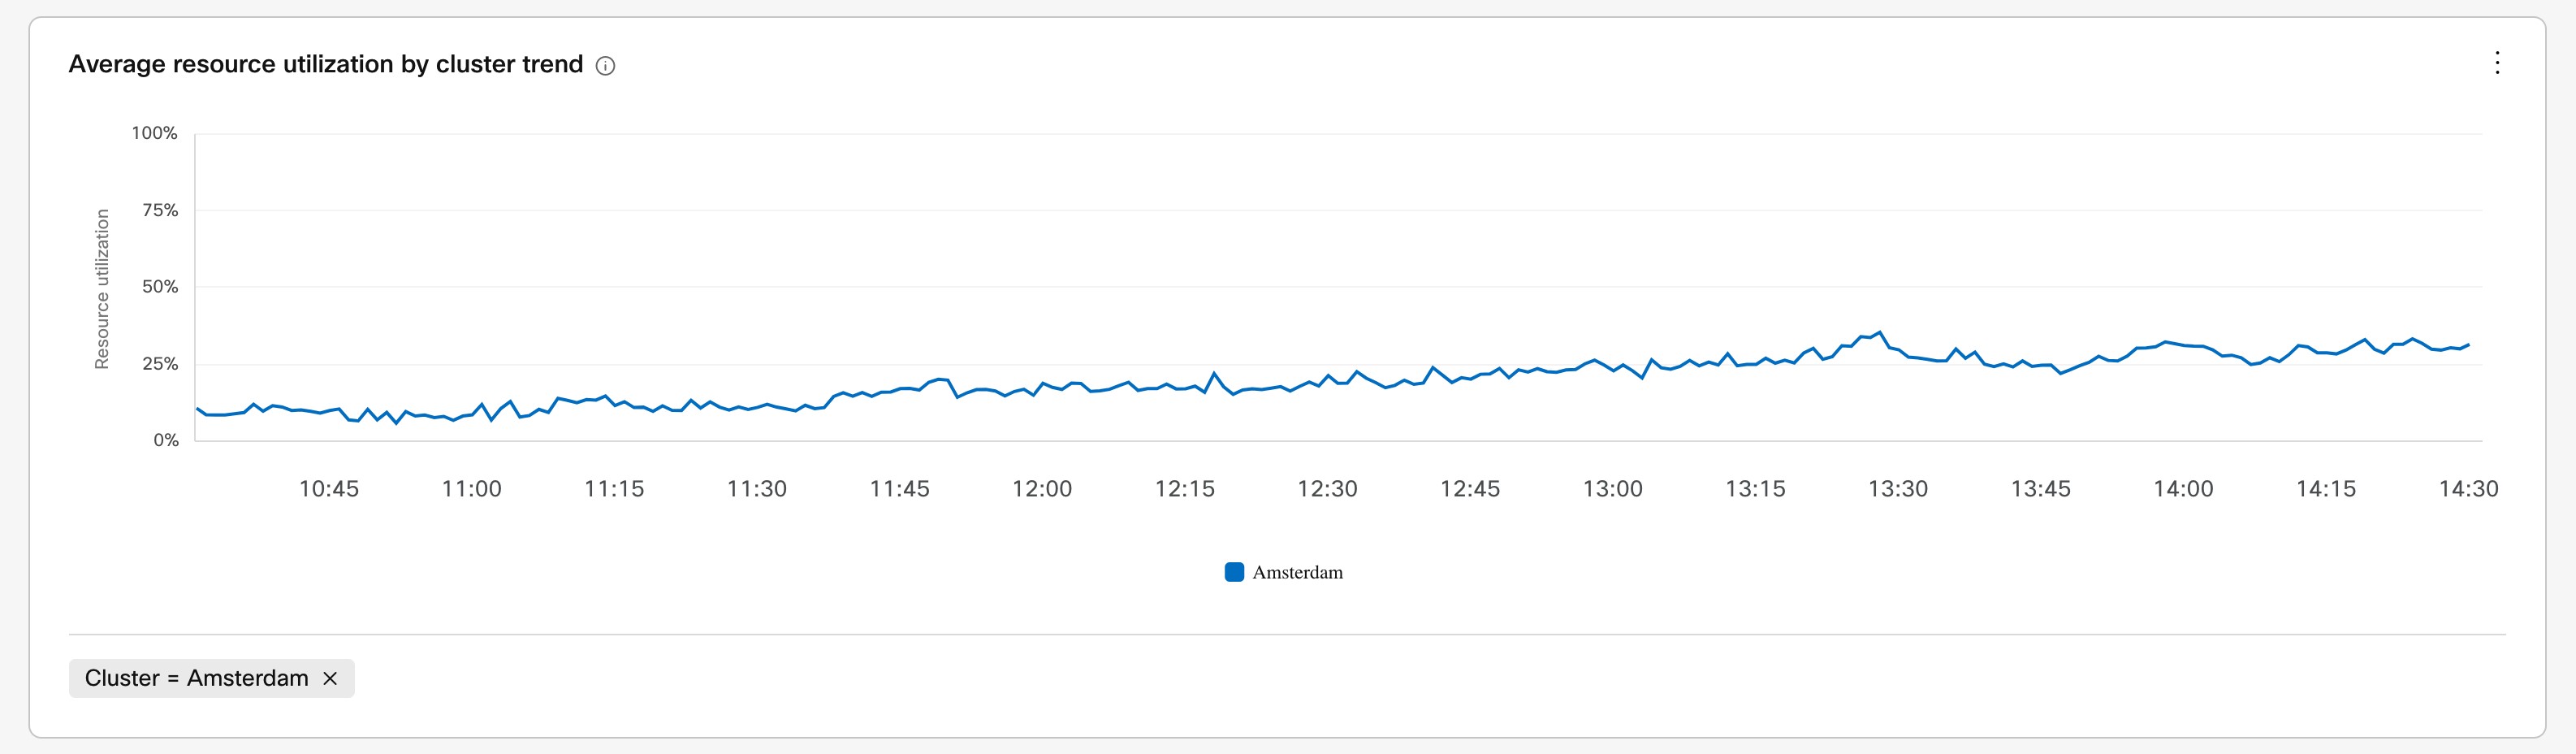
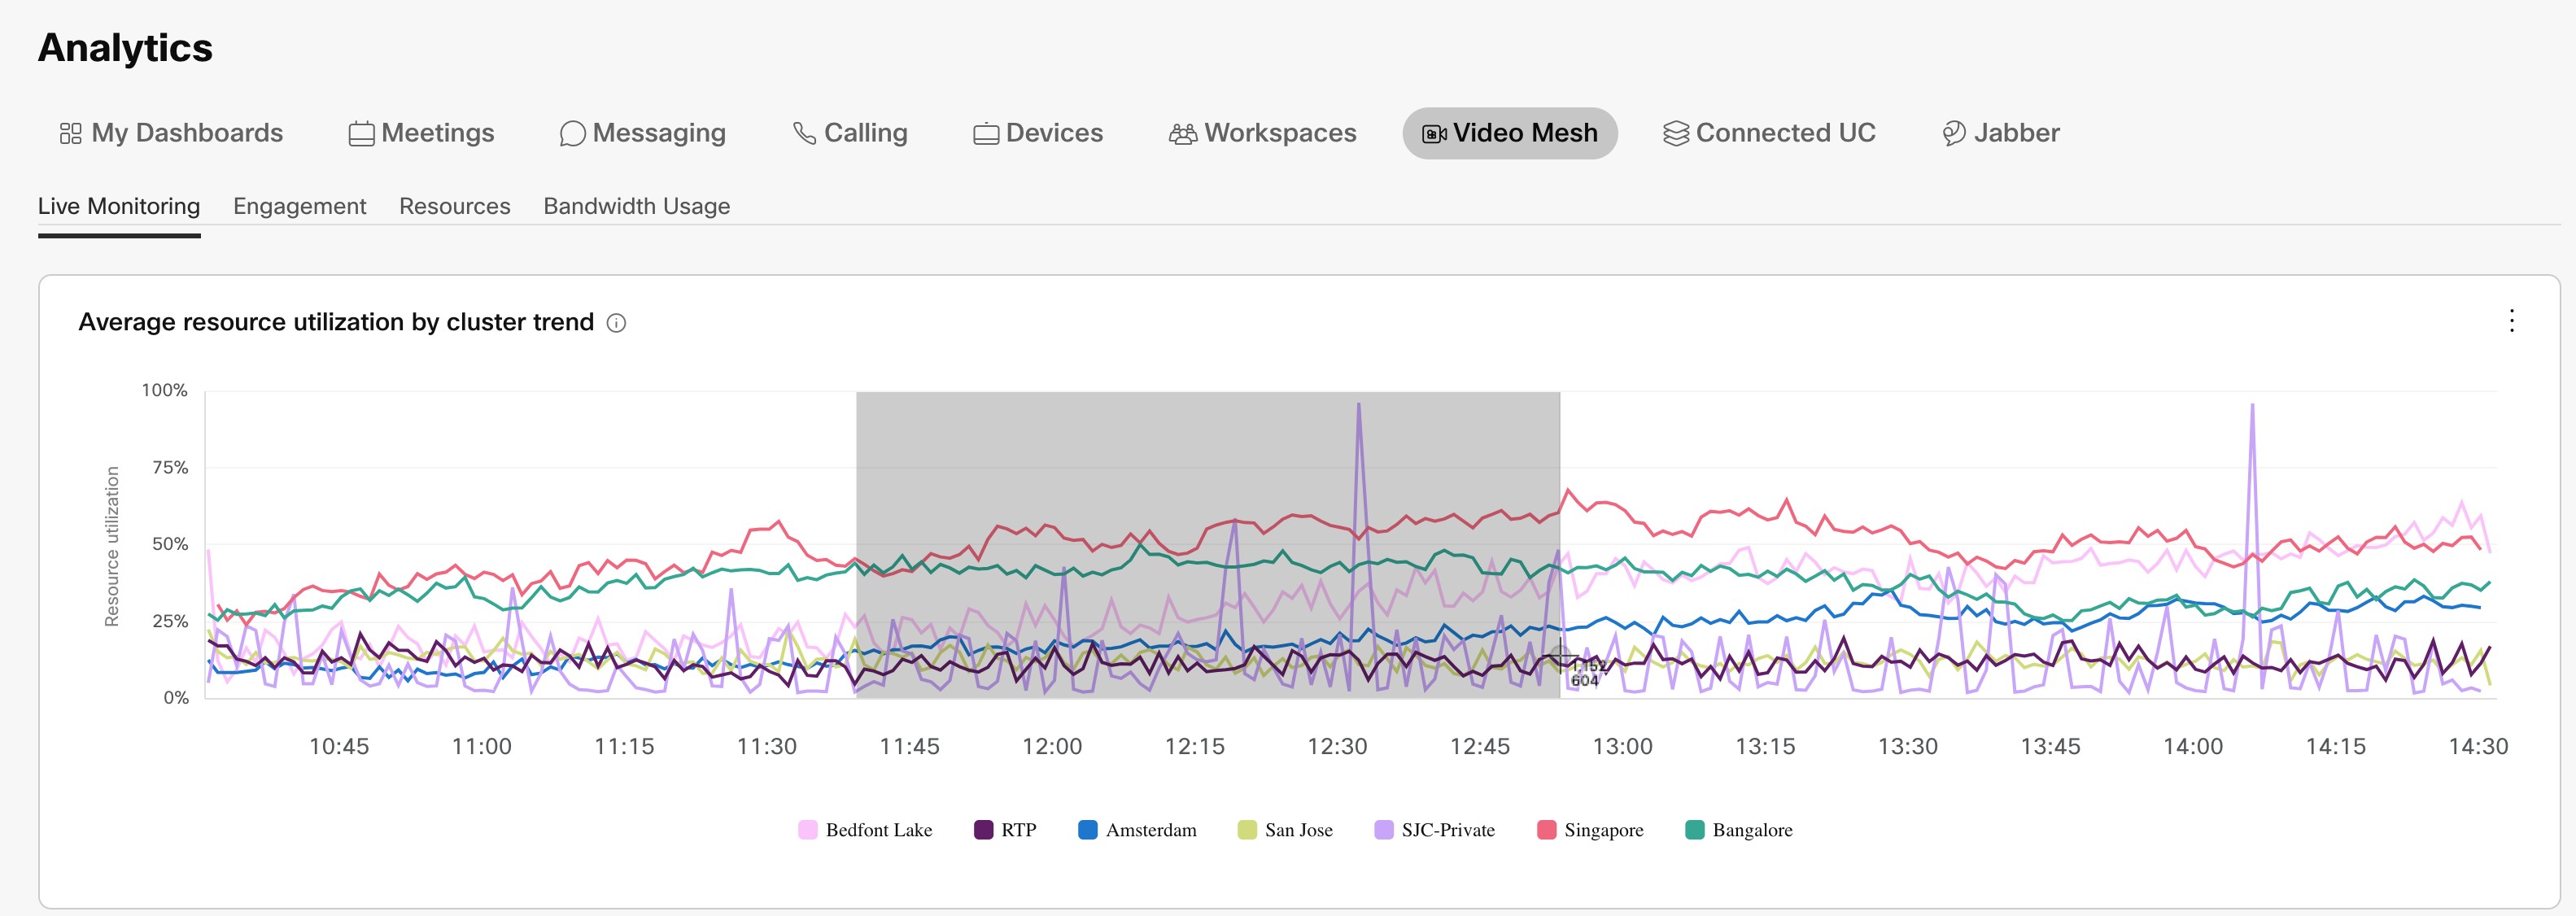
Access, Filter, and Save Video Mesh Analytics
Video Mesh metric reports are available on the Analytics page of Control Hub ( https://admin.webex.com), once Video Mesh is active and has a cluster with at least one registered Video Mesh node.
| 1 |
From the customer view in https://admin.webex.com, choose Analytics, and then click Video Mesh on the upper-right side of the screen. | ||||||
| 2 |
Click a category, depending on the type of data you're looking for:
| ||||||
| 3 |
From the drop-down on the right, choose an option to fìlter on how far back in time you want to show data.
| ||||||
| 4 |
Interact with the charts or donut graphs by using the following options as needed:
| ||||||
| 5 |
After you've filtered data in the reports, click more
| ||||||
| 6 |
Clear all the filters from the filters bar if you'd like to reset the analytics view. |
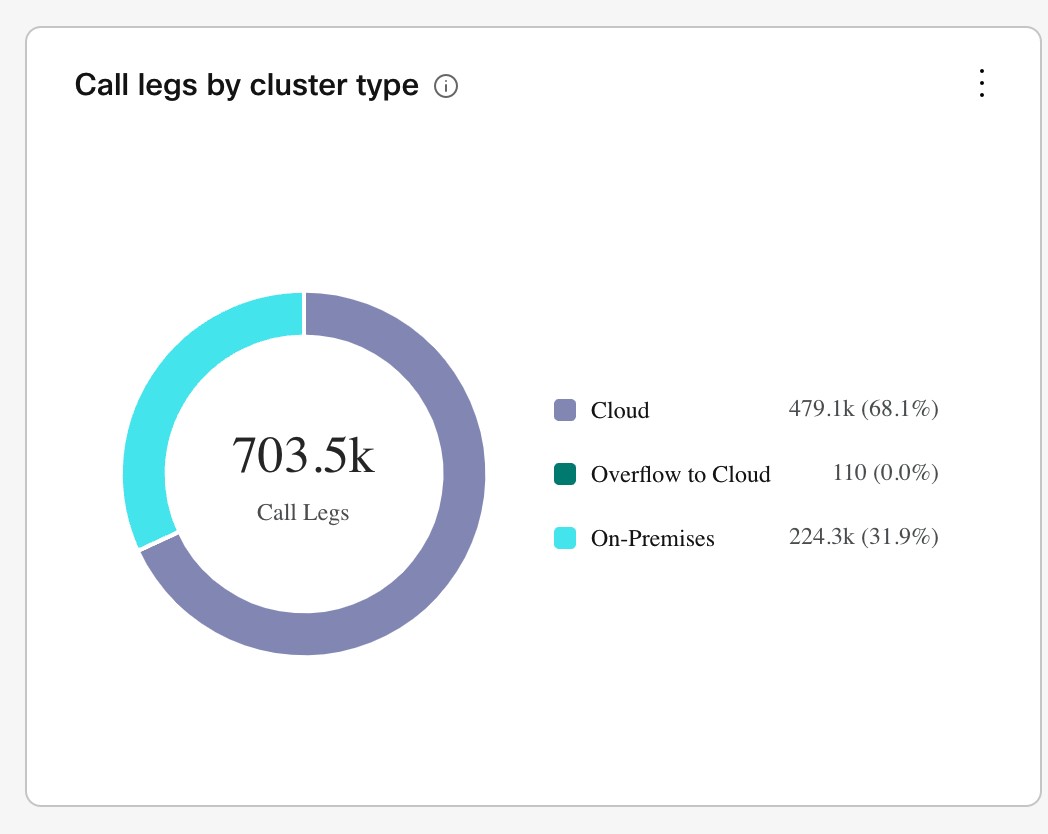
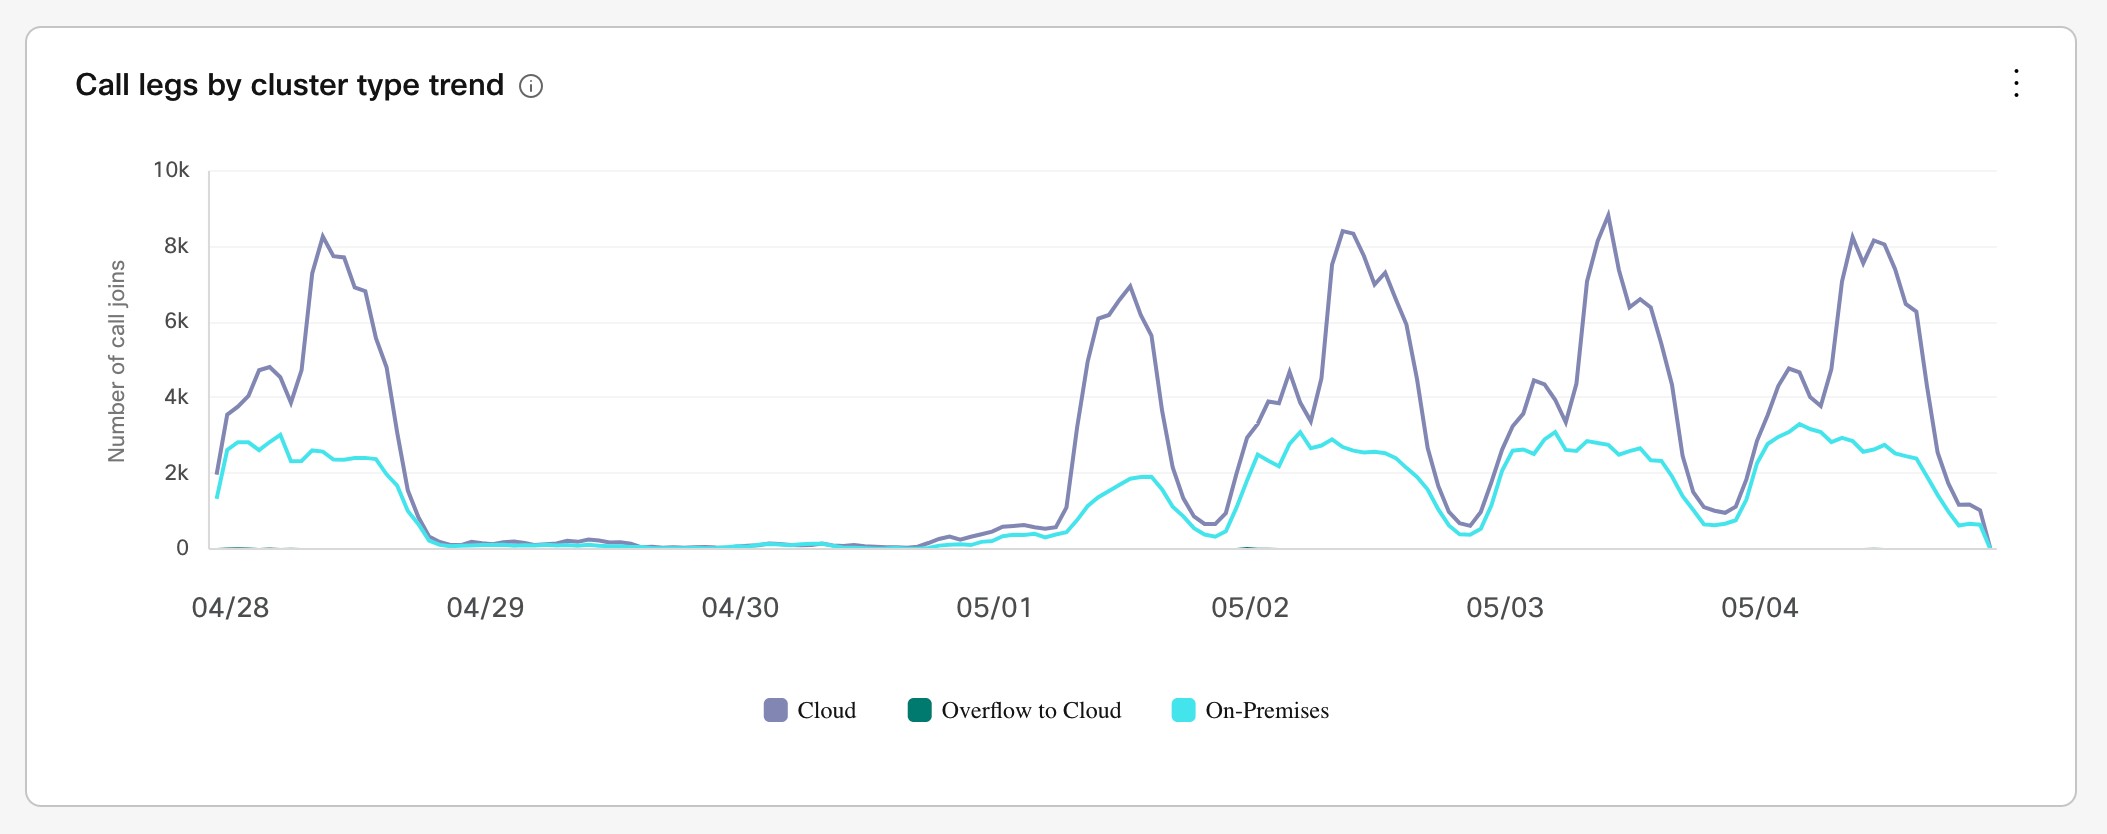
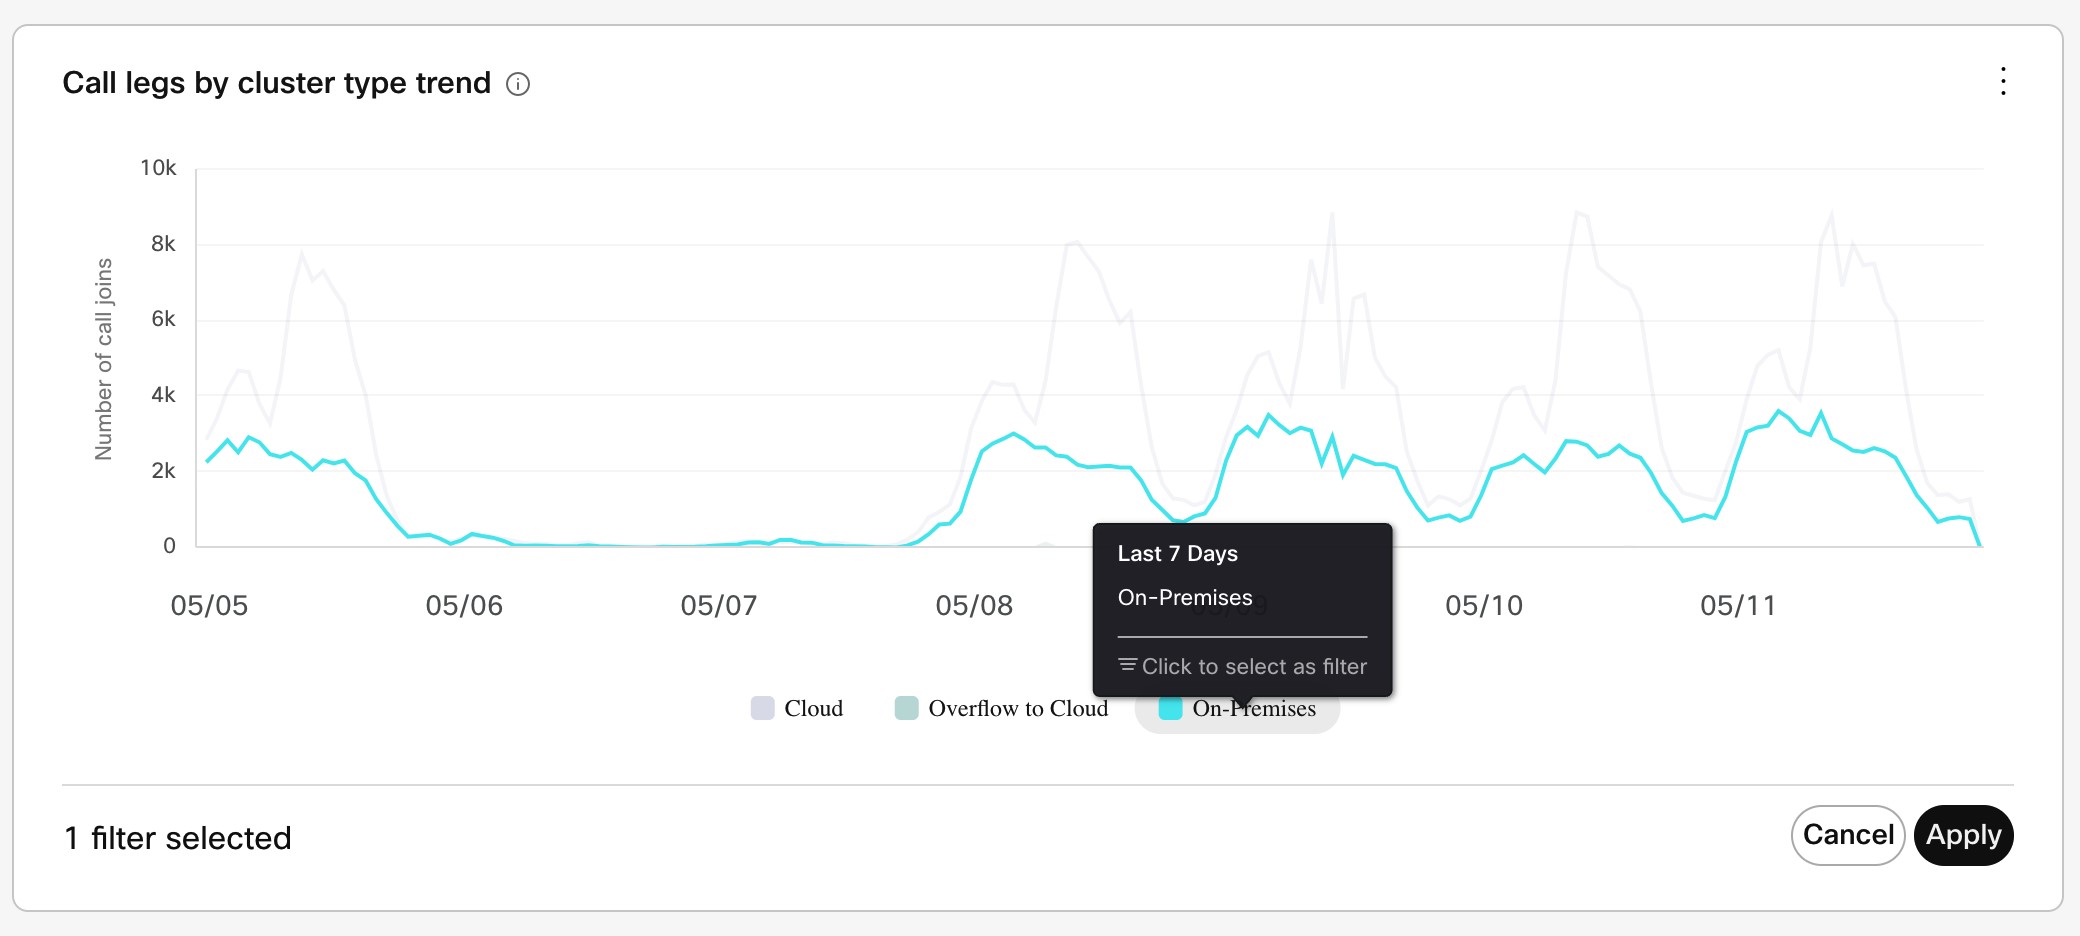
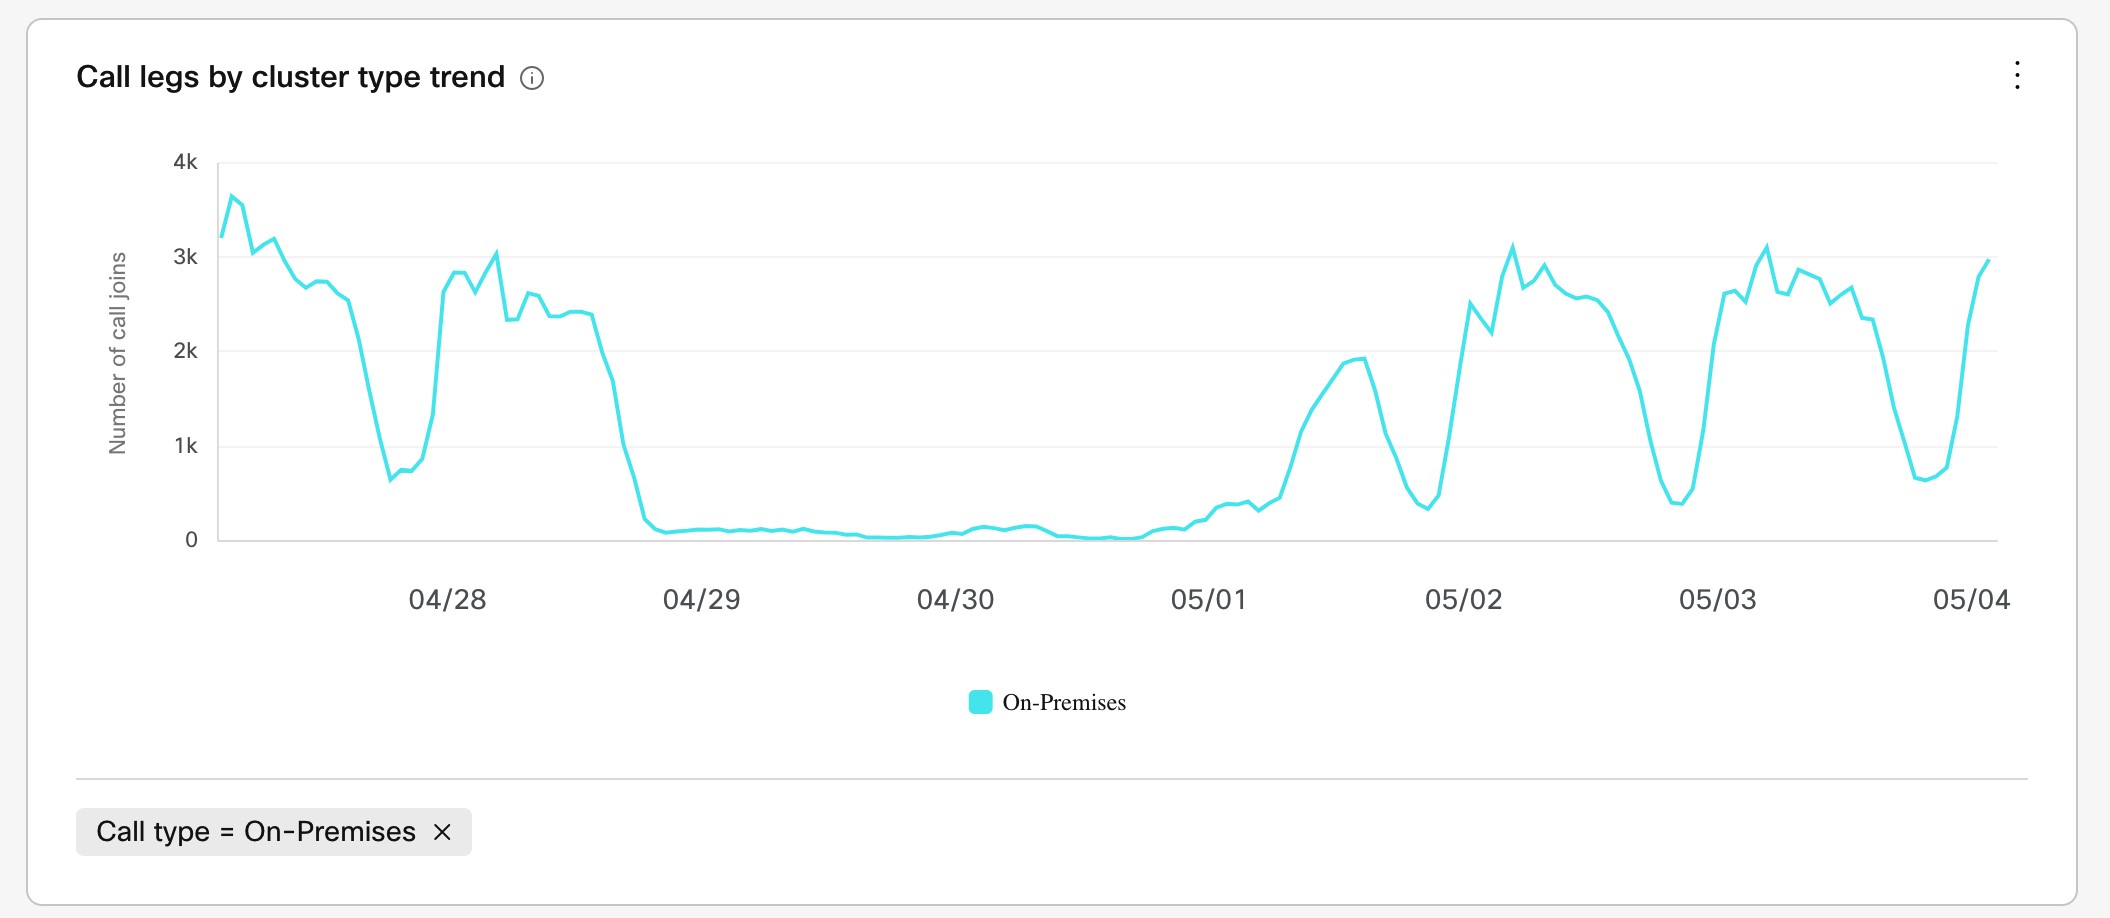
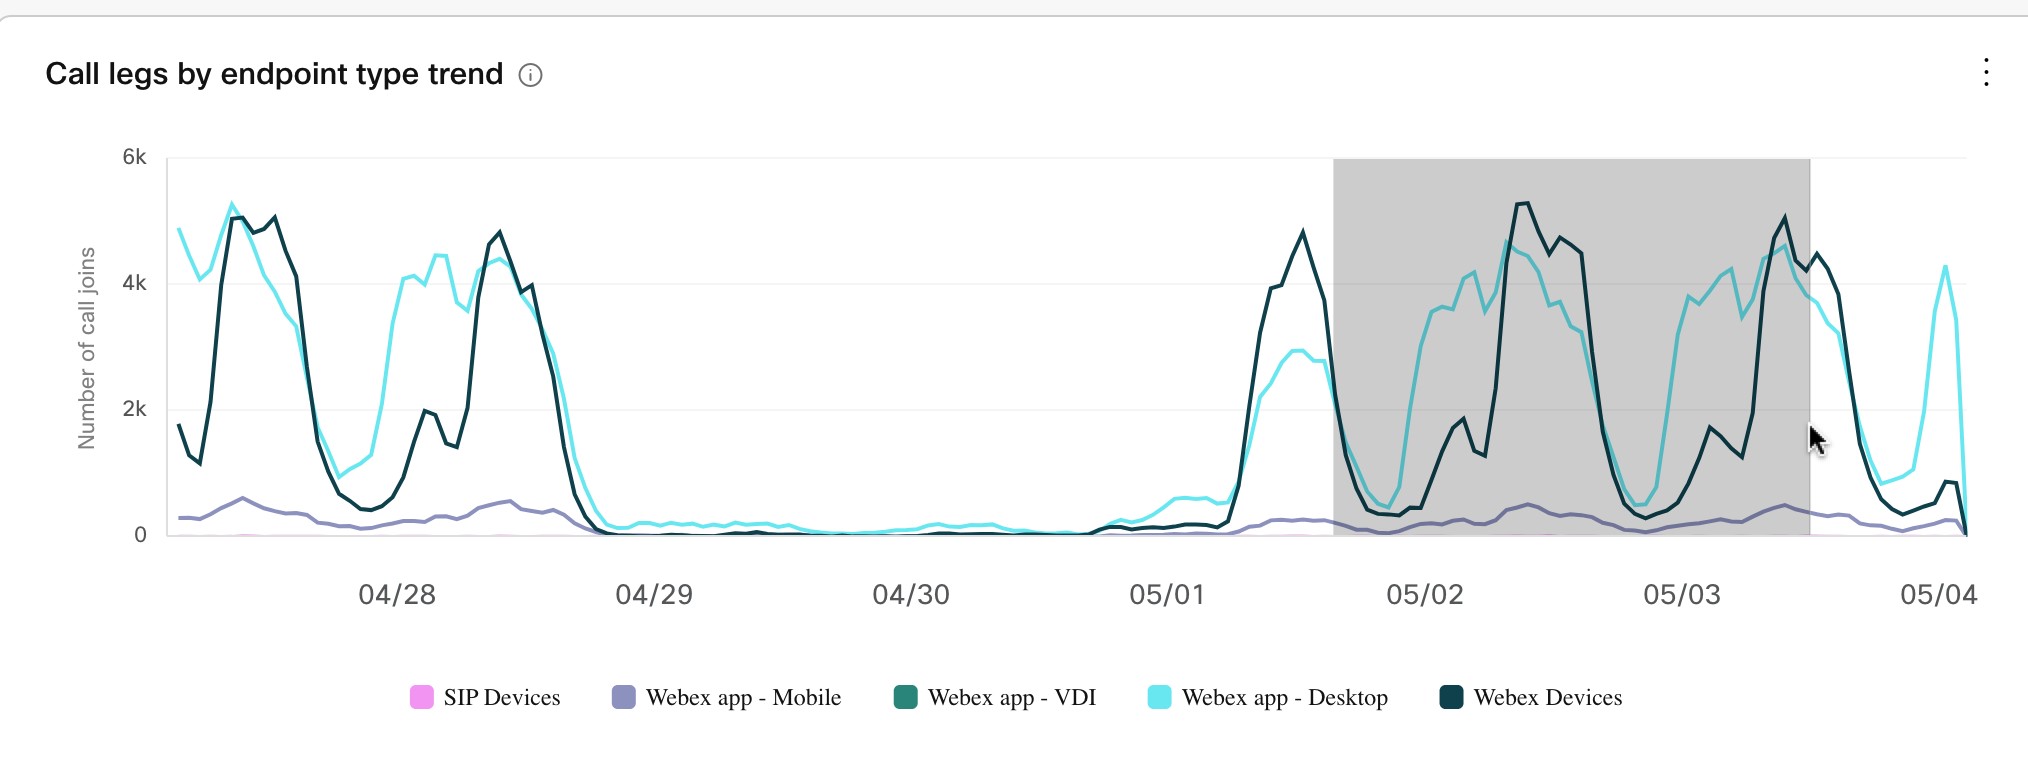
Available analytics for Video Mesh
For details of the available analytics in Control Hub, see the Video Mesh section of Analytics for Your Cloud Collaboration Portfolio.
Monitoring Tool for Video Mesh
The Monitoring tool in Control Hub helps your organization in monitoring the health of your Video Mesh deployment. You can run the following tests on your Video Mesh nodes, clusters, or both to get results for specific parameters.
-
Signaling Test - Tests whether SIP signaling and media signaling occurs between the Video Mesh node and Webex cloud media services.
-
Cascade Test - Tests whether a cascade can be established between the Video Mesh node and Webex cloud media services.
-
Reachability Test - Tests whether the Video Mesh node can reach the destination ports for media streams in Webex cloud media services. It also tests if the Video Mesh node is able to communicate with the cloud clusters associated with media containers through those ports.
When you run a test, the tool creates a simulated meeting. After the test finishes, you see a simple pass or fail result with inline troubleshooting tips in the report. You can schedule the test to run periodically or run the test on demand. For more information, see Media Health Monitoring for Video Mesh.
Run an immediate test
Use this procedure to run an on-demand media health monitoring and reachability test on Video Mesh nodes and/or clusters registered to your Control Hub organization. The results are captured in Control Hub and are aggregated every 6 hours starting at 00:00 UTC.
| 1 |
Log in to Control Hub, then go to . | ||
| 2 |
Click on Configure Test, click Test now, then check the nodes and/or clusters you want to test.
| ||
| 3 |
Click Run test. |
What to do next
The results appear in the monitoring tool overview page in Control Hub. By default, results of all the tests are displayed together. Click on Signalling, Cascade, or Reachability to filter the results according to the specific test.
The points on the timeline with slider show aggregated test results for the entire organization. The cluster-level timelines show aggregated results for each cluster.
The timeline might display dates in the US format. Change your language in the profile settings to view dates in your local format. |
Hover over the points on the timelines to see the test results. You can also see detailed test results for each node. Click on a point on the cluster-level timeline to view detailed results.
The results are displayed in a side panel and split into Signaling, Cascasde and Reachabilty. You can view whether the test was a success, if it was skipped, or if the test failed. Error codes with possible fixes are also displayed with the results.
Use the toggle provided to view the success rates of various parameters in the form of a table.
A skipped test, partial failure, or failure is not critical unless it occurs continuously over a period of time. |
Configure periodic tests
Use this procedure to configure and start periodic media health monitoring and reachability tests. These tests run every 6 hours by default. You can run these tests at cluster-wide, cluster-specific, or node-specific levels. The results are captured in Control Hub and are aggregated every 6 hours starting at 00:00 UTC.
| 1 |
Log in to Control Hub, then go to . |
| 2 |
Click on Configure Test, click Periodic test, then check the nodes and/or clusters you want to test. |
| 3 |
Choose an option:
|
| 4 |
Click Next. |
| 5 |
Review the list of clusters and nodes to run the periodic tests. If you are satisfied, click Configure to schedule the current configuration. |
What to do next
The results appear in the monitoring tool overview page in Control Hub. By default, results of all the tests are displayed together. Click on Signalling, Cascade, or Reachability to filter the results according to the specific test.
The points on the timeline with slider show aggregated test results for the entire organization. The cluster-level timelines show aggregated results for each cluster.
The timeline might display dates in the US format. Change your language in the profile settings to view dates in your local format. |
Hover over the points on the timelines to see the test results. You can also see detailed test results for each node. Click on a point on the cluster-level timeline to view detailed results.
The results are displayed in a side panel and split into Signaling, Cascasde and Reachabilty. You can view whether the test was a success, if it was skipped, or if the test failed. Error codes with possible fixes are also displayed with the results.
Use the toggle provided to view the success rates of various parameters in the form of a table.
A skipped test, partial failure, or failure is not critical unless it occurs continuously over a period of time. |
Enable 1080p HD Video for On-Premises SIP Devices in Video Mesh Node Meetings
This setting allows your organization to favor 1080p high-definition video for on-premises registered SIP endpoints, with a trade off of lower meeting capacity. A Video Mesh Node must host the meeting. Participants can use 1080p 30fps video provided that:
-
They're all inside the corporate network.
-
They're using an on-premises registered high definition-capable SIP device.
The setting applies to all clusters that contain Video Mesh nodes.
Cloud-registered devices continue to send and receive 1080p streams, regardless of this setting being turned on or off. |
| 1 |
From the customer view in https://admin.webex.com, go to , and then click Settings on the Video Mesh card. |
| 2 |
Toggle on Video Quality. If this setting is off, the default is 720p. |
For video resolutions that the Webex App supports, see Video Specifications for Calls and Meetings.
Private Meetings
The Private Meeting feature enhances the security of your meeting by terminating the media on your premises. When you schedule a private meeting, the media always terminates on the Video Mesh nodes inside your corporate network with no cloud cascade.
As shown here, private meetings never cascade media to the cloud. The media terminates entirely on your Video Mesh clusters. Your Video Mesh clusters can only cascade with each other.
You can reserve a Video Mesh cluster for private meetings. When the reserved cluster is full, the private meeting media cascades out to your other Video Mesh clusters. When the reserved cluster is full, private meetings and non-private meetings share the resources of your remaining clusters.
Non-private meetings don’t use reserved clusters, reserving those resources for the private meetings. If a non-private meeting runs out of resources on your network, it cascades out to the Webex cloud instead.
The Webex App with the Full Featured Webex Experience enabled is incompatible with Video Mesh. For details, see Clients and Devices That Use Video Mesh Node. |
Support and Limitations for Private Meetings
Video Mesh supports private meetings as follows:
-
Private meetings are available on Webex Version 40.12 and above.
-
Only scheduled meetings can use the private meeting type. See the Schedule a Cisco Webex Private Meeting article for details.
-
Private meetings are not available for full-featured meetings started or joined from Webex App.
-
You can use any current Video Mesh supported device.
-
Your nodes can use any current image: 72vCPU and 23vCPU.
-
Private meeting logic doesn’t create any gaps in metrics. We collect the same metrics for Control Hub as for non-private meetings.
Because some users don't activate this feature, the analytics reports for private meetings don't appear if your org doesn't have a private meeting in 90 days.
-
Private meetings support 1-Way Whiteboarding from a video endpoint.
Limitations
Private meetings have these limitations:
-
Private meetings only support VoIP for audio. They don’t support Webex Edge Audio or PSTN.
-
You can’t use a personal meeting room (PMR) for a private meeting.
-
Private meetings don’t support Webex features that require a connection to the cloud, such as, Cloud Recording, Transcription, and Webex Assistant.
-
You can’t join a private meeting from an unauthenticated cloud registered video system, even one that has paired to the Webex app.
Use Private Meetings as the Default Meeting Type
In Control Hub, you can specify that future scheduled meetings for your organization be private meetings.
| 1 |
From the customer view in https://admin.webex.com, go to . |
| 2 |
Click Edit settings from the Video Mesh card. Scroll to Private Meetings and enable the setting. |
| 3 |
Save your change. |
When you enable this setting, it applies to all meetings for your organization, even those previously scheduled.
(Optional) Reserve a Cluster for Private Meetings
Private and non-private meetings normally use the same Video Mesh resources. But, because private meetings must keep media local, they can’t set up overflows to the cloud when the local resources are exhausted. To mitigate that possibility, you can set up a Video Mesh cluster to host only private meetings.
In Control Hub, you configure the cluster exclusively for hosting private meetings. This setting prevents non-private meetings from using that cluster. Private meetings default to using that cluster. If the cluster runs out of resources, private meetings cascade only to your other Video Mesh clusters.
We recommend that you provision a private cluster to handle your expected peak usage from private meetings.
You can't use the short video address format (meet@your_site) if you reserve all Video Mesh clusters for private meetings. These calls currently fail without a proper error message. If you leave some clusters unreserved, calls with the short video address format can connect through those clusters. |
| 1 |
From the customer view in https://admin.webex.com, go to and click Show all on the Video Mesh card. |
| 2 |
Select your Video Mesh cluster from the list and click Edit cluster settings. |
| 3 |
Scroll to Private Meetings and enable the setting. |
| 4 |
Save your change. |
Error Messages for Private Meetings
This table lists the possible errors that users might see when joining a private meeting.
|
Error Message |
User Action |
Reason |
|---|---|---|
|
External Network Access Denied You need to be on the corporate network to attend the Private Meeting. Paired Webex devices located outside the corporate network would not be able to join the meeting, in such a scenario try connecting your laptop, mobile to the corporate network and join the meeting in unpaired mode. |
An external user joins from outside the corporate network without VPN or MRA. |
To join a private meeting, external users need access to the corporate network through a VPN or MRA. |
|
An external user is on VPN, but they're paired to an unauthenticated device. |
Device media doesn't tunnel to the corporate network through the VPN. The device can't join a private meeting. Instead, after connecting to VPN, the remote user should join a private meeting in device unpaired mode from their desktop or mobile client. | |
|
No Available Clusters The clusters hosting this private meeting are at peak capacity, unreachable, offline, or not registered. Please contact your IT admin for assistance. |
A user is on the corporate network (on-premises or remote by VPN), but can’t join a private meeting. |
Your Video Mesh clusters are:
|
|
Not Authorized You are not authorized to attend this Private meeting as you are not a member of the Host Organization. Please reach out to the Host of the meeting. |
A user from a different org than the host org tries to join the private meeting. |
Only users belonging to the host org can join a private meeting. |
|
A device from a different org than the host org tries to join the private meeting. |
Only devices belonging to the host org can join a private meeting. |
Keep your media on Video Mesh for all external Webex meetings
When your media runs through your local Video Mesh nodes, you get better performance and use less internet bandwidth.
In previous releases, you controlled the use of Video Mesh for meetings only for your internal sites. For meetings that are hosted on external Webex sites, those sites controlled if Video Mesh could cascade to Webex. If an external site didn't allow Video Mesh cascades, your media always used the Webex cloud nodes.
With the Prefer Video Mesh for All External Webex Meetings setting, if your Webex site has available Video Mesh nodes, your media runs through those nodes for meetings hosted on external Webex sites. This table summarizes the behavior for your participants joining Webex meetings:
| Setting is... | Meeting on internal Webex site with Video Mesh cascades enabled | Meeting on internal Webex site with Video Mesh cascades disabled | Meeting on external Webex site with Video Mesh cascades enabled | Meeting on external Webex site with Video Mesh cascades disabled |
|---|---|---|---|---|
| Enabled | Media uses your Video Mesh nodes. | Media uses cloud nodes. | Media uses your Video Mesh nodes. | Media uses your Video Mesh nodes. |
| Disabled | Media uses your Video Mesh nodes. | Media uses cloud nodes. | Media uses your Video Mesh nodes. | Media uses cloud nodes. |
This setting is off by default, which maintains the behavior from previous releases. In those releases, your Video Mesh didn’t cascade to Webex and your participants joined through the Webex cloud nodes.
| 1 |
In the customer view in https://admin.webex.com, go to and click Show all on the Video Mesh card. |
| 2 |
Select your Video Mesh cluster in the list and click Edit settings. |
| 3 |
Scroll to Prefer Video Mesh for All External Webex Meetings and enable the setting. |
| 4 |
Save your change. |
Optimize utilization of your Video Mesh deployment
You can land all your clients on your Video Mesh clusters for an improved user experience through Video Mesh. If your Video Mesh cluster capacity is temporarily down or you have increased usage, you can optimize your Video Mesh cluster utilization by controlling which client types land on Video Mesh clusters. This helps manage your existing capacity effectively until you can add more nodes to meet the demand.
See the Analytics portal on Control Hub to understand usage, utilization, redirect, and overflow trends. Based on these trends, you could, for example, choose to have the desktop clients or SIP devices land on Video Mesh clusters, and have the mobile clients land on Webex cloud nodes. Compared to the mobile clients, the desktop clients and SIP devices support higher resolution, have larger screens, and use more bandwidth, and you can optimize the user experience for the participants using those client types.
You can also optimize the cluster capacity and maximize the user experience by having the client types that most of your customers use land on Video Mesh clusters.
| 1 |
Sign in to Control Hub, then select . - or - Select . |
| 2 |
Under Client Type Inclusion Settings, all client types are checked by default. Uncheck the client types you want to exclude from using the Video Mesh clusters. These clusters are hosted on Webex cloud nodes. |
| 3 |
Click Save. |
Deregister Video Mesh Node
| 1 |
From the customer view in https://admin.webex.com, go to . |
| 2 |
Click View all on the Video Mesh card. |
| 3 |
From the list of resources, go to the appropriate cluster and choose the node. |
| 4 |
Click . A message appears asking you to confirm that you want to delete the node. |
| 5 |
After you read and understand the message, click Deregister Node. |
Move Video Mesh Node
| 1 |
From the customer view in https://admin.webex.com, go to , and then choose View all on the Video Mesh card. |
| 2 |
From the list, select the node that you want to move and then click Actions (the vertical ellipsis). |
| 3 |
Select Move Node. |
| 4 |
Choose the appropriate radio button for where you want to move the node:
|
| 5 |
Click Move Node. Your node moves to the new cluster.
|
Set Video Mesh Cluster Upgrade Schedule
You can set a specific upgrade schedule or use the default schedule of 3 a.m. Daily United States: America/Los Angeles. You can choose to postpone an upcoming upgrade, if necessary.
Software upgrades for Video Mesh are done automatically at the cluster level, which ensures that all nodes are always running the same software version. Upgrades are done according to the upgrade schedule for the cluster. When a software upgrade becomes available, you can manually upgrade the cluster before the scheduled upgrade time.
Before you begin
Urgent upgrades are applied as soon as they are available. |
| 1 |
From the customer view in https://admin.webex.com, go to , and then click View all on the Video Mesh card. | ||
| 2 |
Click a media resource and then click Edit cluster settings. | ||
| 3 |
On the Settings page, scroll to Upgrade, and then choose the time, frequency, and time zone for the upgrade schedule.
| ||
| 4 |
(Optional) If needed, click Postpone to defer the upgrade one time, until the subsequent window. Under the time zone, the next available upgrade date and time are displayed. |
- Upgrade Behavior
-
-
The node makes periodic requests to the cloud to see if an update is available.
-
The cloud does not make the upgrade available until the cluster's upgrade window arrives. When the upgrade window arrives, the node's next periodic update request to the cloud delivers the update information.
-
The node pulls updates over a secure channel.
-
Existing services gracefully shut down to stop incoming calls routing to the node. The graceful shutdown also gives existing calls time to complete (up to 2 hours).
-
The upgrade installs.
-
The cloud only triggers the upgrade for a percentage of nodes in a cluster at a time.
-
Delete Video Mesh Cluster
| 1 |
From the customer view in https://admin.webex.com, go to , and then click View all. | ||
| 2 |
From the list of resources, scroll to the Video Mesh resource that you want to delete, and then click Edit Cluster Settings.
| ||
| 3 |
Click Delete Cluster, and then choose one:
|
Deactivate Video Mesh
Before you begin
Before you deactivate Video Mesh, you will deregister all Video Mesh nodes.
| 1 |
From the customer view in https://admin.webex.com, go to , choose Settings on the Video Mesh card. |
| 2 |
Click Deactivate. |
| 3 |
Review the list of clusters and read the disclaimer in the dialog. |
| 4 |
Check the check box to confirm that you understand this action, and click Deactivate on the dialog. |
| 5 |
When you are ready to deactivate your Video Mesh, click Deactivate Service. Deactivation removes all Video Mesh nodes and clusters. Video Mesh is no longer configured. |
Troubleshoot Video Mesh Node Registration
This section contains possible errors you may encounter during registration of your Video Mesh node to the Webex cloud and suggested steps to correct them.
The domain could not be resolved
This message appears if the DNS settings configured on your Video Mesh node are not correct.
Sign in to the console of your Video Mesh node and make sure the DNS settings are correct.
Could not connect to site using port 443 via SSL
This message appears if your Video Mesh node cannot connect to the Webex cloud.
Make sure your network allows connectivity on the ports required for Video Mesh. For details, see Ports and Protocols Used by Video Mesh.
ThousandEyes integration with Video Mesh
The Video Mesh platform is now integrated with the ThousandEyes agent enabling you to perform end-to-end monitoring across your hybrid digital ecosystem. This integration equips you with a wide array of network monitoring tests opening visibility into areas like proxies, gateways, and routers. Issues anywhere along a customer's network infrastructure can be narrowed down and diagnosed with greater precision, improving the efficiency of their deployment.
Benefits of ThousandEyes Integration
- Provides you multiple test types to choose from. You can configure one or more tests appropriate for the application or asset you want to monitor.
- Enables you to set test thresholds specific to your requirements.
- The test results are available via the ThousandEyes web app and the ThousandEyes API on a real-time basis.
- Greater visibility in troubleshooting – Customers can identify the origin of an issue in their network, reducing resolution times.
Enabling ThousandEyes for Video Mesh
Use this procedure to enable ThousandEyes agent for your Video Mesh deployment.
| 1 |
From Control Hub, click Hybrid on the lower-left side of the screen. | ||
| 2 |
Click Edit Settings on the Video Mesh card. | ||
| 3 |
Scroll down to ThousandEyes Integration. The toggle will be disabled by default. Click on the toggle to enable it. | ||
| 4 |
Click ThousandEyes User Profile, the ThousandEyes web portal opens, sign in using the admin credentials. | ||
| 5 |
A side panel is displayed with the Account Group Token. | ||
| 6 |
Click on the view icon and then click Copy.
| ||
| 7 |
Go back to the Control Hub tab, paste the token in the Agent Token field. | ||
| 8 |
Click Activate, ThousandEyes is now enabled for your Video Mesh deployment. |
What to do next
-
- After 5 minutes, go back to the ThousandEyes webpage, click Cloud and Enterprise Agents,then click Agent Settings. You should be able to view all your nodes listed as agents under Enterprise Agents. If the agents are not displayed, check ThousandEyes Integration card on Control Hub for error messages.
-
- If an error message is displayed, click the toggle, then click Deactivate. Repeat the steps to enable ThousandEyes agent, ensuring that the correct account group token is copied and pasted in the Agent Token field.
Currently, ThousandEyes tests do not support Video Mesh nodes behind a proxy. |
Configuring tests using ThousandEyes
Network Test – Agent-to-Agent
The agent-to-agent network test allows users of ThousandEyes to have ThousandEyes agents at both ends of a monitored path, enabling testing of the path in either or both of two directions: source to target or target to source. For detailed information on how to configure an agent-to-agent test, see Agent-to-Agent Test Overview.
A sample test creation dialog is shown below.
SIP Server Test
SIP server tests facilitate network measurements, BGP data collection and, most importantly, SIP service availability and performance testing against SIP-based VoIP infrastructure.
For detailed information on how to configure a SIP Server test, see SIP Server Test Settings.
A sample test creation dialog is shown below.
RTP Stream Test
An RTP Stream test creates a simulated voice data stream between two ThousandEyes agents acting as the VoIP user agents. RTP packets are sent between one or more agents and a target agent, using UDP as the transport protocol, to obtain Mean Opinion Score (MOS), packet loss, discards, latency, and Packet Delay Variation (PDV) metrics. Metrics produced are one-way metrics (source to target). The RTP Stream test provides server port, call duration, de-jitter buffer size and codec configuration options.
For detailed information on configuring an RTP Stream Test, see RTP Stream Test Settings.
A sample test creation dialog is shown below.
Webex HTTP Server URL Test
This test monitors the primary landing page that your users connect to when they access Webex. A sample test creation dialog is shown below.
Authoritative Webex DNS Server Test
This test is used to ensure that your Webex domain is properly resolving both internally and externally. When using Enterprise Agents, update the DNS Servers field to use your internal name servers. If you use Cloud Agents for external visibility, use the Lookup Servers button to auto-populate the authoritative external name servers. This example shows Cloud Agents resolving cisco.webex.com. You will need to update it to your organization's domain.
A sample test creation dialog is shown below.
'
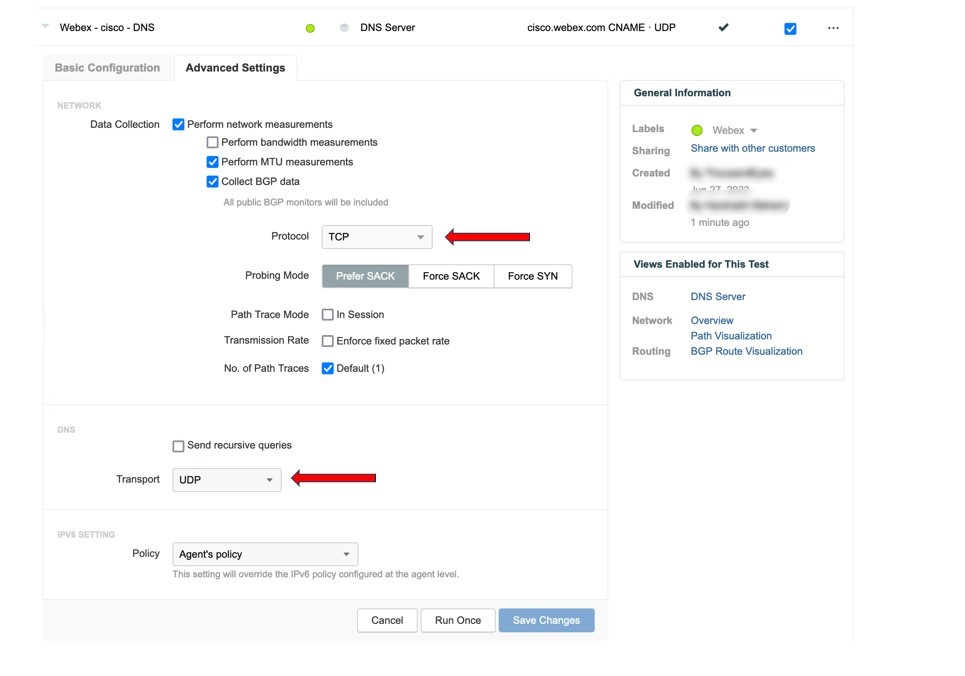
Manage Video Mesh Node From the Web Interface
Before you can make any network changes to Video Mesh nodes that are registered to the cloud, you must use Control Hub to put them in maintenance mode. For more information and a procedure to follow, see Move a Node Into Maintenance Mode.
Maintenance mode is intended solely to prepare a node for shutdown or reboot so that you can make certain networking setting changes (DNS, IP, FQDN) or prepare for hardware maintenance such as replace RAM, hard drive, and so on. Upgrades do not happen when a node is placed in maintenance mode. |
When you place a node into maintenance mode, it does a graceful shutdown of calling services (stops accepting new calls and waits up to 2 hours for existing calls to complete). The purpose of the graceful shutdown of calling services is to allow reboot or shutdown of the node without causing dropped calls.
How to access the Video Mesh overview
You can open the web interface in either of these ways:
-
If you are a Full Administrator and you already registered the node to the cloud, you can access the node from Control Hub.
From the customer view in https://admin.webex.com, go to . Under Resources on the Video Mesh card, click View all. Click on the cluster, and then click on the node that you want to access. Click Go to Node.
Only a Full Administrator for your Webex organization can use this feature. Other administrators, including Partner and External Full Administrators, don't have the Go To Node option for the Video Mesh resources.
-
In a browser tab, navigate to
<IP address>/setup, for example,https://192.0.2.0/setup. Enter the admin credentials that you set up for the node, and then click Sign In.If the admin account has been disabled, this method is not available. See the "Disable or Re-enable the Local Admin Account from Web Interface" section.
The overview is the default page and has the following information:
-
Call Status—Provides the number of ongoing calls through the node.
-
Node Details—Provides the node type, software image, software version, OS version, QoS status, and maintenance mode status.
-
Node Health—Provides usage data (CPU, memory, disk), and service status (Management Service, Messaging Service, NTP Sync).
-
Network Settings—Provides network information: hostname, interface, IP, gateway, DNS, NTP, and whether dual IP is enabled.
-
Registration Details—Provides registration status, organization name, org ID, cluster the node is a part of, and cluster ID.
-
Cloud Connectivity—Runs a series of tests from the node to the Webex cloud and third party destinations that the node needs to access to run properly.
-
Three types of tests are run: DNS resolution, server response time, and bandwidth.
-
DNS tests validate that the node can resolve a particular domain. These tests report as failed if the server does not respond within 10 seconds. They show as "Passed" with an orange "warning color" if the response time is between 1.5 and 10 seconds. The periodic DNS checks on the node generate alarms if the DNS response time is longer than 1.5 seconds.
-
Connect tests validate that the node can connect to a particular HTTPS URL and receive a response (responses other than proxy or gateway errors are accepted as evidence of connection).
-
The list of tests run from the overview page are not exhaustive and do not include websocket tests.
-
The node sends alarms if the calling processes cannot complete websocket connections to the cloud or connect to call-related services.
-
-
A Pass or Fail result appears next to each test; you can hover over this text to see more information about what was checked when the test ran.
-
As shown in the screenshot that follows, alarm notifications can also appear in the side panel, if any alarms were generated by the node. These notifications identify potential issues on the node and make suggestions for how you can troubleshoot or resolve these issues. If no alarms were generated, the notification panel does not appear.
Configure Network Settings From Video Mesh Node Web Interface
If your network topology changes, you can use the web interface for each Webex Video Mesh node and change the network settings there. You may see a caution about changing the network settings, but you can still save the changes in case you're making changes to your network after changing Webex Video Mesh node settings.
| 1 |
Open the Webex Video Mesh node interface. | ||
| 2 |
Go to Network. The current network settings for the node appear. | ||
| 3 |
Change the following settings for Host and Network Configuration as needed:
| ||
| 4 |
Click Save Host and Network Configuration, and after the popup appears that says the node needs to reboot, click Save and Reboot. During the save, all fields are validated on the server side. Warnings that appear generally indicate that the server isn't reachable or a valid response wasn't returned when queried—for example, if the FQDN is not resolvable using the DNS server addresses provided. You may choose to save by ignoring the warning but calls will not work until the FQDN can resolve to the DNS configured on the node. Another possible error state is if the gateway address is not in the same subnet as the IP address. After the Video Mesh Node reboots, the network configuration changes take effect. | ||
| 5 |
Change the following settings for NTP Servers as needed:
| ||
| 6 |
Click Save NTP Servers.
If the NTP server is an FQDN and that isn’t resolvable, a warning is returned. If the NTP server FQDN is resolved but the resolved IP can't be queried for NTP time, a warning is returned. |
Set The External Network Interface From The Video Mesh Node Web Interface
If your network topology changes, you can use the web interface for each Webex Video Mesh node and change the network settings there. You may see a caution about changing the network settings. However, you can still save the changes in case you're making changes to your network after changing Webex Video Mesh node settings.
You can configure the external network interface if you're deploying the Video Mesh Node in your network's DMZ so that you can isolate the enterprise (internal) traffic from the outside (external) traffic.
| 1 |
Open the Webex Video Mesh node interface. |
| 2 |
Go to Network. The current network settings for the node appear. |
| 3 |
Click Advanced. |
| 4 |
Toggle on Enable External Network and then click Ok to enable the external IP address options on the node. |
| 5 |
Enter the External IP Address, External Subnet Mask, and External Gateway values. |
| 6 |
Click Save External Network Configuration. |
| 7 |
Click Save and Reboot to confirm the change. The node reboots to enable the dual IP address, and then automatically configures the basic static routing rules. These rules determine that traffic to and from a private class IP address uses an internal interface; traffic to and from a public class IP address uses an external interface. Later, you can create your own routing rules—For example, if you need to configure an override and allow access to an external domain from the internal interface. |
| 8 |
If there are errors, click Ok to close the error dialog box, fix the errors, and click Save External Network Configuration again. |
What to do next
To validate the internal and external IP address configuration, do the steps in Run a Ping from Video Mesh Node Web Interface.
-
Test an external destination (example, cisco.com); if successful, the results show that the destination was accessed from the external interface.
-
Test an internal IP address; if successful, the results show that the address was accessed from the internal interface.
Add Internal and External Routing Rules From Video Mesh Node Web Interface
In a dual network interface (NIC) deployment, you can fine tune the routing for Video Mesh nodes by adding user-defined route rules for external and internal interfaces. The default routes are added to the nodes, but you can make exceptions—for example, external subnets or host addresses that need to be accessed through the internal interface, or internal subnets or host addresses that need to be accessed from the external interface. Perform the following steps as needed.
Before you begin
| 1 |
Open the Webex Video Mesh node interface. | ||
| 2 |
Go to Network. The current network settings for the node appear. If you have configured the external network, the Routing Rules tab appears. | ||
| 3 |
Click the Routing Rules tab. The first time you open this page, the default system routing rules appear in the list. By default, all internal traffic goes through the internal interface and external traffic through the external interface. You can add manual overrides to these rules in the next steps. | ||
| 4 |
To add a rule, click Add Routing Rule, then choose one of the following option:.
| ||
| 5 |
Click Add Routing Rule. As you add each rule, they appear in the routing rule list, categorized as user defined rules. | ||
| 6 |
To delete one or more user-defined rules, check the check box in the column to the left of the rules and then click Delete Routing Rule(s).
|
Custom routing rules may create potential for conflicts with other routing. For example, you may define a rule that freezes your SSH connection to the Video Mesh Node interface. If this happens, do one of the following and then remove or modify the routing rule:
|
Configure Container Network From Video Mesh Node Web Interface
Video Mesh node reserves a subnet range for internal use within the node. The default range is 172.17.42.0–172.17.42.63. The nodes do not respond to any external-to-Video Mesh node traffic originating from this range. You may want to use the node console to change the container bridge IP address to avoid conflicts with other devices in your network.
| 1 |
Open the Webex Video Mesh node interface. |
| 2 |
Go to Network. The current network settings for the node appear. |
| 3 |
Click Advanced. |
| 4 |
Change the values for Container IP Address and Container Subnet Mask, as needed, and then click Save Container Network Configuration. |
| 5 |
Click Save and Reboot to confirm the change. |
| 6 |
If there are errors, click Ok to close the error dialog box, fix the errors, and click Save Container Network Configuration again. |
Set the Network Interface MTU Sizes
All Webex Video Mesh nodes have path MTU (PMTU) discovery enabled by default. With PMTU, the node can detect MTU issues and adjust the MTU size automatically. When PMTU fails because of firewall or network issues, the node can have connectivity issues to the cloud because packets larger than the MTU drop. Manually setting a lower MTU size can fix this issue.
Before you begin
If you've already registered the node, you must put the node in maintenance mode before you can change the MTU settings.
| 1 |
Open the Webex Video Mesh node interface. |
| 2 |
Go to Network. The current network settings for the node appear. |
| 3 |
Click Advanced. |
| 4 |
In the Interface MTU Settings section, enter an MTU value between 1280 and 9000 bytes in the applicable field(s). If you have enabled the external interface, you can set both the internal and external interface MTU sizes separately. |
What to do next
If you put the node in maintenance mode to change the MTU, turn off maintenance mode.
Enable or Disable DNS Caching
If DNS responses to your Video Mesh nodes regularly take more than 750 ms, or if the Cisco TAC recommends it, you can enable DNS caching. With DNS caching on, the node caches DNS responses locally. With the cache, requests are less prone to delay or timeouts that can lead to connectivity alarms, call drops, or call quality issues. DNS caching can also reduce the load on your DNS infrastructure.
Before you begin
Move the node to maintenance mode. When the maintenance mode status is On (active calls have completed or have dropped at the end of the pending period), you can enable or disable DNS caching.
| 1 |
Open the Webex Video Mesh node interface. |
| 2 |
Go to Network. The current network settings for the node appear. |
| 3 |
Click Advanced. |
| 4 |
In the DNS Caching Configuration section, toggle Enable DNS Caching on or off. |
| 5 |
In the confirmation dialog, click Save and Reboot. |
| 6 |
After the node reboots, reopen the Webex Video Mesh node interface and confirm that the connectivity checks are succeeding on the Overview page. |
When you enable DNS caching, the DNS Cache Statistics displays the following statistics:
|
Statistic |
Description |
|---|---|
|
Cache Entries |
The number of previous DNS resolutions that the DNS Cache server has stored |
|
Cache Hits |
The number of times since the cache reset that the cache handled a DNS request from Video Mesh, without querying the customer DNS server |
|
Cache Misses |
The number of times since the cache reset that the customer DNS server handled a DNS request from Video Mesh rather than through the cache |
|
Cache Hit Percent |
The percent of DNS requests from Video Mesh that the cache handled without querying the customer DNS server |
|
Cache Server Outbound DNS queries |
The number of DNS queries that the Video Mesh DNS cache server made against the customer DNS servers |
|
Cache Server Inbound DNS queries |
The number of DNS queries that Video Mesh made against its internal DNS Cache server |
|
Outbound to Inbound Query Ratio |
The ratio of DNS queries made by Video Mesh against the customer DNS server to the queries made by Video Mesh against its internal DNS Cache server |
|
Inbound Queries Per Second |
The average number of DNS queries per second that Video Mesh made against its internal DNS Cache server |
|
Outbound Queries Per Second |
The average number of DNS queries per second that Video Mesh made against the customer DNS servers |
|
Outbound DNS Latency [time range] |
The percent of DNS queries that Video Mesh made against the customer DNS servers where the response time fell into the described time range |
Use the Wipe DNS Cache button to reset the DNS cache when TAC requests. After wiping the DNS cache, you see a higher Outbound to Inbound Query Ratio as the cache replenishes. You don't need to place the node in maintenance mode to wipe the cache.
What to do next
Move the node out of maintenance mode. Then repeat the task on any other nodes that require a change.
Upload Security Certificates
Set up a trust relationship between the node and an external server, such as a syslog server.
In a clustered environment, you must install CA and server certificates on each node individually. |
| 1 |
Open the Webex Video Mesh node interface. | ||
| 2 |
When setting up TLS with another server, such as a syslog server, we recommend for security reasons that you use a CA signed certificate on your Video Mesh nodes instead of the node's default self-signed certificate. To create and upload the certificate and key pairs on the Video Mesh node, go to Server Certificates, and follow these steps:
| ||
| 3 |
Choose an option depending on how the external server's CA certificate is signed:
| ||
| 4 |
Get the certificate or certificate trust list (CTL) that the external server uses. As with the Video Mesh node certificate, save the external server file somewhere that's easy to remember. | ||
| 5 |
Go back to the Webex Video Mesh node interface tab, click Trust Store & Proxy, then choose an option:
A Video Mesh node that's registered to the cloud waits up to 2 hours for any calls to end and puts itself into a temporary inactive state (quiesces). To install the certificate, the node must reboot and does so automatically. When it comes back online, a prompt appears when the certificate is installed on the Video Mesh node, and you can then reload the page to view the new certificate. | ||
| 6 |
Repeat the certificate or certificate chain upload on every other Video Mesh node in the same cluster. |
Generate Video Mesh Logs for Support
You may be instructed to send logs directly to Cisco, or you can download them yourself to attach to a case. Use this procedure from the web interface to generate logs and send them to Cisco or download them from any Video Mesh nodes. The generated log package contains media logs, system logs, and container logs. The bundle provides useful information for connectivity to Webex, platform issues, and call setup or media, so that Cisco can troubleshoot your Video Mesh node deployment for you.
| 1 |
Open the Webex Video Mesh node interface. |
| 2 |
Go to Troubleshooting, and then choose an option next to Send Logs:
Generated logs are historically stored on the node and remain on the node even after reboots. An upload identifier shows on the page. Support uses this value to identify your uploaded logs. |
| 3 |
When you open a case or interact with the Cisco TAC, include the upload identifier value so that your support engineer can access the logs. If you submitted the log to Cisco directly, you don't need to upload the log bundle to the TAC case. |
What to do next
While logs are uploading to Cisco or being downloaded, you can run a packet capture from the same screen.
Generate Video Mesh Packet Captures for Support
You can run a packet capture (PCAP) and submit it to Cisco for further analysis. A packet capture takes a snapshot of data packets that go through the node's network interfaces. After packets are captured and submitted, Cisco can analyze the submitted capture and help with troubleshooting your Video Mesh node deployment.
Before you begin
The packet capture functionality is intended for debugging purposes only. If you run a packet capture on a live Video Mesh node that is hosting active calls, the packet capture may affect the performance of the node and the generated file might be overwritten. This causes a loss of captured data. We recommend that you run the packet capture only during off peak hours or when the call count is less than 3 on the node. |
| 1 |
Open the Webex Video Mesh node interface. |
| 2 |
Go to Troubleshooting. You can start the packet capture and upload logs at the same time. |
| 3 |
(Optional) In the Packet Capture section, you can limit the capture to packets on a specific interface, filter by packets to or from specific hosts, or filter by packets on one or more ports. |
| 4 |
To begin the process, toggle on the Start Packet Capture setting. |
| 5 |
When you are done, toggle off the Start Packet Capture setting. |
| 6 |
Choose one:
After a package capture is uploaded, an upload identifier shows on the page. Support uses this value to identify your uploaded packet capture. The maximum size for packet captures is 2 GB. |
| 7 |
When you open a case or interact with the Cisco TAC, include the upload identifier value so that your support engineer can access the packet capture. |
Run a Ping from Video Mesh Node Web Interface
You can run a ping from the Video Mesh node web interface. This step tests a destination you enter and sees if the Video Mesh node can reach it.
| 1 |
Open the Webex Video Mesh node interface. |
| 2 |
Go to Troubleshooting, scroll to Ping, and then enter a destination address that you want to test in the FQDN or IP Address field under Test Connectivity Using Ping. |
| 3 |
Click Ping. The test runs and you'll see a ping success or failure message. The test does not have a timeout limit. If you receive a failure or the test runs indefinitely, check the destination value that you entered and your network settings. |
Run a Trace Route from Video Mesh Web Interface
You can run a traceroute from the Video Mesh node web interface. This step shows the route taken by packets from the node towards the destination that you enter. Viewing the traceroute information helps you determine why a particular connection might be poor and can help you identify problems.
| 1 |
Open the Webex Video Mesh node interface. |
| 2 |
Go to Troubleshooting, scroll to Traceroute, and then enter a destination address that you want to test in the FQDN or IP Address field under Trace Route to Host. The test runs and you'll see trace route success or failure message. The test times out at 16 seconds. If you receive a failure or the test times out, check the destination value that you entered and your network settings. |
Check NTP Server from Video Mesh Node Web Interface
You can enter a FQDN or IP address of a network time protocol (NTP) server to confirm that the Video Mesh node can access the server. This test is helpful if you notice time synchronization issues and want to rule out the reachability of the NTP server.
| 1 |
Open the Webex Video Mesh node interface. |
| 2 |
Go to Troubleshooting, scroll to Check NTP Server, and then enter a destination address that you want to test in the FQDN or IP Address field under View SNTP Query Response. The test runs and you'll see a query success or failure message. The test does not have a timeout limit. If you receive a failure or the test runs indefinitely, check the destination value that you entered and your network settings. |
Identify Port Issues With Reflector Tool in the Web Interface
The reflector tool (a combination of a server on the Video Mesh node and client through a Python script) is used to verify whether the required TCP/UDP ports are open from Video Mesh nodes.
Before you begin
-
Download a copy of the Reflector Tool Client (a Python script) from https://github.com/CiscoDevNet/webex-video-mesh-reflector-client.
-
For the script to work properly, ensure that you're running Python 2.7.10 or later in your environment.
-
Currently, this tool supports SIP endpoints to Video Mesh nodes and intracluster verification.
| 1 |
From the customer view in https://admin.webex.com, enable maintenance node for the Video Mesh Node by following these instructions. |
| 2 |
Wait for the node to show a 'Ready for maintenance' status in Control Hub. |
| 3 |
Open the Webex Video Mesh node interface. For instructions, see Manage Video Mesh Node From the Web Interface. |
| 4 |
Scroll to Reflector Tool, and then start either the TCP Reflector Server or UDP Reflector Server, depending on what protocol you want to use. |
| 5 |
Click Start Reflector Server, and then wait for the server to start successfully. You'll see a notice when the server starts. |
| 6 |
From a system (such as a PC) on a network that you want Video Mesh nodes to reach, run the script with the following command:
At the end of the run, the client shows a success message if all the required ports are open:
The client shows a failed message if any required ports are not open:
|
| 7 |
Resolve any port issues on the firewall and then rerun the above steps. |
| 8 |
Run the client with
|
Enable Debug User Account From Video Mesh Node Web Interface
If Cisco TAC requires access to the Webex Video Mesh node, you can temporarily enable a debug user account so that support can run further troubleshooting.
| 1 |
Open the Webex Video Mesh node interface. |
| 2 |
Go to Troubleshooting, and then toggle on the Enable Debug User setting. An encrypted passphrase appears that you can provide to Cisco TAC. |
| 3 |
Copy the passphrase, paste it in the support ticket or directly to the support engineer, and then click OK when you have it saved. |
The debug user account is valid for 3 days, after which it expires.
What to do next
You can disable the account before it expires if you return to the Troubleshooting page and then toggle off the Enable Debug User setting.
Factory Reset a Video Mesh Node From The Web Interface
As part of deregistration cleanup, you can factory reset the Video Mesh node from the web interface. This step removes any configuration you put in place while the node was active but does not remove the virtual machine entry. Later, you may want to reregister this node as part of another cluster that you build from scratch.
Before you begin
You must use Control Hub to deregister the Video Mesh node from the cluster that's registered in Control Hub.
| 1 |
Open the Webex Video Mesh node interface. |
| 2 |
Go to Troubleshooting, scroll to Factory Reset, and then click Reset Node. |
| 3 |
Ensure that you understand the information in the warning prompt that appears, and then click Reset and Reboot. The node reboots automatically after the factory reset. |
Disable or Re-enable the Local Admin Account From Web Interface
When you install a Webex Video Mesh node, you initially sign in using a built-in local account with the user name "admin." Once you register the node to the Webex cloud, you can use your Webex organization administration credentials to manage your Video Mesh nodes from Control Hub. This way, the administrator account policy and management processes that apply to Control Hub also apply to your Video Mesh nodes. For further control, you can disable the built-in "admin" account so that Control Hub handles all administrator authentication and management.
Use these steps after you have registered the node to the cloud to disable (or later re-enable) the admin user account. When you disable the admin account, you must use Control Hub to access the node web interface.
Only a Full Administrator for your Webex organization can use this feature. Other administrators, including Partner and External Full Administrators, don't have the Go To Node option for the Video Mesh resources. |
| 1 |
From the customer view in https://admin.webex.com, go to . | ||
| 2 |
Under Resources on the Video Mesh card, click View all. | ||
| 3 |
Click on the cluster and then click on the node that you want to access. Click Go to Node. | ||
| 4 |
Go to Administration. | ||
| 5 |
Toggle the Enable Admin User Sign In switch off to disable the account, or on to re-enable it.
| ||
| 6 |
On the confirmation screen, click Disable or Enable to complete the change. |
Once you disable the admin user, you can't sign in to the Video Mesh node through the WebUI or the CLI launched from SSH. However, you can sign in using the admin user credentials through a CLI launched from the VMware ESXi console.
Change Admin Passphrase From Web Interface
Use this procedure to change the administrator passphrase (password) for your Webex Video Mesh node by using the web interface.
| 1 |
Open the Webex Video Mesh node interface. |
| 2 |
Go to Administration, and next to Change Passphrase, click Change. |
| 3 |
Enter the Current Passphrase, and then enter a new passphrase value in both New Passphrase and Confirm New Passphrase. |
| 4 |
Click Save Passphrase. A "password changed" message appears and then you go back to the sign in screen. |
| 5 |
Sign in using your new admin login and passphrase (password). |
Change Passphrase Expiry Interval From the Web Interface
Use this procedure to change the default passphrase expiry interval of 90 days by using the web interface. When the interval is up, you are prompted to enter a new passphrase when you sign into the Video Mesh node.
| 1 |
Open the Webex Video Mesh node interface. |
| 2 |
Go to Administration, and next to Change Passphrase Expiry, enter a new value for Expiry Interval (Days) (up to 365 days), and then click Save Passphrase Expiry Interval. A success screen appears, and you can then click OK to finish. |
The Administration page also shows dates for the last passphrase change and the next time the password expires.
Set External Logging to a Syslog Server
If you have a syslog server, you can set your Webex Video Mesh node to log to the external server audit trail information, such as:
-
Details on administrator sign-ins
-
Configuration changes (including turning maintenance mode on or off)
-
Software updates
The node aggregates the logs, if any, and sends them to the server every ten minutes.
| 1 |
Open the Webex Video Mesh node interface. |
| 2 |
Go to Administration. |
| 3 |
Next to External Logging, toggle on Enable External Logging. |
| 4 |
For Syslog Server Details, enter the host IP address or fully-qualified domain name and the syslog port. If the server isn’t DNS-resolvable from the node, use an IP address in the Host field. |
| 5 |
Choose the Protocol—UDP or TCP. To use TLS encryption, choose TCP and then toggle on Enable TLS. Make sure that you also upload and install the security certificates required for TLS communication between the node and the syslog server. If no certificates are installed, the node defaults to using its self-signed certificates. For help, see Upload Security Certificates. |
| 6 |
Click Save External Logging Configuration. |
The properties of the log message follow this format: Priority Timestamp Hostname Tag Message.
|
Property |
Description |
|---|---|
|
Priority |
The value is always 131, based on the formula: Priority = (Facility Code * 8) + Severity. The facility code is 16 for "local0". The severity is 3 for "notice". |
|
Timestamp |
The timestamp format is "Mmm dd hh:mm:ss". |
|
Hostname |
The hostname for the Video Mesh node. |
|
Tag |
The value is always syslogAuditMsg. |
|
Message |
The message is a JSON string of at least 1KB. Its size depends on the number of aggregated events in the ten minute interval. |
Here is an example message:
{
  "events": [
    {
      "event": "{\hostname\": \"test-machine\", \"event_type\": \"login_success\",
       \"event_category\": \"node_events\", \"source\": \"mgmt\", \"session_data\":
       {\"session_id\": \"j02wH5uFTKB22SqdYCrzPrqDWkXIAKCz\", \"referer\":
       \"https://IP address/signIn.html?%2Fsetup\", \"url\":
       \"https://IP address/api/v1/auth/signIn\", \"user_name\": \"admin\",
       \"remote_address\": \"IP address\", \"user_agent\": \"Mozilla/5.0
       (Macintosh; Intel Mac OS X 10_15_7) AppleWebKit/537.36 (KHTML, like Gecko)
       Chrome/87.0.4280.67 Safari/537.36\"}, \"event_data\": {\"type\": \"Conf_UI\"},
       \"boot_id\": \"6738705b-3ae3-4978-8502-13b74983e999\", \"timestamp\":
       \"2020-12-07 22:40:27 (UTC)\", \"uptime\": 358416.23, \"description\":
       \"Log in to Console or Web UI successful\"}"
    },
    {
      "event": "{\hostname\": \"test-machine\", \"event_type\":
       \"software_update_completed\", \"event_category\": \"node_events\", \"source\":
       \"mgmt\", \"event_data\": {\"release_tag\": \"2020.12.04.2332m\"}, \"boot_id\":
       \"37a8d17a-69d8-4b8c-809d-3265aec56b53\", \"timestamp\":
       \"2020-12-07 22:17:59 (UTC)\", \"uptime\": 137.61, \"description\":
       \"Completed software update\"}"
    }
  ]
}
Webhooks for Video Mesh alerts
Video Mesh supports Webhook alerts which enable organization admins to receive alerts on specific events. Admins can choose to be notified of events like call overflows and call redirects, minimizing the need to log in to Control Hub for monitoring their deployment. This is achieved by creating a webhook subscription where a target URL is provided by the admin, to which alerts will be sent. Using webhooks for alerts also allows monitoring of parameters without using the associated developer APIs.
The following event types can be monitored through webhooks:
-
Cluster Call Redirects – Calls redirected from a particular cluster.
-
Org Call Overflows – Total call overflows to cloud for an organization.
Create a Webhook subscription
| 1 |
Log in to the Cisco Webex Developer portal using admin credentials. |
| 2 |
On the developer portal, click Documentation. |
| 3 |
From the scroll bar on the left, scroll down and click Full API Reference. |
| 4 |
From the options that expand below, scroll down, and click Webhooks > Create a Webhook. |
| 5 |
Create a subscription by entering the following parameters: |
-
name: example – Video Mesh Webhook alerts
-
targetUrl: example - https://10.1.1.1/webhooks
-
resource: videoMeshAlerts
-
event: triggered
-
ownedBy: org
The URL entered in the targetUrl parameter must be internet-accessible and have a server that is configured to accept POST requests sent by Webex Webhook. |
Setting threshold configurations with developer APIs
You can set threshold values for the events (Org Call Overflows and Cluster Call Redirects) with Video Mesh developer APIs. You can set a percentage value for the thresholds, above which a webhook alert will be triggered. For example, if the threshold value is set to 20 for Org Call Overflows, an alert will be sent when more than 20 percent of the calls overflow to cloud.
A set of 4 APIs are available for setting and updating thresholds in the Cisco Webex Developer portal and they are listed below:
-
List Event Threshold Configuration
-
Get Event Threshold Configuration
-
Update Event Threshold Configuration
-
Reset Event Threshold Configuration
The APIs are available at https://developer.webex.com/docs/api/v1/video-mesh.
Scenario 1 - Setting threshold value for Org Calls Overflowed
| 1 |
Click on List Event Threshold Configuration API. | ||
| 2 |
Set | ||
| 3 |
You will receive a response similar to the one shown below. | ||
| 4 |
Copy the value in the | ||
| 5 |
Paste the value in the | ||
| 6 |
Click on Update Event Threshold Configuration API. | ||
| 7 |
Paste the JSON structure in the body of Update Event Threshold Configuration API. | ||
| 8 |
Set | ||
| 9 |
Click Run, your threshold for Org Call Overflows will be set to the new value. |
What to do next
If you want to view the threshold that has been set for a particular event threshold ID,
-
Click on Get Event Threshold Configuration API.
-
Paste the event threshold ID onto the header of the API, click Run.
-
The default minimum threshold value and the set threshold value will be displayed in the response.
Scenario 2 - Setting threshold value for Cluster Calls Redirected
| 1 |
Click on List Event Threshold Configuration API. | ||
| 2 |
Set | ||
| 3 |
The response will list configurations of all clusters in the organization. | ||
| 4 |
Copy the value in the | ||
| 5 |
Paste the value in the | ||
| 6 |
Click on Update Event Threshold Configuration API. | ||
| 7 |
Paste the JSON structure in the body of Update Event Threshold Configuration API. | ||
| 8 |
Set | ||
| 9 |
Click Run, your threshold for Cluster Calls Redirected will be set to the new value. |
What to do next
If you want to view the threshold that has been set for a particular event threshold ID,
-
Click on Get Event Threshold Configuration API.
-
Paste the event threshold ID onto the header of the API, click Run.
-
The default minimum threshold value and the set threshold value will be displayed in the response.
Scenario 3 - Resetting threshold values
| 1 |
Click on Reset Event Threshold Configuration API. | ||
| 2 |
Copy the event threshold ID of a cluster or the org and paste it in the | ||
| 3 |
Paste the JSON structure in the body and click Run. | ||
| 4 |
The threshold value will be set to the default minimum value. |
Video Mesh Developer APIs
The Video Mesh Developer APIs are a way to retrieve analytics and monitoring data for your Video Mesh deployments through the Webex Developer Portal. The APIs are available at https://developer.webex.com/docs/api/v1/video-mesh. A sample client is available at https://github.com/CiscoDevNet/video-mesh-api-client.
Video Mesh Node Demo Software
Use the Video Mesh Node demo software only for basic demo purposes. Do not add a demo node to an existing production cluster. The demo cluster accepts fewer calls than production and expires 90 days after it is registered to the cloud.
|
Download the demo software image from this link.
Specifications
See System and Platform Requirements for Video Mesh Node Software for the specs-based configuration for Video Mesh Node software.
The demo software supports either a single network interface or a dual network interface.
Capacity
We do not test the demo image for capacity. You should only use it to test out basic meeting scenarios. See the use cases that follow for guidance.
Use Cases for the Video Mesh Node Demo Software
- Media Anchored to On-Premises
-
-
Deploy and configure the node with the demo software.
-
Run a meeting that includes the following participants: a Webex App participant, Webex endpoint participant, and a Cisco Webex Board.
-
After the meeting is over, from the customer view in https://admin.webex.com, go to Analytics to access the Video Mesh reports. In the reports, you can see that the media stayed on-premises.
-
- Meeting with Cloud and On-Premises Participants
-
-
Run another meeting with a couple of Webex participants on-premises and one in the cloud.
-
Observe that all participants can seamlessly join and participate in the meeting.
-
Manage Video Mesh Node From the Console
Before you can make any network changes to Video Mesh nodes that are registered to the cloud, you must use Control Hub to put them in maintenance mode. For more information and a procedure to follow, see Move a Node Into Maintenance Mode.
Maintenance mode is intended solely to prepare a node for shutdown or reboot so that you can make certain networking setting changes (DNS, IP, FQDN) or prepare for hardware maintenance such as replace RAM, hard drive, and so on. Upgrades do not happen when a node is placed in maintenance mode. |
When you place a node into maintenance mode, it does a graceful shutdown of calling services (stops accepting new calls and waits up to 2 hours for existing calls to complete). The purpose of the graceful shutdown of calling services is to allow reboot or shutdown of the node without causing dropped calls.
Change Video Mesh Node Network Settings in the Console
If your network topology changes, you have to open the console interface for each Video Mesh node and change the network settings there. You may see a caution about changing the network settings, but you can still save the changes in case you're making changes to your network after changing Video Mesh node settings.
| 1 |
Open the node console interface through the VMware vSphere client and then sign in using the admin credentials. After first time setup of the network settings and if the Video Mesh is reachable, you can access the node interface through secure shell (SSH). | ||
| 2 |
From the main menu of the Video Mesh Node console, choose option 2 Edit Configuration and then click Select. | ||
| 3 |
Read the prompt that the calls will end on the Video Mesh Node, and then click Yes. | ||
| 4 |
Click Static, enter the IP address for the internal interface, Mask, Gateway, and DNS values for your network.
| ||
| 5 |
Enter your organization's NTP server or another external NTP server that can be used in your organization. After you configure the NTP server and save network settings, you can follow the steps in Check Health of Video Mesh Node From Console to verify that the time is synchronizing correctly through the specified NTP servers.
| ||
| 6 |
(Optional) Change the hostname or domain, if required.
| ||
| 7 |
Click Save, and then click Save Changes & Reboot. During the save, DNS validation is performed if you provided a domain. A warning is displayed if the FQDN (hostname and domain) is not resolvable using the DNS server addresses provided. You may choose to save by ignoring the Warning, but calls will not work until the FQDN can resolve to the DNS configured on the node. After the Video Mesh Node reboots, the network configuration changes take effect. |
Change the Administrator Passphrase of the Video Mesh Node
Use this procedure to change the administrator passphrase (password) for your Video Mesh node in the node's console.
| 1 |
Open the node console interface through the VMware vSphere client or SSH into a reachable IP address, and then sign in using the admin credentials. |
| 2 |
Open and log in to the VMware ESXi console of the VM for your Video Mesh node. |
| 3 |
In the main menu, choose option 3 Manage Administrator Passphrase, then 1 Change Administrator Passphrase, and then click Enter. |
| 4 |
Read the information on the password expired page, click Enter, and then click it again after the password expiry message. |
| 5 |
Press Enter. |
| 6 |
After you're signed out of the console, go back to the sign in screen, and then sign in using the admin login and passphrase (password) that you expired. You are prompted to change your password.
|
| 7 |
For Old password, enter the current passphrase, and then press Enter. |
| 8 |
For New password, enter a new passphrase, and then press Enter. |
| 9 |
For Re-enter new password, retype the new passphrase, and then press Enter. A "password changed" message appears and then you go back to the sign in screen.
|
| 10 |
Sign in using your new admin login and passphrase (password). |
Run a Ping from Video Mesh Node Console
You can run a ping from the Video Mesh node console interface. This step tests a destination you enter and sees if the Video Mesh node can reach it.
| 1 |
Open the node console interface through the VMware vSphere client or SSH into a reachable IP address, and then sign in using the admin credentials. |
| 2 |
From the Video Mesh node console, go to 4 Diagnostics, and then choose Ping. |
| 3 |
In the ping field, enter a destination address that you want to test, such as an IP address or hostname, and then click OK. The test runs and you'll see a ping success or failure message. If you receive a failure, check the destination value that you entered and your network settings. |
Enable Debug User Account Through Console
If support requires access to the Video Mesh node, you can use the console interface to temporarily enable a debug user account so that support can run further troubleshooting on your node.
| 1 |
Open the node console interface through the VMware vSphere client or SSH into a reachable IP address, and then sign in using the admin credentials. |
| 2 |
From the Video Mesh node console, go to 4 Diagnostics, choose 2 Enable Debug User Account, and after the prompt, click Yes. |
| 3 |
After a message appears that the debug user account was created successfully, click OK to show the encrypted passphrase. You'll send the encrypted passphrase to support. They use this temporary account and decrypted passphrase to securely access your Video Mesh node for troubleshooting. This account expires after 3 days, or you can disable it when support is finished. |
| 4 |
Select the start and end of the encrypted data, and copy-paste it into the support ticket or email that you're sending to support. |
| 5 |
After you send this information to support, return to the Video Mesh node console and press any key to go back to the main menu. |
What to do next
The account expires in 3 days, but when support indicates that they finished troubleshooting on the node, you can return the Video Mesh node console, go to 4 Diagnostics, and then choose 3 Disable Debug User Account to disable the account before it expires.
Send Logs from Video Mesh Node Console
You may be instructed to send logs directly to Cisco or through secure copy (SCP). Use this procedure to send logs directly from any Video Mesh nodes that you registered to the cloud.
| 1 |
Open the node console interface through the VMware vSphere client or SSH into a reachable IP address, and then sign in using the admin credentials. |
| 2 |
In the main menu, click option 4 Diagnostics and then press Enter. |
| 3 |
Click 4 Export Log Files, provide feedback if you want, and then click Next. |
| 4 |
Choose an option:
|
| 5 |
Choose OK to return to the Video Mesh node main menu. |
| 6 |
(Optional) Choose 5 Check Status of Log Files Sent to Cisco if you sent the logs to Cisco. |
What to do next
After you send logs, we recommend that you send feedback directly from the Webex App so that your support contacts have all the information that they need to help you. |
Check Health of Video Mesh Node From Console
You can view the node health directly from the Video Mesh node itself. The results are informational, but could aid in troubleshooting steps—for example, if NTP synchronization is not working, you can check the NTP server value in the network settings.
| 1 |
Open the node console interface through the VMware vSphere client or SSH into a reachable IP address, and then sign in using the admin credentials. |
| 2 |
From the Video Mesh node console, go to 4 Diagnostics, and then choose 6 Check Node Health to view the following information about the node:
|
Configure Container Network on Video Mesh Node
Video Mesh node reserves a subnet range for internal use within the node. The default range is 172.17.42.0–172.17.42.63. The nodes do not respond to any external-to-Video Mesh node traffic originating from this range. You may want to use the node console to change the container bridge IP address to avoid conflicts with other devices in your network.
| 1 |
Open the node console interface through the VMware vSphere client or SSH into a reachable IP address, and then sign in using the admin credentials. |
| 2 |
From the main menu of the Video Mesh node console, go to 4 Diagnostics, and then choose 7 Configure Container Network. After the caution that states that active calls will end on the node, click Yes. |
| 3 |
Change the values for Container Bridge IP and Network Mask, as needed, and then click Save. You'll see a screen that shows the container network information, including the IP address range reserved for internal operations on the Video Mesh node. |
| 4 |
Click OK. |
Identify Port Issues With Reflector Tool in Console
The reflector tool (a combination of a server on the Video Mesh node and client through a Python script) is used to verify whether the required TCP/UDP ports are open from Video Mesh nodes.
Before you begin
-
Download a copy of the Reflector Tool Client (Python script) and then unzip the file to a location that's easy to find. The zip file contains the script and a readme file.
-
For the script to work properly, ensure that you're running Python 2.7.10 or later in your environment.
-
Currently, this tool supports SIP endpoints to Video Mesh nodes and intracluster verification.
| 1 |
From the customer view in https://admin.webex.com, enable maintenance node for the Video Mesh Node by following these instructions. |
| 2 |
Wait for the node to show a 'Ready for maintenance' status in Control Hub. |
| 3 |
Open the node console interface through the VMware vSphere client or SSH into a reachable IP address, and then sign in using the admin credentials. |
| 4 |
From the Video Mesh Node interface, go to Diagnostics > Reflector Server > Reflector Server for TCP or (UDP). Start the server either for TCP or for UDP. |
| 5 |
Scroll to Reflector Tool, and then start either the TCP Reflector Server or UDP Reflector Server, depending on what protocol you want to use. |
| 6 |
Click Start Reflector Server, and then wait for the server to start successfully. You'll see a notice when the server starts. |
| 7 |
From a system (such as a PC) on a network that you want Video Mesh nodes to reach, run the script with the following command:
At the end of the run, the client shows a success message if all the required ports are open:
The client shows a failed message if any required ports are not open:
|
| 8 |
Resolve any port issues on the firewall and then rerun the above steps. |
| 9 |
Run the client with
|
Factory Reset a Video Mesh Node From Console
As part of deregistration cleanup, you can factory reset the Video Mesh node. This step removes any configuration you put in place while the node was active, but does not remove the virtual machine entry. Later, you may want to reregister this node as part of another cluster that you build from scratch.
Before you begin
You must use Control Hub to deregister the Video Mesh node from the cluster that's registered in Control Hub.
| 1 |
Open the node console interface through the VMware vSphere client or SSH into a reachable IP address, and then sign in using the admin credentials. |
| 2 |
From the Video Mesh node console, go to 4 Diagnostics, and then choose 8 Factory Reset. |
| 3 |
Ensure that you understand the information in the note that appears, and then click Reset. The node reboots automatically after the factory reset. |
Migrate an Existing Hardware Platform to Video Mesh Node
You can migrate an existing supported platform (for example, a CMS1000 that runs Cisco Meeting Server) to Video Mesh. Use this procedure to guide you through the migration process.
The steps vary, depending on the bundled version of ESXi on the hardware platform. |
Before you begin
Download a new copy of the latest Video Mesh Node software image (OVA). Do not deploy a new Video Mesh node with a previously downloaded OVA.
| 1 |
Sign into the virtual machine interface and then shut down the software that is running on the platform. |
| 2 |
Delete the software application that was running on the platform. There must be no software images remaining on the platform. Also, you cannot run Video Mesh node software alongside other software on the same platform.
|
| 3 |
Deploy a new virtual machine from a new OVF or OVA file. |
| 4 |
Enter a name for the virtual machine and choose the Video Mesh node OVA file. |
| 5 |
Change disk provisioning to Thick. |
| 6 |
Upload the mfusion.ova software image that you downloaded.
|
| 7 |
When the virtual machine is running, return to Log in to the Video Mesh Node Console and continue initial configuration of the Video Mesh node. |
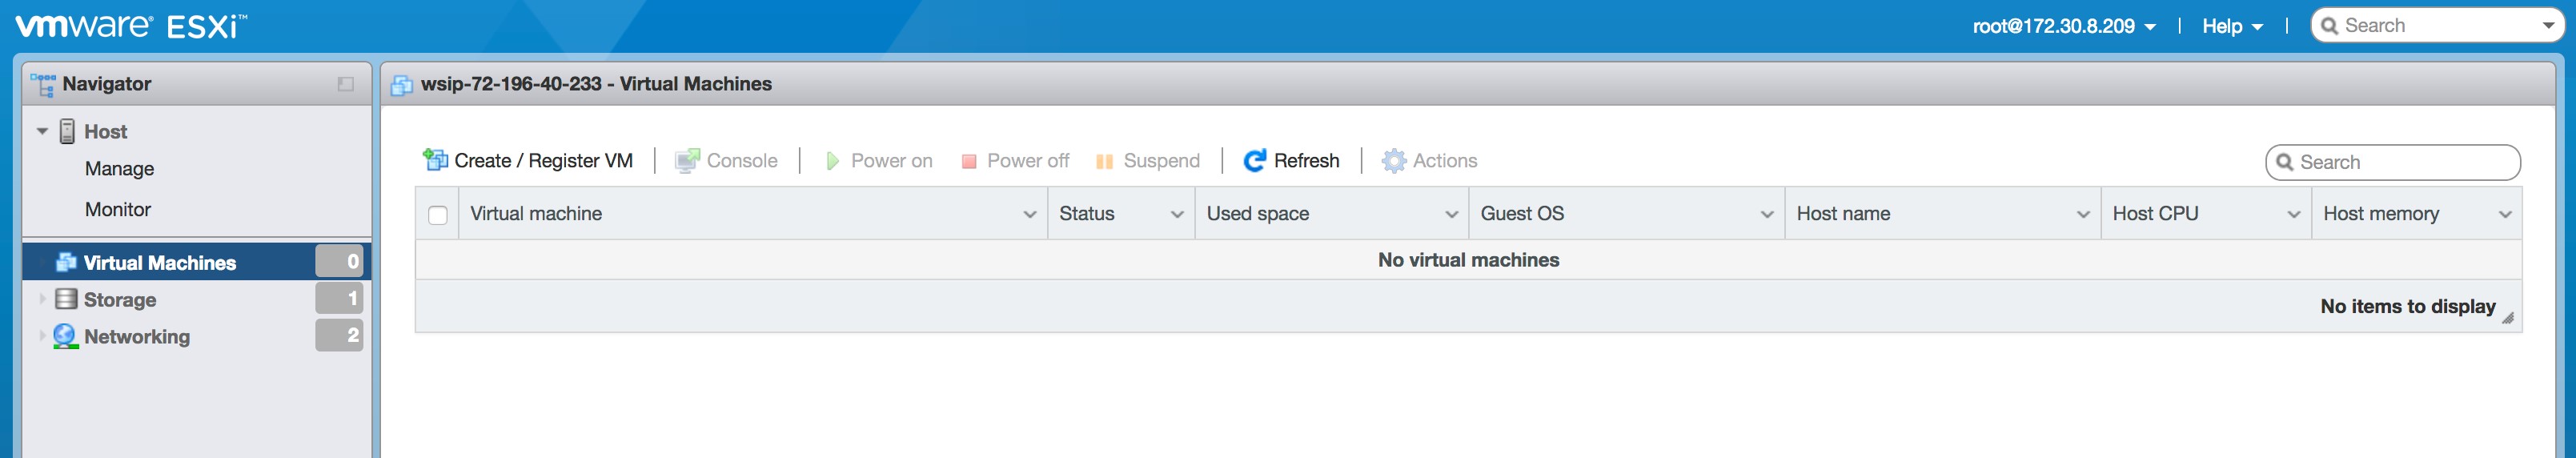
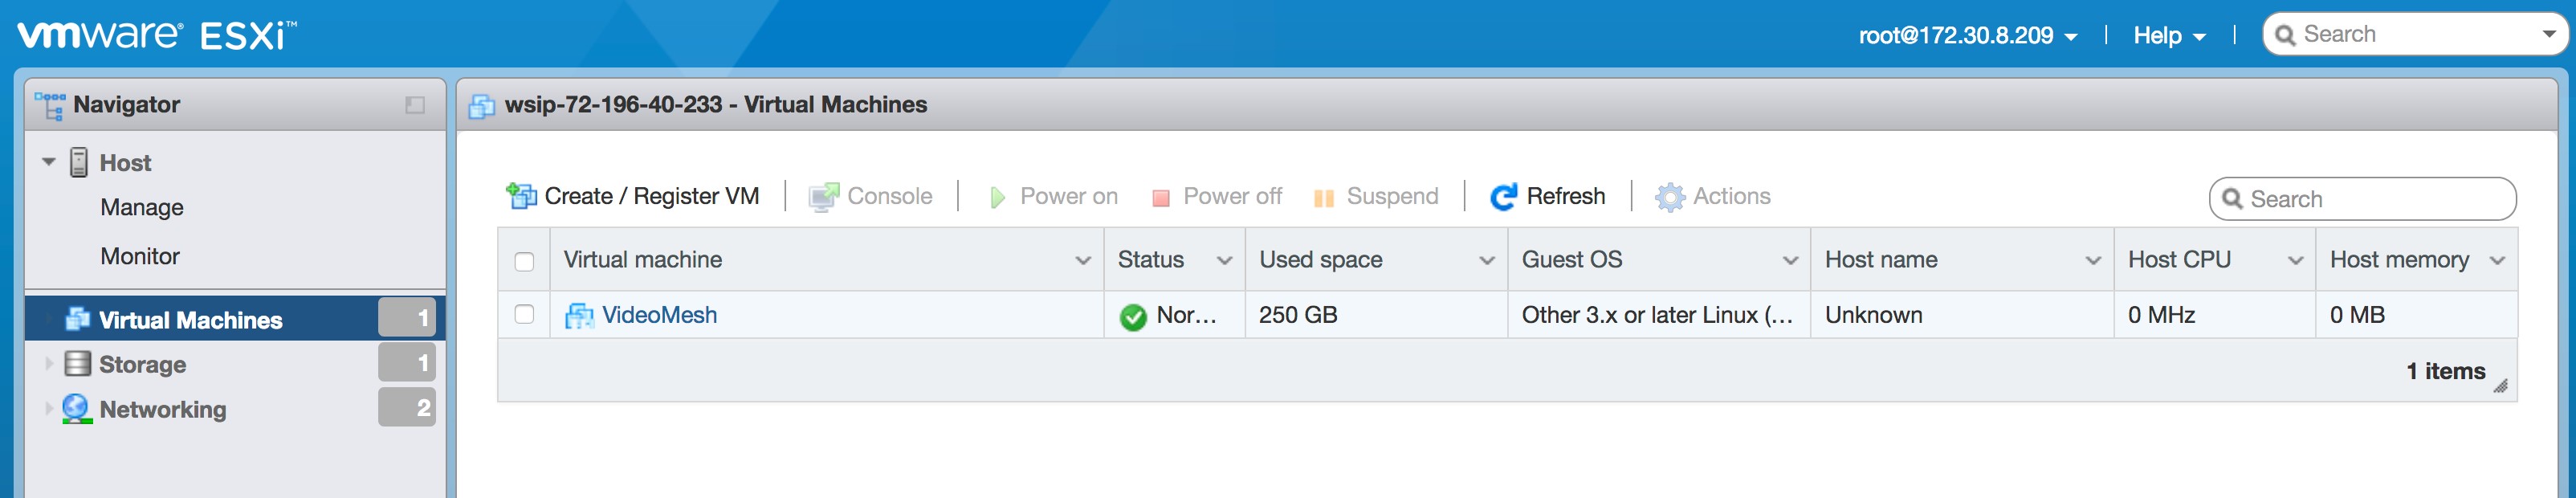
Feature Comparison and Migration Path from Collaboration Meeting Room Hybrid to Video Mesh
Feature Comparison
|
Feature |
Video Mesh and Cisco Webex Meeting Center Video |
CMR Hybrid |
|---|---|---|
|
Meeting Types |
Scheduled One Click (Instant) Personal Meeting (PMR) Consistent experience for premises and cloud-based meetings |
Scheduled only |
|
Scheduling |
Webex Productivity Tool (Windows and Mac) Hybrid Calendar scheduling with @webex Webex Portal |
Webex-enabled TelePresence Windows and Mac Productivity Tools TMS Scheduling |
|
Meeting Join Options |
Dial-in and Dial-out PIN Protected (Host) One Button To Push (OBTP) |
Dial-in only OBTP |
|
In-Meeting Experience |
Unified Roster (Webex Client) Unified Controls (Webex Client) Lock/Unlock meeting Mute/Unmute TelePresence participants |
No Unified Roster (Webex Client and TelePresence Server) Separate Controls (Webex Client and TelePresence Server) |
|
Capacity and Deployment Model |
Unlimited capacity On-premises and automatic overflow Switching and transcoding |
Transcoding capacity limited to the TelePresence Server |
Migration Path Checklist
Below is a high-level overview of how to migrate an existing site to video platform version 2.0 and prepare the site to integrate with Video Mesh. The steps may vary, depending on your existing environment. Work with your partner or customer success manager to ensure a smooth migration.
Make sure that the Meeting Center Video conferencing feature is provisioned on the Webex site.
The site admin receives their management portal account. The admin then deploys Video Mesh nodes for the Webex organization.
The site admin assigns the CMR privilege to enable all or some CMR Hybrid users with Cisco Webex Meeting Center Video.
(Optional) Disable the CMR Hybrid session type for this subset, and then enable Cisco Webex Meeting Center Video in their user profile.
The site admin sets up Video Mesh, and then selects Hybrid as the media resource type under Cloud Collaboration Meeting Room Options.
The site admin sets up on-premises TelePresence Management Suite (TMS) and One Button to Push (OBTP) to work with Cisco Webex Meeting Center Video. See the Cisco Webex Meeting Center Video Conferencing Enterprise Deployment Guide for guidance.
When the CMR privilege is enabled for a user, the Webex Productivity Tools default to the Cisco Webex Meeting Center Video version. All new meetings scheduled by the users are Cisco Webex Meeting Center Video meetings.
If conference rooms are included in the invite, OBTP information is pushed to the conference room through TMS (for CMR Hybrid meetings only).
Existing meetings that were set up by CMR Hybrid users before they were switched to Cisco Webex Meeting Center Video should continue to work as long as the customer preserves the on-premises MCU and TMS settings.
Existing CMR Hybrid meetings cannot be modified or updated to reflect the Cisco Webex Meeting Center Video meeting information. If users want to use new invitation, they must delete the old meetings and create new meetings.
If the customer wishes to retire the on-premises MCU, TMS, old CMR Hybrid meetings will not work. New meetings with Cisco Webex Meeting Center Video information must be created.
TelePresence Interoperability Protocol and Segment Switching
Video Mesh supports negotiating TelePresence Interoperability Protocol (TIP) and multiplex (MUX) for both 1-screen and 3-screen IX and TX endpoints.
For three-screen endpoints, all three screens should show video, if there are enough participants in the conference. Another three-screen system in the conference results in segment switching instead of room switching. This means that rather than all three screens becoming large when someone in another three-screen system speaks, only the active pane becomes large. The other two panes are populated by video from other systems. When shown small, all three panes are rendered together (for all devices, one or three screens) with a single bounding box and name label.
Depending on the hosting resources in the cloud, some endpoints will show all three screens of a three-screen room in the film strip, while others will only show one pane. The Webex App shows just 1 pane, even if the media is on-premises.
For large meetings that overflow from one node and cascade to a second, the same is seen by any endpoints hosted on a different node to the one hosting the three-screen system (only one pane visible in the layout). Presentation sharing requires BFCP to be negotiated through the call path.


