The documentation set for this product strives to use bias-free language. For the purposes of this documentation set, bias-free is defined as language that does not imply discrimination based on age, disability, gender, racial identity, ethnic identity, sexual orientation, socioeconomic status, and intersectionality. Exceptions may be present in the documentation due to language that is hardcoded in the user interfaces of the product software, language used based on RFP documentation, or language that is used by a referenced third-party product. Learn more about how Cisco is using Inclusive Language.
The Cisco ACI Multi-Site (Multi-Site) GUI is a browser-based graphical interface for configuring and monitoring your ACI and APIC implementations.
The GUI is arranged according to function. For example, after you log in and are on the Dashboard click Schemas to go to your schemas page. You can view all of your existing schemas or to create a new schema on this page.
The functionalities of the Multi-Site GUI pages are described in the following sections:
The top of each page shows the controller status indicating how many controllers are operational.
Click the Welcome link to run a troubleshooting report, reset your password, or to log out.
Dashboard
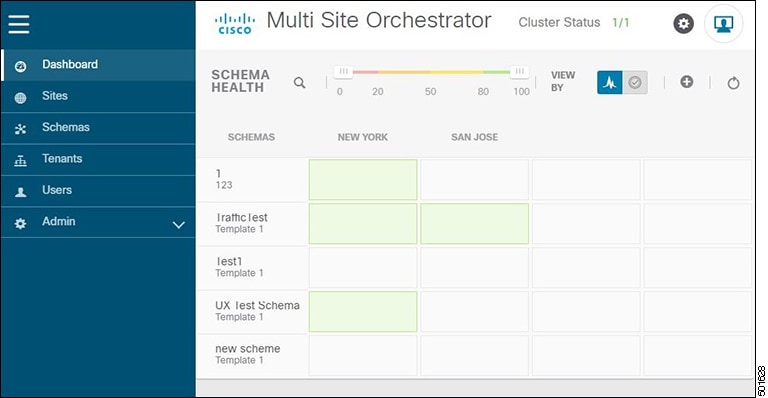
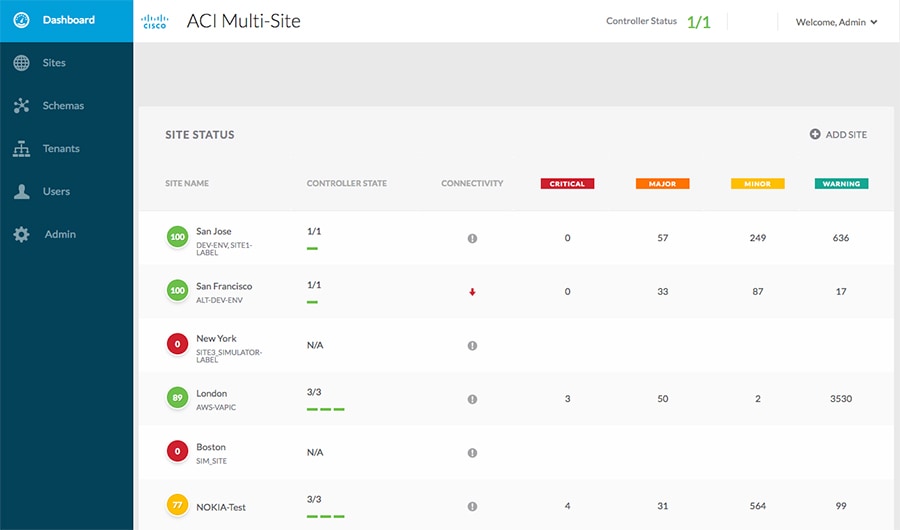
The Multi-Site dashboard displays the list of all of your site implementations in addition to their current functionality and health.
The following screen shot shows the Multi-Site dashboard display:
Figure 1. Multi-Site Dashboard
The Dashboard has the following functional areas:
Site Status: The site status table lists your sites according to name and location. The table also indicates the current health status
for your implementation according to a descriptive color code.
The Controller State column indicates the number of controllers available and running. You can have a maximum number of 3
controllers in your Multi-Site implementation. For example, if one out of the 3 controller is down it is represented as 2/3.
The Connectivity column provides an operational status of the BGP sessions and the dataplane unicast and multicast tunnels
that are connected to the peer sites for each site in the dashboard. This functionality is available starting with Cisco ACI
Multi-Site, Release 1.0(2).
When one or more BGP sessions or tunnels fail to establish, ACI Multi-Site provides the information about which exact local
spines and remote spines failed to establish the BGP session or the tunnel. ACI Multi-Site should be enabled in the site in
the infrastructure configuration, for the BGP sessions and the dataplane unicast and multicast tunnels to be established to
the peer sites.
BGP Sessions
When the BGP peering type is full-mesh in Infra-> General Settings, the spine node in a site with the BGP peering enabled will establish the BGP sessions to all the spine nodes with the BGP
peering enabled in all the peer sites.
When the BGP peering type is route-reflector in Infra-> General Settings, the spine node in a site with both BGP peering enabled and route-reflector enabled, will establish the BGP sessions to all
the spine nodes with the BGP peering enabled in all the peer sites. In the route-reflector mode, at least the local spine
node or the remote spine node or both should have the route-reflector enabled. Otherwise, the BGP session is not established
between them.
If the local and the remote ASNs are different, then it is eBGP. Therefore, the sessions between those sites are always full-mesh,
irrespective of the BGP peering type and the route-reflector configuration.
Unicast and Multicast Tunnels: A spine node in a site that is connected to ISN and has infrastructure configuration, will
establish a tunnel to all the spine nodes that are connected to ISN in the peer sites.
The color codes indicate the following conditions:
Critical (red)
Major (orange)
Minor (yellow)
Warning (green)
The numbers in the color indicator columns indicate the number of faults per site.
+ Add Site: enables you to add another site to our implementation. When you click + Add Site, you must provide the following site details information on the Connection Settings page:
Name: the name of the site
Labels: the label identifier of the site. Multiple labels can be associated to a site.
APIC Controller URL: you can add more APIC controllers with a distinguishing URL of a cluster.
Username and Password: APIC login info with admin level privileges.
Specify Domain For Site: click the switch to on and provide the domain name if default authentication domain is configured in APIC.
After you have entered your details for your new site, click the Save button.
Schema Health: provides a listing of your schemas with locales and health.
Click the magnifying glass icon and enter a schema name to search for a subject schema.
Click + Add Schema to start the procedure for adding a new schema to your site.
Click the site locale in the Schema Health table to view the schema details and status for a template.
The Schema Health table provides a heat map type of display; that is, the health of the subject schema is displayed according to color. Schemas
that span two columns (i.e, locales) indicate a stretched condition.
Click the color highlighted table cell to further discover what policies are incorporated into the subject schema. On the
schema details page, you can click the arrow to go into the schema builder and update the policy details in the subject schema.
The color coded slider enables you to select a range for identifying schemas whose health require further review. For example,
you can adjust the slider value to between 80 and 100. Then all of your schema implementations that fall within that specific
range are displayed on the accompanying Schema Health table.
For more information about sites, refer to Sites Page.
For more information about schemas, refer to Schemas Page.
For more information about creating schemas, refer to Schema Management.
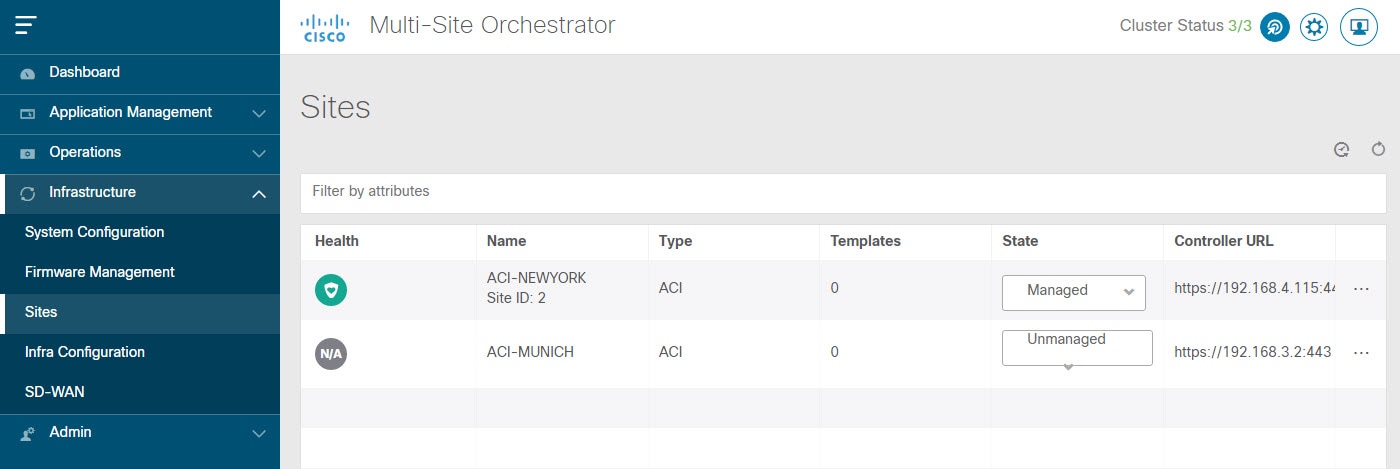
Sites Page
The Multi-SiteSites page displays all of the sites in your implementation. An example of the Sites page is shown in the following screen shot:
Figure 2. Multi-Site Sites Page
The Sites page consists of the following two panes:
Site Name or Label: the site status table lists your sites and then indicates the current health status for your implementation according to
the following color coded identifiers:
Critical (red)
Major (orange)
Minor (yellow)
Warning (green)
When you click a specific site, you can view or edit the site's details on the Connection Settings display:
Name
Labels
APIC Controller URL
Username and Password
Specify Domain For Site
APIC Site ID
If you have made changes to the listed fields, click the Save button.
APIC Controller URLs: the associated APIC URLs for your Multi-Site implementation
Add Site: click the Add Site button to add a site to your implementation. The following details are required for adding a site:
Name: the site name.
Label: select an existing or create a new label.
APIC Controller URL: the existing URL - click + to add a new APIC Controller URL.
Username: the site username.
Password: the unique site password for access.
Specify Domain for Site: click the selector to On to specify a domain for the site.
Actions: drop down menu list option to edit, delete, or open a subject site in the APIC user interface.
Audit Logs
Click the Audit Log icon next to the Configure Infra tab to list the log details for the Sites page. The Audit Logs: Sites List page is displayed.
The table on the page displays the following details:
Date
Action
Details
User
Click the Most Recent tab to select the audit logs during a particular time period. For example, when you select the range from November 14, 2017
to November 17, 2017 and click Apply, the audit log details for this time period are displayed on the Audit Logs page.
Click the Filter icon next to the Most Recent tab to filter the log details using the following criteria:
User: Select one user name or all users and click Apply to filter the log details using the user name.
Action: Select the action, for example, created, updated, or deleted, and click Apply to filter the log details according to the action.
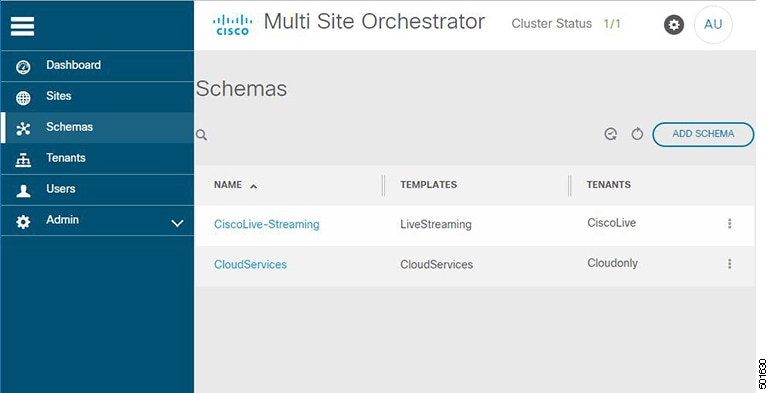
Schemas Page
The Multi-Site Schemas page lists all of the schemas associated with your implementation.
The following screen shot shows an example display:
Figure 3. Multi-Site Schemas Page
Use the magnifying glass and associated field to search for a specific schema. Use schemas to configure or import tenant policies,
including the VRF, application profile with EPGs, filters and contracts, bridge domains, and external EPGs.
The Schemas table shows the following information in tabular form:
Name: click on the schema name to view or update the settings for the subject schema.
Templates: displays the name of the template used for the schema. Templates are analagous to profiles in the ACI context, which group
policies. You can create templates for stretched objects or site-specific objects.
Tenants: displays the name of the tenant used for the subject schema.
Actions: click the Action field with the associated schema to either edit or delete the subject schema.
Click the Add Schema button to add a new schema to your implementation. Further details on creating a schema are described in Schema Management.
Audit Logs
Click the Audit Log icon next to the Add Schema tab to list the log details for the Schemas page. The Audit Logs: Schemas List page is displayed.
The table on the page displays the following details:
Date
Action
Details
User
Click the Most Recent tab to select the audit logs during a particular time period. For example, when you select the range from November 10, 2017
to November 14, 2017 and click Apply, the audit log details for this time period are displayed on the Audit Logs page.
Click the Filter icon next to the Most Recent tab to filter the log details using the following criteria:
User: Select one user name or all users and click Apply to filter the log details using the user name.
Action: Select the action, for example, created, updated, or deleted, and click Apply to filter the log details according to the action.
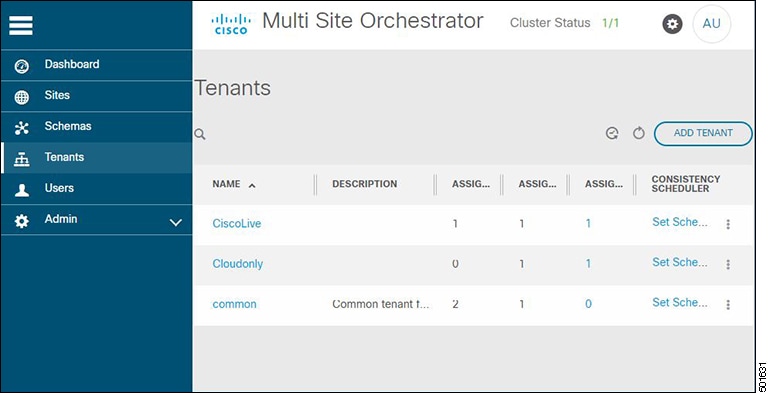
Tenants Page
The Multi-SiteTenants page lists all of the tenants that comprise your implementation.
The following screen shot provides an example:
Figure 4. Multi-Site Tenants Page
The table on the Tenants page displays the following:
Tenant Name
Assigned to Sites
Assigned to Users
Assigned to Schemas
Actions
The features and functionality on this page include the following:
Name: click a tenant name to access the Tenant Details settings page. On the Tenant Details page you can edit or update the following sections:
General Settings: change the Display Name and Description as required.
Associated Sites: view the sites associated with the subject tenant.
Associated Users: view the users associated with the subject tenant - you can associate a user with the subject tenant by checking the empty
box next to the user name.
Associated Schemas: click the Associated Schema listing to view the schemas associated with the subject tenant.
Actions: click the Actions listing to edit the subject tenant's details sites or to create a new network mapping.
Note
You can delete the Tenant object by selecting Delete on the Actions drop down menu.
Add Tenant: click Add Tenant button to add an existing tenant to your implementation. On the proceeding Tenant Details page, you can add the tenant name,
description, security domain, and associated users.
Audit Logs
Click the Audit Log icon next to the Add Tenant tab to list the log details for the Tenants page. The Audit Logs: Tenants List page is displayed.
The table on the page displays the following details:
Date
Action
Details
User
Click the Most Recent tab to select the audit logs during a particular time period. For example, when you select the range from November 10, 2017
to November 14, 2017 and click Apply, the audit log details for this time period are displayed on the Audit Logs page.
Click the Filter icon next to the Most Recent tab to filter the log details using the following criteria:
User: Select one user name or all users and click Apply to filter the log details using the user name.
Action: Select the action, for example, created, updated, or deleted, and click Apply to filter the log details according to the action.
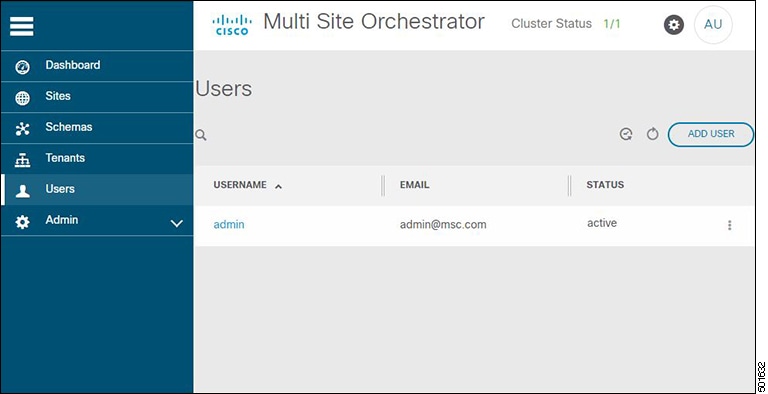
Users Page
The Multi-SiteUsers page displays all of the identified users in your Multi-Site implementation. An example of the Users page is as follows:
Figure 5. Multi-Site Users Page
The Users page features a table containing all of the identified users by username and associated email and current activity status.
If you click a selected Username, you can access the General Setting page attributable to the subject user. On the General Setting page, you can edit the details associated with the subject user such as username, password, email, and switch-on user roles.
Click Add User to add a new user to your Multi-Site implementation. The General Setting page display enables you to assign username, password, email, and switch-on user roles associated with your Multi-Site implementation.
Audit Logs
Click the Audit Log icon next to the Add User tab to list the log details for the Users page. The Audit Logs: Users List page is displayed.
The table on the page displays the following details:
Date
Action
Details
User
Click the Most Recent tab to select the audit logs during a particular time period. For example, when you select the range from November 10, 2017
to November 14, 2017 and click Apply, the audit log details for this time period are displayed on the Audit Logs page.
Click the Filter icon next to the Most Recent tab to filter the log details using the following criteria:
User: Select one user name or all users and click Apply to filter the log details using the user name.
Action: Select the action, for example, created, updated, or deleted, and click Apply to filter the log details according to the action.
Admin Page
When you click the Admin tab on the Cisco ACI Multi-Site page, the Admin tab is displayed.
The following screen shot shows the Multi-Site Admin tab display:
Figure 6. Cisco ACI Multi-Site GUI Admin Tab
The Admin tab lists the following headings and pages:
Authentication
Providers
Login Domains
Backups
Audit Logs
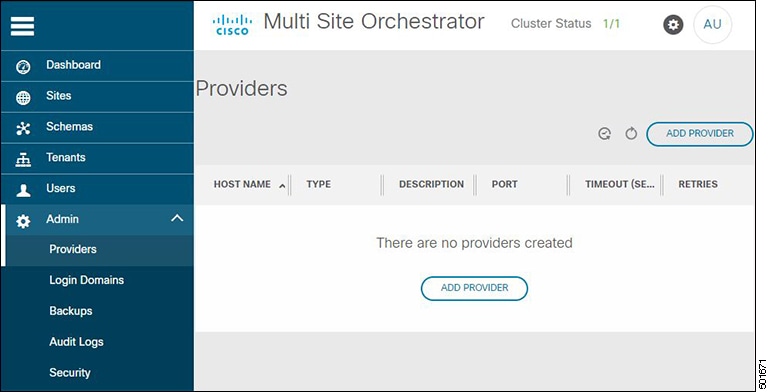
Providers
Click the Providers page under the Authentication heading to display the details on the providers. The following screen shows the Providers page display:
The table on the Providers page displays the following details:
Host Name
Type
Description
Port
Timeout (Sec)
Retries
Actions
To add a new provider, click the Add Provider tab. The Add new provider page is displayed. Complete the following steps on the Add new provider page to add a provider to the deployment:
Enter the host name or IP address, enter the description, select the provider type (RADIUS or TACACS+), enter the key, and
confirm the key.
In the Additional Settings field, enter the port number, select the protocol (PAP or CHAP), enter the timeout value in Seconds, and enter the number
of retries (Maximum 5 allowed).
Click Save.
The provider is listed on the Providers page now.
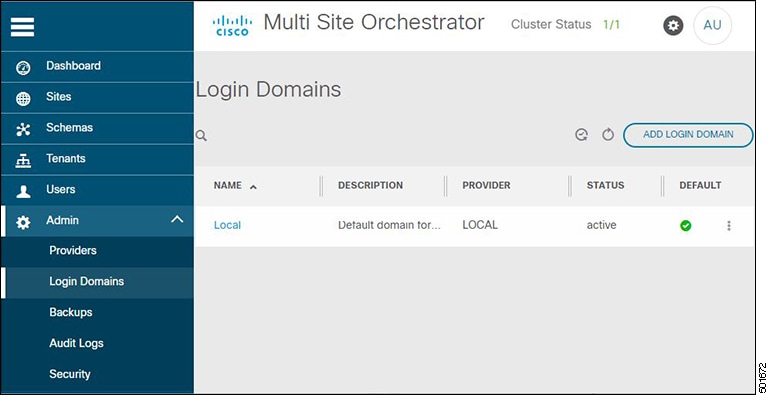
Domains
Click the Login Domains page under the Authentication heading to display the details on the available domains. The following screen shows the Login Domains page display:
The table on the Login Domains page displays the following details:
Name
Description
Provider
Status
Actions
To add a new domain, click the Add Login Domain tab. The Add New Login Domain window is displayed. Complete the following steps on the Add New Login Domain window to add a domain to the deployment:
Enter the name, enter the description, select the realm (RADIUS or TACACS+).
In the Assign to RADIUS providers field, select the providers.
Click Save.
The domain is listed on the Login Domains page now.
Creating Backups
Overview
Starting with Cisco ACI Multi-Site Release 3.1(1), you can create a new database backup or import an existing backup configuration into Cisco ACI Multi-Site.
You can perform the following actions:
Create a new backup
List a backup/backups
Download a backup
Upload a backup
Restore a backup
Delete a backup
The backup functionality works as follows:
Facilitates in a recovery from Multi-Site failures or cluster restarts.
Creates a backup after every configuration change or deployment.
Recovers only the latest backup (in case of need) which is mostly in sync with all the APIC sites.
Exports the backup to an external storage outside of VM.
Note
It is important to note that restoring a backup action restores the database on Multi-Site, but it does not restore the database on the APIC sites. Therefore, when you restore the backup to a previous state, there
could be a mismatch between the APIC and the Multi-Site backups.
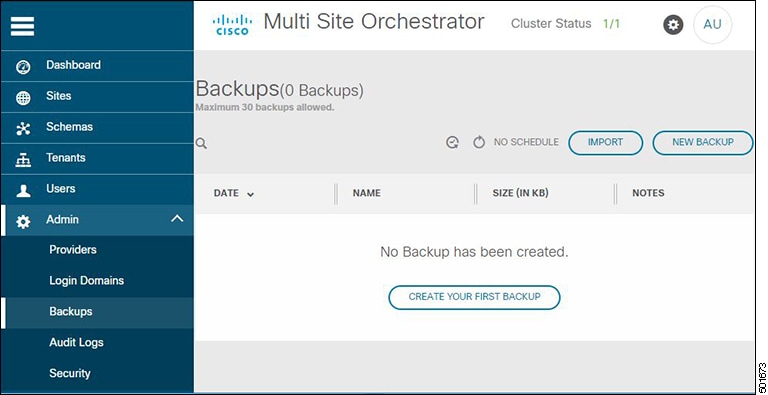
To use the backup functionality, click Backups under the Admin tab. The Backups page displays the details on the available backup in the system. The following screen shows the Backups page display:
The following tabs are displayed on the top of the page:
Audit Log icon: Click the Audit Logs icon to display the audit log of the backups in the system. You can click the Most Recent tab to display the most recent backups. You can also filter the backups using the filter, for example, filter by users or
actions.
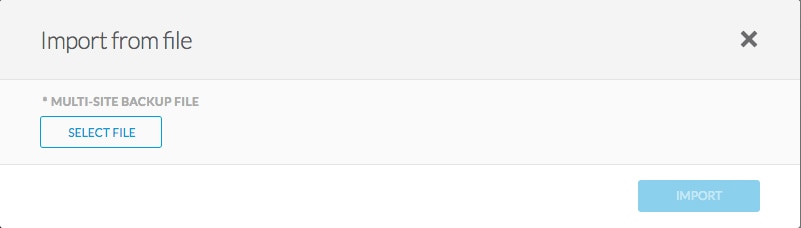
Import tab: Click the Import tab to upload a back up file from your system into Multi-Site. The screenshot displays the Import From File window.
Figure 10. Importing From File
Click Select File, choose the backup file from your system, and click Import. Now, the backup is displayed in the Backups list.
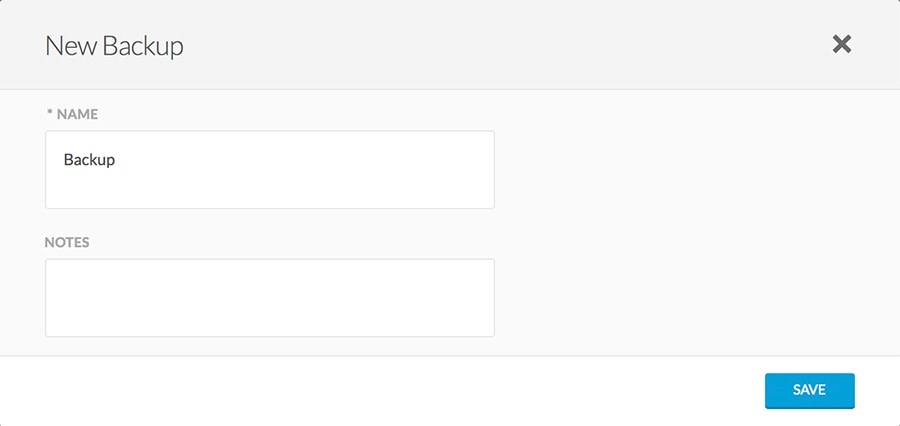
New Backup tab: Click New Backup to add a new backup in your system. The New Backup window is displayed as displayed in the following screenshot:
Figure 11. Adding a New Backup
Complete the following steps on the New Backup page to add a new backup in the system:
Name: Enter the name of the new backup.
Note
It is important to note that the name of the backup can contain only 10 characters, alphabets, and digits. It cannot contain
spaces and underscores.
In the Notes field, enter the notes for the new backup. This is an optional field.
Click Save. The new backup is listed on the Backups page now.
The table on the Backups page displays the following details:
Date
Name
Size (in KB)
Notes
Actions
Under the Actions column, you can select the following actions for each backup:
Rollback to this backup: Select this action to perform a rollback to the selected backup. If the version of the selected backup is different from
the running Multi-Site version, the rollback could cause a removal of the features that are not present in the backup version. The system prompts
you to confirm:
Are you sure you want to Rollback to this backup?
If you click Yes, the system terminates the current session and the user is logged out.
Download: When you select the download action, the backup file in .tar.gz format is downloaded on your system. Unzip the file on your
system to view its contents.
Delete: When you select the delete action, a confirmation window is displayed asking you to confirm whether you want to delete the
selected backup. For example, the message is displayed as:
Are you sure you want to delete backup test_20171127231350?
If you click Yes, the system deletes the selected backup and it is no longer displayed in the table on the Backups page.
Using NFS or Local Disks to View the Backup
Cisco ACI Multi-Site is deployed as a 3-node cluster. The backups are stored in the /opt/cisco/msc/backups/ directory.
When you deploy a 3-node cluster out of the box (NFS is not mounted on the nodes), the backup is available on the local disk.
The backups can be available on any one node out of the 3 nodes and you can view it using the GUI. You can use NFS or the
local disk to view the backup.
Using NFS to View the Backup: NFS is used to create and store the backups. If you need to use NFS, you should mount it to the destination directory of
/opt/cisco/msc/backups/ on all three nodes. After NFS is mounted on all three nodes, run the docker service update msc_backupservice -force command on any one node.
Using Local Disk to View the Backup: If you have a mounted NFS and you want to use the local disk, you have to unmount NFS on all 3 nodes and run the docker service update msc_backupservice -force command on any one node.
The docker service update msc_backupservice -force command should be run only once after using the mount or unmount command. The mounted or unmounted file system is visible
only after running the docker service update msc_backupservice -force command.
Creating Audit Logs
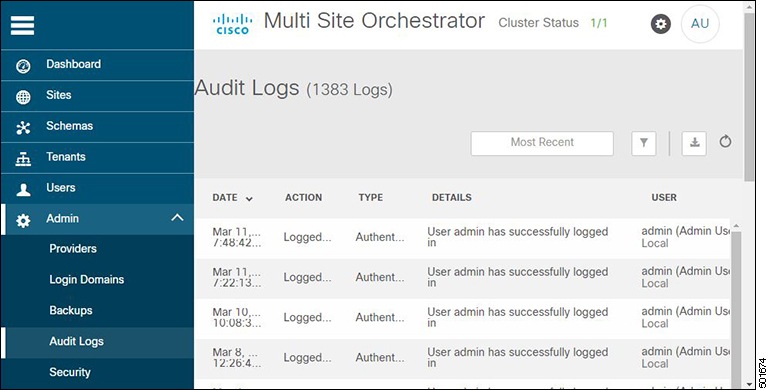
Click the Audit Logs page to display the details on the logs and records. The following screen shows the Audit Logs tab display:
The table on the Audit Logs page displays the following details:
Date
Action
Type
Details
User
Click the Most Recent tab to select the audit logs during a particular time period. For example, when you select the range from November 14, 2017
to November 17, 2017 and click Apply, the audit log details for this time period are displayed on the Audit Logs page.
Click the Filter icon next to the Most Recent tab to filter the log details using the following criteria:
User: Select this option to filter the audit logs by the user type. Click Apply.
Type: Select this option to filter the audit logs by the policy types, for example, site, user, template, application profile,
bridge domain, EPG, external EPG, filter, VRF, BGP config, contract, OSPF policy, pod, node, port, domain, provider, RADIUS,
TACACS+ and click Apply .
Action: Select this option to filter the audit logs by an action. The available actions are Created, Updated, Deleted, Added,
Removed, Associated, Disassociated, Deployed, Undeployed, Downloaded, Uploaded, Restored, Logged in, Logged Out, Login Failed.
Select an action and click Apply to filter the log details according to the action.
Click the Download icon next to the filter icon to download the audit logs onto your system. You can download the audit logs in CSV or JSON
format.

 Feedback