Overview
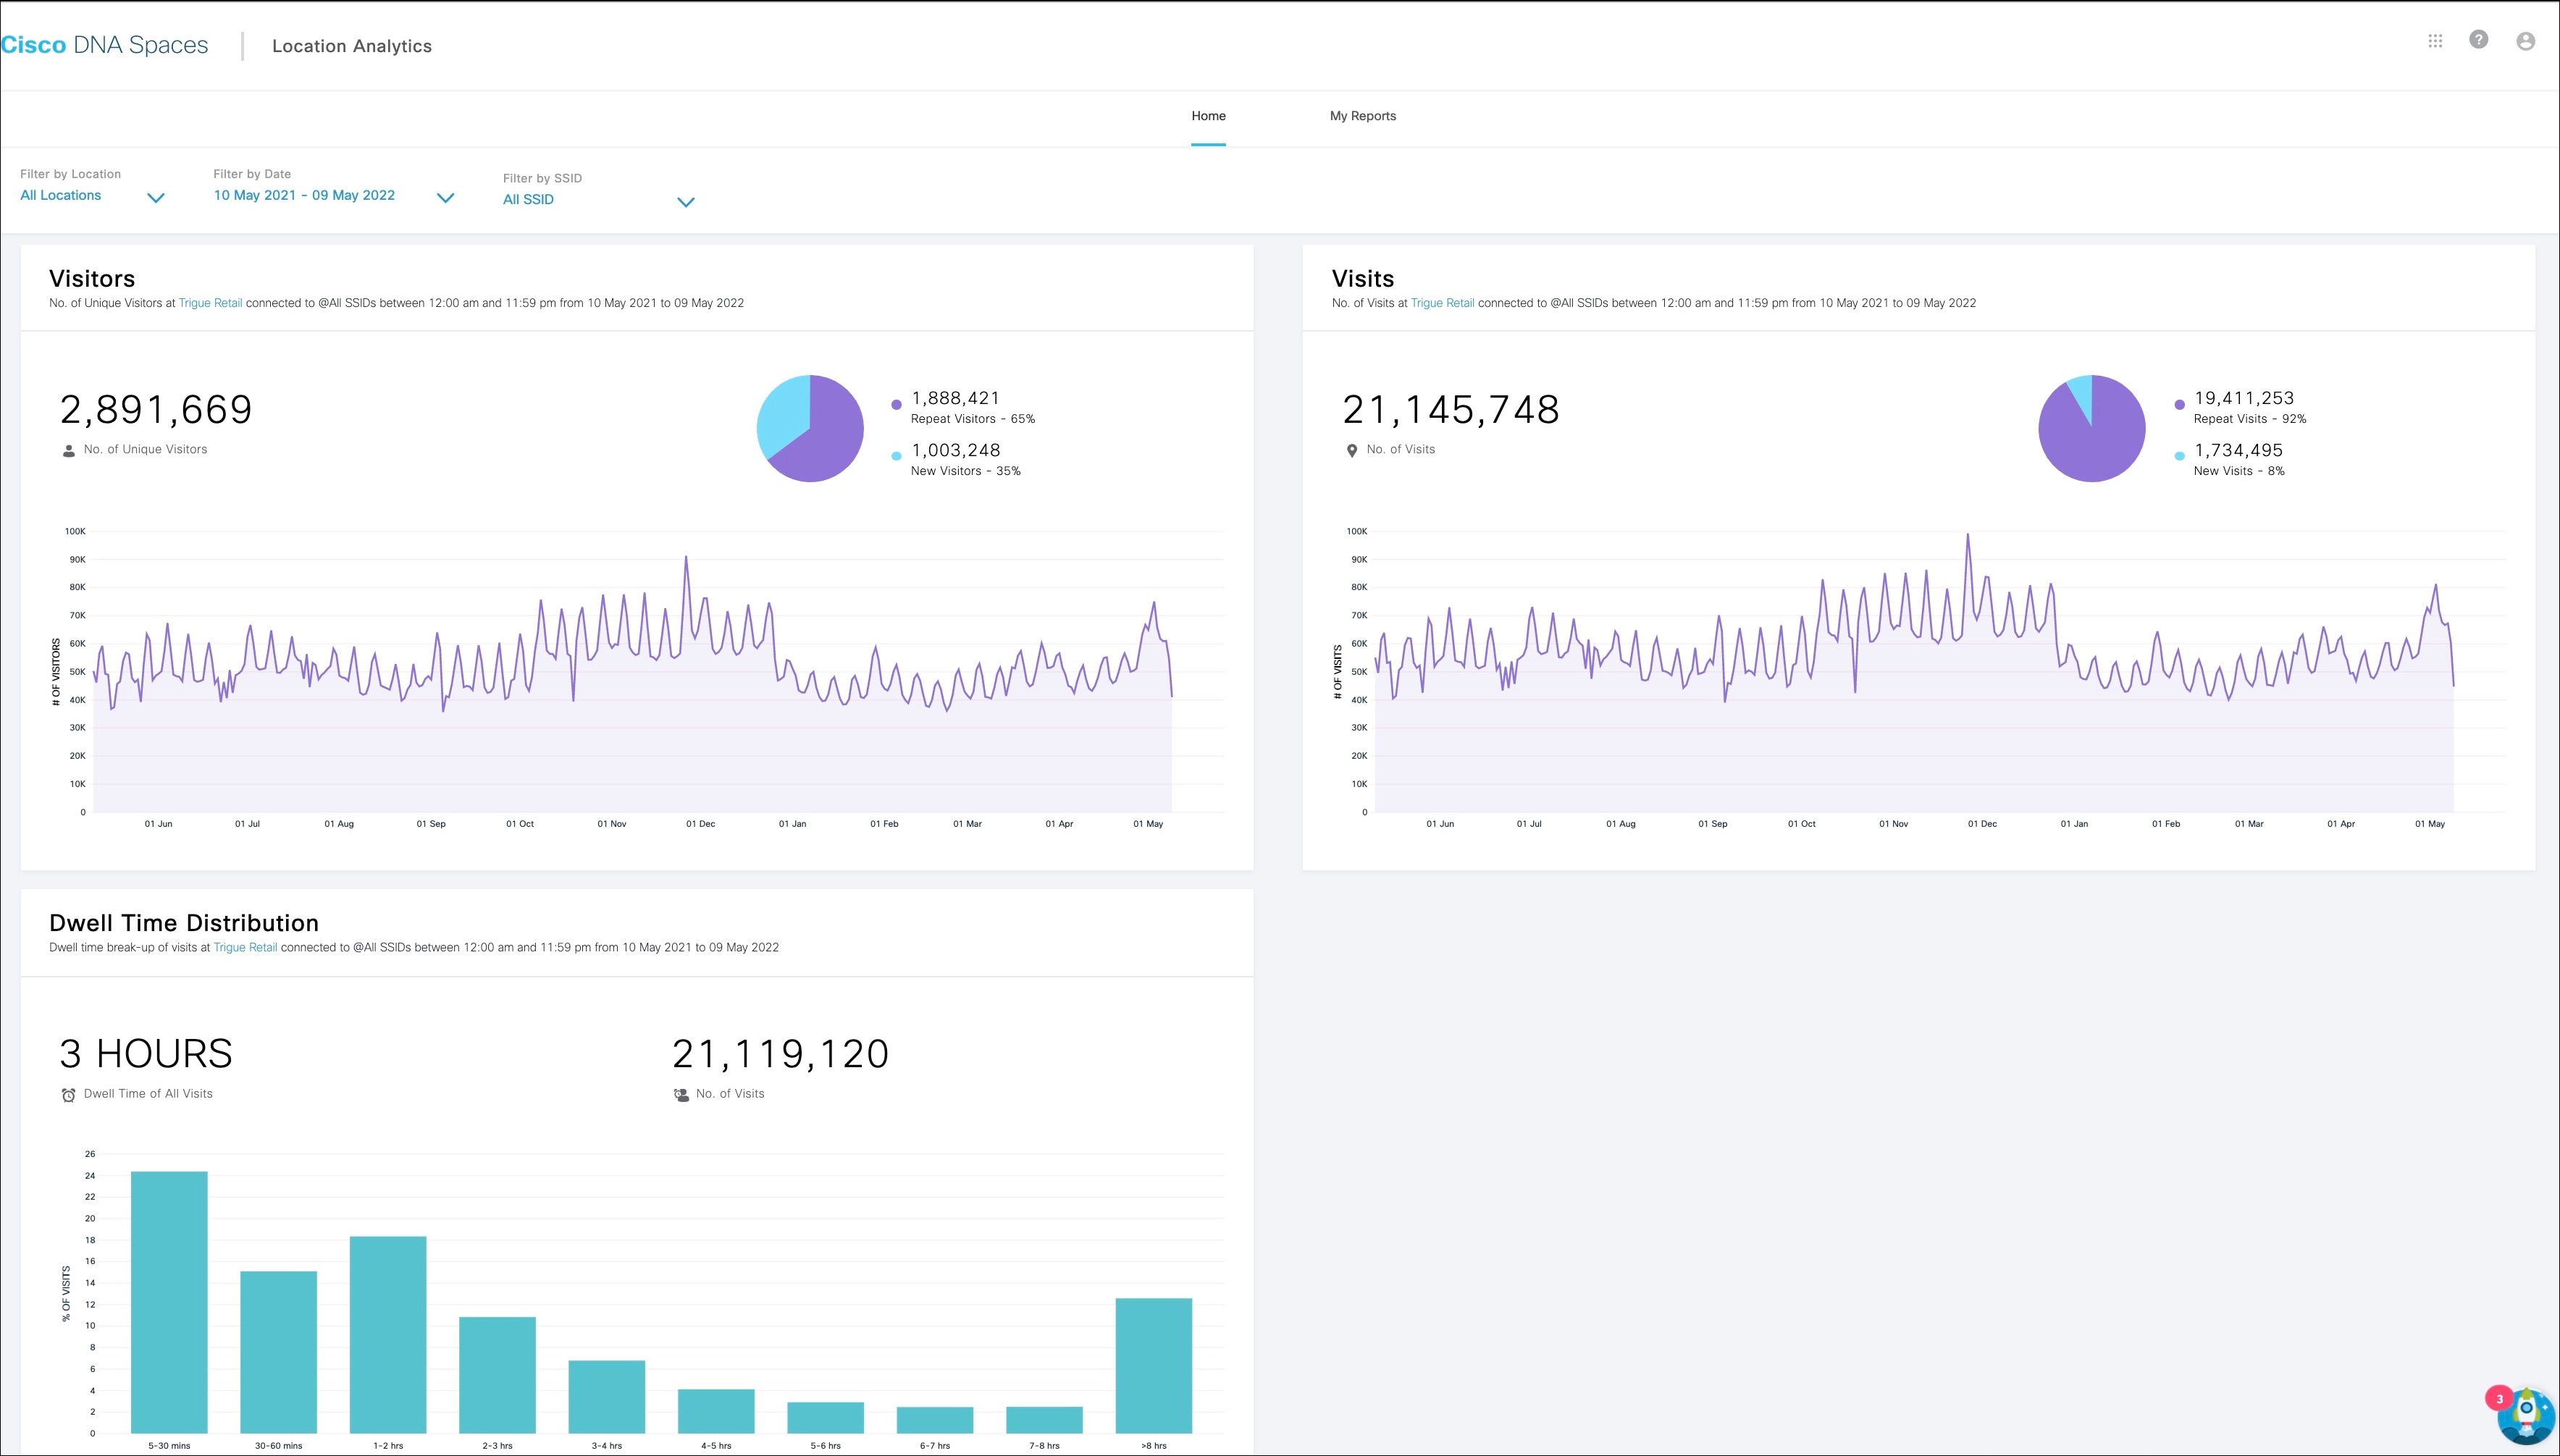
The Location Analytics app enables you to view reports of visits in your locations.The visits of your employees are also counted in the report.
Location Analytics shows the hierarchy path of the filtered location. The filtered location path is displayed in the widgets available in the home page and the Custom Reports section except for the Path widget.

 Feedback