Keep users happy and business running smoothly with software and hardware that work best together. Automation, analytics, and security work hard for you, so you don't have to.
Simplify onboarding and provisioning
Use automated workflows to quickly configure and provision new devices on the network according to your network policies.
Control access with ease
Use artificial intelligence and machine learning (AI/ML) to identify and classify endpoints, implement security policies, and display the most critical alerts for action.
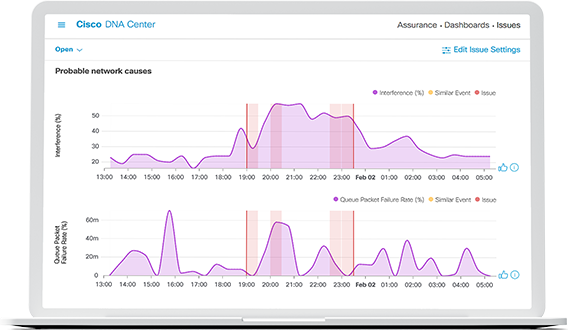
Maintain network health
Use telemetry data and simple management tools to show client, network, and application health insights.
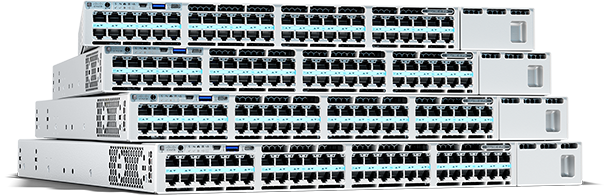
Scale your network to match demand
Simplify scalability with flexible router-port configuration to meet demand dynamically. And with Cisco Smart Licensing, it's easy to activate ports when and where you need them.
Join Cisco Catalyst and Meraki experts for a real-time demonstration of cloud monitoring with Cisco Catalyst switches and cloud management with Cisco Catalyst Wi-Fi 6E access points.