IP SLA—Service Performance Testing

This module describes how to configure the ITU-T Y.1564 Ethernet service performance test methodology that measures the ability of a network device to enable movement of traffic at the configured data rate.

Finding Feature Information

Your software release may not support all the features documented in this module. For the latest caveats and feature information, see Bug Search Tool and the release notes for your platform and software release. To find information about the features documented in this module, and to see a list of the releases in which each feature is supported, see the feature information table.

Use Cisco Feature Navigator to find information about platform support and Cisco software image support. To access Cisco Feature Navigator, go to https://cfnng.cisco.com/. An account on Cisco.com is not required.

Information About Service Performance Operations

Y.1564 is an Ethernet service activation test methodology. It is the standard for turning up, installing, and troubleshooting Ethernet and IP-based services. Y.1564 is the only standard test methodology that allows a complete validation of Ethernet service-level agreements (SLAs) in a single test.

Service performance testing is designed to measure the ability of a Device Under Test (DUT) or a network under test to forward traffic in different states.

Effective with Cisco IOS XE Everest Release 16.5.1, 10 Gigabit (10G) SAT External session is supported. Any SAT session with a rate-step greater than or equal to 1 Gbps is considered as 10G SAT session.

Effective with Cisco IOS XE Everest Release 16.12.1, 10 Gigabit (10G) SAT Internal session is supported. Any SAT session with a rate-step greater than or equal to 1 Gbps is considered as 10G SAT session.

Cisco implementation of ITU-T Y.1564 has three key objectives:

  • To serve as a network SLA validation tool, ensuring that a service meets its guaranteed performance settings in a controlled test time.

  • To ensure that all services carried by the network, meet their SLA objectives at their maximum committed rate. Thus, proving that under maximum load, network devices, and paths can support all traffic.

  • To perform medium-term and long-term service testing, confirming that network elements can properly carry all services while under stress during a soaking period.

The following Key Performance Indicators (KPI) metrics indicate the configured SLAs for the service or stream. These following service acceptance criteria metrics are:

  • Information Rate (IR) or throughput—Measures the maximum rate at which none of the offered frames are dropped by the device under test (DUT). This measurement translates into the available bandwidth of the Ethernet virtual connection (EVC).

  • Frame Transfer Delay (FTD) or latency—Measures the round-trip time (RTT) taken by a test frame to travel through a network device, or across the network and back to the test port.


    Note

    If the delay is more than 4.2 sec, then the software is not capable of capturing it in SADT statistics.
  • Frame Loss Ratio (FLR)—Measures the number of packets lost from the total number of packets sent. Frame loss can be due to a number of issues such as network congestion or errors during transmissions.

  • Frame Delay Variation (FDV) or jitter—Measures the variations in the time delays between packet deliveries.

Table 1. Supported Key Performance Indicators Matrix

KPI

FPGA- Based SADT

Internal Direction

External Direction

Delay

Y

Y

Jitter

Y

Y

Loss

Y

Y

Throughput

Y

Y

Because they interconnect segments, forwarding devices (switches and routers) and network interface units are the basis of any network. Incorrect configuration of a service on any of these devices within the end-to-end path, can affect the network performance. This could also lead to potential service outages and network-wide issues such as congestion and link failures. Service performance testing is designed to measure the ability of DUT or network under test, to forward traffic in different states. The Cisco implementation of ITU-T Y.1564 includes the following service performance tests:

  • Minimum data rate to CIR—Generates bandwidth from the minimum data rate to the committed information rate (CIR) for the test stream. Measures KPI for Y.1564 to meet configured service acceptance criteria (SAC).

  • CIR to EIR—Ramps up bandwidth from the CIR to the excess information rate (EIR) for the test stream. Measures the transfer rate to ensure that CIR meets the minimum bandwidth of the maximum EIR. Other KPI is not measured.


    Note

    In SADT configuration, if the rate of EIR is greater than CIR + EIR, then above EIR is not measured. The stats for Above EIR remains 0 in following command: show ip sla statistics

Service performance supports four operational modes:

  • Two-way statistics collection

  • One-way statistics collection

  • Passive measurement mode

  • Traffic generator mode

Statistics are calculated, collected, and reported to the IP SLAs module. The statistics database stores historical statistics pertaining to the operations that are executed.

  • One-way statistics collection—Both the passive measurement mode and the traffic generator mode are used along with each other. One device sends traffic as the generator and another device receives traffic in the passive mode and records the statistics. The passive mode is distinct from the two-way mode, where the remote device records the statistics instead of looping back the traffic. The sending device records only the transmit statistics.

  • Two-way statistics collection—The sender collects all the measurements. The remote target must be in the loopback mode for the two-way statistics to work. Loopback mode enables the traffic from the sender to reach the target and sent back to the sender.

  • Passive measurement mode—This mode is enabled by excluding a configured traffic profile. A passive measurement operation does not generate live traffic. The operation collects only statistics for the target configured for the operation.

  • Traffic generator mode—This mode records statistics for the number of packets and bytes transmitted.
Information About Configuring Y.1564 to Generate and Measure Ethernet Traffic

Y.1564 is an ethernet service activation or performance test methodology for turning up, installing, and troubleshooting ethernet and IP based services. This test methodology allows for complete validation of ethernet service-level agreements (SLAs) in a single test. Using the traffic generator performance profile, you can create the traffic based on your requirements. Network performance indicators like throughput, loss, and availability are analyzed using layer 2 traffic with various bandwidth profiles. Availability is inversely proportional to frame loss ratio.

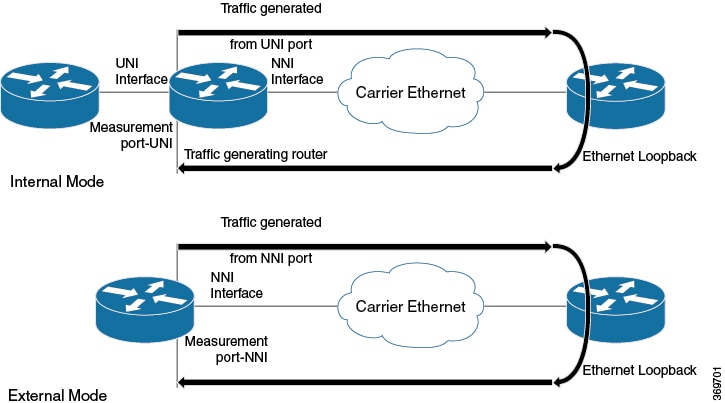
The figure below shows the Traffic Generator topology describing the traffic flow in the external and internal modes. The traffic is generated at the wire-side of Network-to-Network Interface (NNI) and is transmitted to the responder through the same interface for the external mode. The traffic is generated at the User-to-Network Interface (UNI) and transmitted to the responder through NNI respectively for the internal mode. The external mode is used to measure the throughput and loss at the NNI port whereas internal mode is used to measure the throughput and loss at the UNI port. During traffic generation, traffic at other ports is not affected by the generated traffic and can continue to switch network traffic.

Effective from the Cisco IOS XE 16.12.x release, 10G SAT External is supported on the Cisco Router.

Figure 1. Traffic Generator Topology

The following table provides details of the different service types and traffic directions supported for each service type.

Table 2. Service Types and Their Corresponding Traffic Direction for IP Target SLA
Service Type Traffic Direction for IP Target SLA
Service Instance Internal
Interface (Physical) Internal
Bridge Domain Internal
VRF Internal
Table 3. Service Types and Their Corresponding Traffic Direction for Ethernet Target SLA
Service Type Traffic Direction for Ethernet Target SLA
Service Instance Internal and External
Bridge Domain Internal

Prerequisites for IP SLA - Service Performance Testing

Ensure that the direction configured for the measurement-type direction {internal | external} and the profile traffic direction {internal | external} commands is the same.

Scale and Limitations for Configuring IP SLA - Service Performance Operation

The following table lists the Y.1564 two-way throughput measurement.

Table 4. Y.1564 Throughput Measurement for Each Packet Size

Packet Size (Bytes)

Max Rate (kbps)

64

650000

128

820000

256

860000

512

860000

1024

880000

1280

900000

1518

970000

9216

980000


Note

Higher order 1-GigabitEthernet ports and 10-GigabitEthernet port could have few packet loss in 9216 packet size. The above measurements are taken with external mode. Measured throughput value could be higher than configured rate upto 2%.


Traffic Generator

  • Supports eight simultaneous transmit sessions on device with a maximum rate of 1 Gbps .

  • Supports color-blind traffic generation.

  • SAT traffic is always generated in a burst.

    Default q-limit values are not adequate to handle the burst and thus leading to packet drops. You need to use the platform qos-qlimit-disable command to disable q-limit on the router and this would enable dynamic sharing of resources on all ports.

    The platform qos-qlimit-disable command disables the QoS q-limit functionality and enables the functionality again once the platform qos-qlimit-disable command is removed.

Measurement

The default ether-type to configure SAT endpoint is 0x8904. The measurement can only match packets with ether-type of 0x8904.

NCS 520 traffic generation happens with ether-type of 0x8904 by default. The measurement works if the traffic generator is also NCS 520 or its two-way statistics. The measurement cannot be used if there are devices other than NCS 520 on the other side as the traffic generator. Ether-types IPv4 and IPv6 are user configurable option (ether-type) supported. With the configuration set, you can perform measurement of packets from other devices with ether-type as IPv4 or IPv6.

SAT on NCS520 is supported only for Ethernet mode.

Loopback

NCS 520 does not support ethernet loopback or latching loopback.

NCS 520 supports loopback on SAT, and IP SLA configuration itself is used.

Use the loopback direction for the session along with packet profile. Source MAC address and destination MAC address are not same for loopback session. If an IP SLA session is configured as loopback mode, then the session should not have measurement or traffic profile parameters, otherwise the configuration fails.

Loopback sessions does not support statistics.

Restrictions for IP SLA - Service Performance Operation

  • Layer 3 fields such as IP, DSCP, and Layer 4 ports are not supported as packet parameter.

  • Measurement is supported only for throughput and loss. Delay and jitter measurement are not supported.

  • Service types are supported only for EFPs and not for bridge-domain and Layer 3 interfaces.

  • Maximum number of sessions supported is 8 and these 8 sessions can run simultaneously.

  • Color aware statistics is not supported.

  • Port-channel testing is not supported.

  • When a configuration performed on EFP or interface is shutdown, the packets do not egress out of any interface on the device, and after unshut, the traffic does not resume to egress direction. You need to restart the configuration manually.

  • On test EFP or BD removal on the test interface, traffic does not egress out of any of the interfaces in the device, and traffic flow resumes only after reconfiguring. After which, the test is rescheduled.

  • Each session should have an unique encapsulation, and if sessions have same encapsulations or match keys might impact the statistics.

  • Packets that use SAT internal MAC (0xf244493930ec) as destination MAC addresss and internal VLAN (0xdd4) have problem with forwarding.

  • Loopback or measurement with packet size of 1518 at ingress direction does not work. This is due to the extra headers being added at ingress direction. To overcome this, MTU size of the interface has to be increased.

  • Span on the SAT configured interface is not supported.

    Rx statistics work only after 10 seconds and you need to use the platform qos-qlimit-disable command to disable the q-limit on the router before starting the SLA session.

  • SLA measurement in 10-Gigabit Ethernet port is supported with maximum rate of 1-Gigabit Ethernet. Higher the order of 1-Gigabit Ethernet ports, 10-Gigabit Ethernet ports have few packets loss for higher packet size.

  • Interface statistics and SLA statistics might not match in higher order ports.

  • The following table shows the supported egress and ingress QOS on the sender side core interface for Ethernet and IP target SLA.

    Table 5. IP SLA and Type of QOS supported

    Type

    Policy-map at interface (Ingress)

    Policy-map at interface (Egress)

    Policy-map at EFP (Ingress)

    Policy-map at EFP (Egress)

    Internal Mode 2-way measurement

    Yes

    Yes

    Yes

    Yes

    Internal Receive Mode

    No

    Yes

    No

    Yes

    Internal Loopback Target Interface

    Yes

    Yes

    Yes

    Yes

    External Mode 2-way measurement

    No

    No

    No

    No

    External Receive Mode

    Yes

    No

    Yes

    No

    External Loopback Target Interface

    Yes

    No

    Yes

    No


    Note

    Ingress classification does not work for match on VLAN for SADT traffic.
  • The following table shows how Ethernet Target SLA with multicast or broadcast source MAC address is supported on different operational modes.

    Table 6. Multicast or Broadcast MAC support criteria for SLA

    Source or destination MAC address

    Operational mode

    Support for Ethernet Target SLA

    Multicast or broadcast source MAC address

    Traffic generator mode

    Not supported

    Passive measurement mode

    Two-way statistics collection mode

    Multicast or broadcast destination MAC address

    Traffic generator mode

    SLA generates the traffic

    Passive measurement mode

    SLA receives the traffic

    Two-way statistics collection mode

    Not supported

Generating Traffic Using Y.1564

Follow these steps to generate traffic using Y.1564:

SUMMARY STEPS

  1. Configure Ethernet Virtual Circuits (EVC).
  2. Configure Traffic Generator on the transmitter.
  3. Configure Ethernet Loopback at the remote end.
  4. Start the IP SLA session:

DETAILED STEPS

  Command or Action Purpose
Step 1

Configure Ethernet Virtual Circuits (EVC).

EVC is configured on the interface path such that the layer 2 path between the transmitter and the receiver is complete. For more information, see the "Configuring Ethernet Virtual Connections (EVCs)" section in the Carrier Ethernet Configuration Guide, Cisco IOS XE Release .
Step 2

Configure Traffic Generator on the transmitter.

Example:

The following is a sample configuration of the traffic generator.
Device(config)# ip sla 100
Device(config-ip-sla)# service-performance type ethernet dest-mac-addr 0001.0002.0003 interface TenGigabitEthernet0/0/4 service instance 100
Device(config-ip-sla-service-performance)# aggregation interval buckets 2
Device(config-ip-sla-service-performance)# frequency iteration 2 delay 10
Device(config-ip-sla-service-performance)# profile packet
Device(config-sla-service-performance-packet)# packet-size 256
Device(config-sla-service-performance-packet)# outer-vlan 100
Device(config-sla-service-performance-packet)# profile traffic direction external
Device(config-sla-service-performance-traffic)# rate-step kbps 1000
Device(config-ip-sla-service-performance)# end
Device #
Step 3

Configure Ethernet Loopback at the remote end.

For information on Ethernet Loopback, see "Understanding Ethernet Loopback" section in the Layer 2 Configuration Guide, Cisco IOS XE Release .

Step 4

Start the IP SLA session:

Example:

Router(config)# ip sla schedule [sla_id] start-time [hh:mm | hh:mm:ss | now | pending | random]
Note 
Due to packet overhead (64-byte packets), a total of only 469 Mbit/sec of traffic is supported at a time. This bandwidth is shared by all active sessions. This is applicable only for Cisco RSP2 module. For more information, see Table 4.

How to Configure IP SLA - Service Performance Testing

Table 7. Feature History

Feature Name

Release Information

Feature Description

Y.1564 support on dot1ad

Cisco IOS XE Cupertino 17.8.1

This feature enables Y.1564 Ethernet service activation test methodology support on interfaces that are configured with 802.1ad encapsulation. It allows you to perform medium-term and long-term service testing, confirming that the interfaces that are configured with 802.1ad can properly carry all services while under stress during a soaking period.

The following commands are introduced:

- inner-eth-type

- outer-eth-type

Configuring Ethernet Target Two-Way Color Blind Session

Perform the following steps to configure ethernet target color blind traffic generation.

SUMMARY STEPS

  1. enable
  2. configure terminal
  3. ip sla sla_id
  4. service-performance type ethernet dest-mac-addr dest-mac { service instance | bridge}
  5. aggregation | default | description | duration | exit | frequency | no | profile
  6. measurement-type direction {internal | external}
  7. default | exit | loss | no | throughput | receive | delay | jitter
  8. exit
  9. profile packet
  10. default | exit | inner-cos | inner-vlan | no | outer-cos | outer-vlan | packet-size | src-mac-addr | outer-eth-type | inner-eth-type
  11. exit
  12. profile traffic direction{external | internal}
  13. default or exit or no or rate step kbps | pps
  14. exit

DETAILED STEPS

  Command or Action Purpose
Step 1

enable

Example:

Device> enable

Enables privileged EXEC mode.

  • Enter your password if prompted.

Step 2

configure terminal

Example:

Device# configure terminal

Enters global configuration mode.

Step 3

ip sla sla_id

Example:

Device(config)# ip sla 100

Specifies the SLA ID to start the IP SLA session.

Step 4

service-performance type ethernet dest-mac-addr dest-mac { service instance | bridge}

Example:

Device(config-ip-sla))#service-performance type ethernet dest-mac-addr 0001.0001.0001 interface gigabitEthernet0/10 service instance 10

Specifies the service performance type as Ethernet and the destination MAC address in H.H.H format.

Specifies the target for the SLA session. The options are:

  • service instance

  • bridge

Only service instance is supported as target-type on 10G SAT.

Step 5

aggregation | default | description | duration | exit | frequency | no | profile

Example:

Device(config-ip-sla-service-performance)# duration time 60

Specifies the type of service performance. The options are:

  • aggregation - Represents the statistics aggregation.

  • default - Sets a command to its defaults.

  • description - Describes the operation.

  • duration - Sets the service performance duration configuration.

  • frequency - Represents the scheduled frequency. The options available are iteration and time. The range in seconds is from 20 to 65535.

  • profile - Specifies the service performance profile. If you use the packet or traffic options, go to Step 9 or Step 12, respectively.

Step 6

measurement-type direction {internal | external}

Example:

Device(config-ip-sla-service-performance)# measurement-type direction

Specifies the statistics to measure traffic. The options available are external or internal; the default option is internal.

Only external measurement-type direction is supported for 10G.

Step 7

default | exit | loss | no | throughput | receive | delay | jitter

Example:

Device(config-ip-sla-service-performance-measurement)# throughput

Specifies the measurement type based on the service performance is calculated. The options are:

  • default - Sets a command to its defaults.

  • loss - Specifies the measurement, such as frame loss.

  • throughput - Specifies the measurement such as average rate of successful frame delivery.

  • receive - Specifies the passive measurement mode.

  • delay - Specifies the measurement that is frame delay (FTD). This is not supported on 10G.

  • jitter - Specifies the measurement that is frame delay variation (FDV). This is not supported on 10G.

Step 8

exit

Exits the measurement mode.

Step 9

profile packet

Example:

Device(config-ip-sla-service-performance)#profile packet

Specifies the packet profile. A packet profile defines the packets to be generated.

Step 10

default | exit | inner-cos | inner-vlan | no | outer-cos | outer-vlan | packet-size | src-mac-addr | outer-eth-type | inner-eth-type

Example:

Device(config-ip-sla-service-performance-packet)#src-mac-addr 4055.3989.7b56

Specifies the packet type. The options are:

  • default - Sets a command to its defaults.

  • inner-cos - Specifies the class of service (CoS) value for the inner VLAN tag of the interface from which the message will be sent.

  • inner-vlan - Specifies the VLAN ID for the inner vlan tag of the interface from which the message will be sent.

  • outer-cos - Specifies the CoS value that will be populated in the outer VLAN tag of the packet.

  • outer-vlan - Specifies the VLAN ID that will be populated in the outer VLAN tag of the packet.

  • packet-size - Specifies the packet size; the default size is 64 bytes. The supported packet sizes are 64 bytes,128 bytes, 256 bytes, 512 bytes, 1024 bytes, 1280 bytes, 1518 bytes, 9216 bytes, and IMIX.

  • src-mac-addr - Specifies the source MAC address in H.H.H format.

  • outer-eth-type - Specifies the encapsulation type for the outer VLAN tag of the packet as dot1ad or dot1q.

  • inner-eth-type - Specifies the encapsulation type for the inner VLAN tag of the interface from which the message is sent as dot1ad or dot1q.

Note 
Ensure that the value of the configured packet profile matches the target configuration of the session.
Note 

If you do not specify the encapsulation type in the packet profile, dot1q is used by default.

Step 11

exit

Example:

Device(config-ip-sla-service-performance-packet)# exit

Exits the packet mode.

Step 12

profile traffic direction{external | internal}

Example:

Device(config-ip-sla-service-performance)#profile traffic direction external 

Specifies the direction of the profile traffic. The options are external and internal.

Only external profile traffic direction is supported for 10G.

Note 
This command is required to configure the rate step kbps command.
Step 13

default or exit or no or rate step kbps | pps

Example:

Device(config-ip-sla-service-performance-traffic)#rate-step kbps 1000 

Specifies the traffic type. The options are:

  • default - Sets a command to its defaults.

  • rate step kbps - Specifies the transmission rate in kbps. The rate-step range is from 1-10000000 (1 Kbps to 10 Gbps).

  • rate step pps - Specifies the transmission rate in pps. The rate-step range is from 1-1000000 (1 to 1000000 pps).

    Note 
    The command rate-step kbps | pps number is mandatory for traffic generation.
Step 14

exit

Exits the traffic mode.

Configuration Examples for Configuring Y.1564 to Generate and Measure Ethernet Traffic

This section shows sample configurations for traffic generation.

Example: Traffic Generation — Target Service Instance

This section shows sample configuration for traffic generation – target service instance.
ip sla 100
service-performance type ethernet dest-mac-addr 0001.0002.0003 interface TenGigabitEthernet0/0/4 service instance 100
profile packet
packet-size 256
outer-vlan 100
profile traffic direction internal
rate-step kbps 1000
aggregation interval buckets 2
frequency iteration 2 delay 10
end

Example: Two-Way Session—Target Service Instance

The following is a sample configuration for a two-way measurement session of service instance internal target type.
ip sla 100
service-performance type ethernet dest-mac-addr 0001.0002.0003 interface TenGigabitEthernet0/0/2 service instance 100
measurement-type direction internal
loss 
throughput

delay
jitter 
profile packet 
packet-size 64
outer-vlan 100
inner-vlan 200
profile traffic direction internal
rate-step kbps 1000
aggregation interval buckets 2
frequency iteration 2 delay 10
end

Example: Passive Measurement Mode — Target Service Instance

The following is a sample configuration for passive measurement session for target service instance.
ip sla 100
service-performance type ethernet dest-mac-addr 0001.0002.0003 interface TenGigabitEthernet0/0/4 service instance 100
measurement-type direction internal
loss
throughput
aggregation interval buckets 2
frequency iteration 2 delay 10
end

Example: Two-Way Session

The following is a sample configuration for a two-way session.
show ip sla statistics 12345

IPSLAs Latest Operation Statistics

IPSLA operation id: 12345
Type of operation: Ethernet Service Performance
Test mode: Two-way Measurement
Steps Tested (kbps): 10000 20000 25000
Test duration: 20 seconds

Latest measurement:  *15:54:44.007 IST Mon May 18 2015
Latest return code:  Oper End of Life

Overall Throughput: 24850 kbps

Step 1 (10000 kbps):
Stats:
IR(kbps) FL   FLR      Avail              FTD Min/Avg/Max      FDV Min/Avg/Max
9944      0     0.00%  100.00%  41.44us/46.06us/77.68us  0ns/12.08us/34.52us
Tx Packets: 16377 Tx Bytes: 24860286
Rx Packets: 16377 Rx Bytes: 24860286
Step Duration: 20 seconds

Additional References for IP SLA - Service Performance Testing

Related Documents

Related Topic

Document Title

Cisco IOS commands

Cisco IOS Master Command List, All Releases

Cisco IOS IP SLAs commands

Cisco IOS IP SLAs Command Reference

Standards and RFCs

Standard/RFC

Title

ITU-T Y.1564

Ethernet service activation test methodology

Technical Assistance

Description

Link

The Cisco Support and Documentation website provides online resources to download documentation, software, and tools. Use these resources to install and configure the software and to troubleshoot and resolve technical issues with Cisco products and technologies. Access to most tools on the Cisco Support and Documentation website requires a Cisco.com user ID and password.

http://www.cisco.com/cisco/web/support/index.html