- Preface
- Cisco ONS Documentation Roadmap for Release 9.2.1
- Chapter 1, Shelf and Backplane Hardware
- Chapter 2, Card Reference
- Chapter 3, Card Protection
- Chapter 4, Cisco Transport Controller Operation
- Chapter 5, Security
- Chapter 6, Timing
- Chapter 7, Circuits and Tunnels
- Chapter 8, SDH Topologies and Upgrades
- Chapter 9, Management Network Connectivity
- Chapter 10, Ethernet Operation
- Chapter 11, Alarm Monitoring and Management
- Chapter 12, Performance Monitoring
- Chapter 13, SNMP
- Appendix A, Hardware Specifications
- Appendix B, Administrative and Service States
- Appendix C, Network Element Defaults
Cisco ONS 15600 SDH Reference Manual, Releases 9.1 and 9.2.1
Bias-Free Language
The documentation set for this product strives to use bias-free language. For the purposes of this documentation set, bias-free is defined as language that does not imply discrimination based on age, disability, gender, racial identity, ethnic identity, sexual orientation, socioeconomic status, and intersectionality. Exceptions may be present in the documentation due to language that is hardcoded in the user interfaces of the product software, language used based on RFP documentation, or language that is used by a referenced third-party product. Learn more about how Cisco is using Inclusive Language.
- Updated:
- December 21, 2010
Chapter: Chapter 12, Performance Monitoring
Performance Monitoring

Note ![]() The terms "Unidirectional Path Switched Ring" and "UPSR" may appear in Cisco literature. These terms do not refer to using Cisco ONS 15xxx products in a unidirectional path switched ring configuration. Rather, these terms, as well as "Path Protected Mesh Network" and "PPMN," refer generally to Cisco's path protection feature, which may be used in any topological network configuration. Cisco does not recommend using its path protection feature in any particular topological network configuration.
The terms "Unidirectional Path Switched Ring" and "UPSR" may appear in Cisco literature. These terms do not refer to using Cisco ONS 15xxx products in a unidirectional path switched ring configuration. Rather, these terms, as well as "Path Protected Mesh Network" and "PPMN," refer generally to Cisco's path protection feature, which may be used in any topological network configuration. Cisco does not recommend using its path protection feature in any particular topological network configuration.
This chapter defines PM parameters and concepts for Cisco ONS 15600 SDH optical cards. You can use performance monitoring (PM) parameters to gather, store, threshold, and report performance data for early detection of problems.
Note ![]() For additional information regarding PM parameters, refer to ITU-T G.826, G.827, G.828, G.829, M2101, and M2102, or Telcordia documents GR-1230-CORE, GR-820-CORE, GR-499-CORE, and GR-253-CORE and the ANSI T1.231 document entitled Digital Hierarchy - Layer 1 In-Service Digital Transmission Performance Monitoring.
For additional information regarding PM parameters, refer to ITU-T G.826, G.827, G.828, G.829, M2101, and M2102, or Telcordia documents GR-1230-CORE, GR-820-CORE, GR-499-CORE, and GR-253-CORE and the ANSI T1.231 document entitled Digital Hierarchy - Layer 1 In-Service Digital Transmission Performance Monitoring.
For information about enabling and viewing PM values, refer to the Cisco ONS 15600 SDH Procedure Guide.
Chapter topics include:
•![]() Threshold Performance Monitoring
Threshold Performance Monitoring
•![]() Intermediate-Path Performance Monitoring
Intermediate-Path Performance Monitoring
•![]() Performance-Monitoring Parameter Definitions
Performance-Monitoring Parameter Definitions
•![]() Optical Card Performance Monitoring
Optical Card Performance Monitoring
•![]() ASAP Card Performance Monitoring
ASAP Card Performance Monitoring
12.1 Threshold Performance Monitoring
Thresholds are used to set error levels for each PM. You can program PM threshold ranges from the Provisioning > SDH Thresholds tabs on the Cisco Transport Controller (CTC) card view. To provision card thresholds, such as line, path, and SDH thresholds, refer to the Cisco ONS 15600 SDH Procedure Guide.
During the accumulation cycle, if the current value of a performance monitoring parameter reaches or exceeds its corresponding threshold value, a threshold crossing alert (TCA) is generated by the node and sent to CTC. TCAs provide early detection of performance degradation. When a threshold is crossed, the node continues to count the errors during a given accumulation period. If 0 is entered as the threshold value, the performance monitoring parameter is disabled.
Change the threshold if the default value does not satisfy your error monitoring needs. For example, customers with a critical VC3 installed for on-demand emergency calls must guarantee the best quality of service on the line; therefore, they lower all thresholds so that the slightest error raises a TCA.
12.2 Intermediate-Path Performance Monitoring
Intermediate-path performance monitoring (IPPM) allows a nonterminating node to transparently monitor a constituent channel of an incoming transmission signal. ONS 15600 SDH networks only use line terminating equipment (LTE), not path terminating equipment (PTE). The following cards are LTE equipment in the ONS 15600 SDH system:
•![]() OC48/STM16 SR/SH 16 Port 1310
OC48/STM16 SR/SH 16 Port 1310
•![]() OC48/STM16 LR/LH 16 Port 1550
OC48/STM16 LR/LH 16 Port 1550
•![]() OC192/STM64 SR/SH 4 Port 1310
OC192/STM64 SR/SH 4 Port 1310
•![]() OC192/STM64 LR/LH 4 Port 1550
OC192/STM64 LR/LH 4 Port 1550
•![]() OC192LR/STM64 4 Port ITU C-Band
OC192LR/STM64 4 Port ITU C-Band
IPPM enables LTE cards to monitor near-end path PM data on individual virtual containers (VC) payloads. After enabling IPPM on provisioned VC3 or VC4 ports, service providers can monitor large amounts of VC traffic through intermediate nodes, thus making troubleshooting and maintenance activities more efficient.
IPPM occurs only on VC4 paths that have IPPM enabled, and TCAs are raised only for PM parameters on the selected IPPM paths. The monitored IPPMs are VC4 HP-EB, VC4 HP-ES, VC4 HP-SES, VC4 HP-UAS, and VC4 HP-BBE. The following ratio parameters are provided: VC4 HP-BBER, VC4 HP-ESR, and VC4 HP-SESR. To enable IPPM, refer to the Cisco ONS 15600 SDH Procedure Guide.
The ONS 15600 SDH performs IPPM by examining the overhead in the monitored path and reading all of the near-end path performance monitoring parameters in the incoming transmission direction. The IPPM process allows the path overhead to pass bidirectionally through the node completely unaltered.
For detailed information about specific performance monitoring parameters, see the "Performance-Monitoring Parameter Definitions" section.
12.3 Pointer Justification Count
Pointers are used to compensate for frequency and phase variations. Pointer justification counts indicate timing differences on SDH networks. When a network is not synchronized, frequency and phase variations occur on the transported signal. Excessive frequency and phase variations can cause terminating equipment to slip. These variations also cause slips at the SDH and plesiosynchronous digital hierarchy (PDH) boundaries.
Slips cause different effects in service. Voice service has intermittent audible clicks. Compressed voice technology has short transmission errors or dropped calls. Fax machines lose scanned lines or experience dropped calls. Digital video transmission has distorted pictures or frozen frames. Encryption service loses the encryption key, which causes data to be transmitted again.
Pointers align the phase variations in VC4 and TU payloads. The VC4 payload pointer is located in the H1 and H2 bytes of the line overhead. Clocking differences are measured by the offset in bytes from the pointer to the first byte of the VC4 virtual container (VC) called the J1 byte. A small number of pointer justification counts per day is not cause for concern. If the pointer justification count continues to rise or becomes large, action must be taken to correct the problem.
You can enable positive pointer justification count (PPJC) and negative pointer justification count (NPJC) performance monitoring parameters for LTE cards.
PPJC is a count of path-detected (PPJC-Pdet) or path-generated (PPJC-Pgen) positive pointer justifications depending on the specific PM name. NPJC is a count of path-detected (NPJC-Pdet) or path-generated (NPJC-Pgen) negative pointer justifications depending on the specific PM name.
A consistent pointer justification count indicates clock synchronization problems between nodes. A difference between the counts means the node transmitting the original pointer justification has timing variations with the node detecting and transmitting this count. Positive pointer adjustments occur when the frame rate of the VC is too slow in relation to the rate of the VC4.
For pointer justification count definitions, see the "Performance-Monitoring Parameter Definitions" section. In CTC, the PM count fields for PPJC and NPJC appear white and blank unless IPPM is enabled.
12.4 Performance-Monitoring Parameter Definitions
Table 12-1 gives definitions for each type of performance-monitoring parameter found in this chapter.
12.5 Optical Card Performance Monitoring
The following sections define performance monitoring parameters for the OC-48/STM16, and OC-192/STM64 optical cards.
12.5.1 OC-48/STM16, and OC-192/STM64 Card Performance Monitoring Parameters
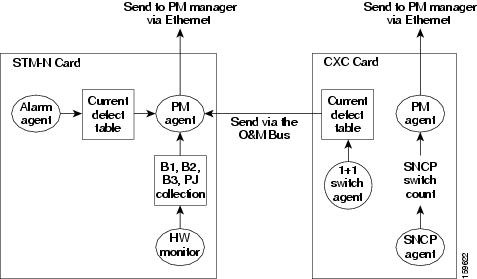
Figure 12-1 shows where overhead bytes detected on the Application-Specific Integrated Circuits (ASICs) produce performance monitoring parameters for the OC-48/STM16, and OC-192/STM64 optical cards.
Figure 12-1 PM Read Points on the OC-48/STM16, and OC-192/STM64 Cards
Note ![]() For PM locations relating to protection switch counts, see the Telcordia GR-1230-CORE document.
For PM locations relating to protection switch counts, see the Telcordia GR-1230-CORE document.
Table 12-2 lists the near-end and far-end section layer PMs.
|
|
|
|
|
|
|---|---|---|---|---|
RS-EB |
MS-EB |
MS-PSC |
HP-PPJC-Pdet |
HP-BBE |
1 SDH path performance monitoring parameters increment only if IPPM is enabled. For additional information, see the "Intermediate-Path Performance Monitoring" section. To monitor SDH path performance monitoring parameters, log into the far-end node directly. 2 For information about troubleshooting path protection configurations (path protection) switch counts, refer to the Cisco ONS 15600 SDH Reference Manual for information about creating circuits with protection switching. |
12.5.2 Physical Layer Parameters
The ONS 15600 SDH retrieves the OPR, OPT, and LBC from the line card and stores these values with the PM counts for the 15-minute and 1-day periods. You can retrieve current OPR, OPT, and LBC values for each port by displaying the card view in CTC and clicking the Maintenance > Transceiver tabs.
The physical layer performance parameters consist of normalized and non-normalized values of LBC, OPT, and OPR. Table 12-3 defines the non-normalized values.
|
|
|
|---|---|
Non-normalized LBC (mA)1 |
The actual operating value of laser bias current (mA) for the specified card port. |
Non-normalized OPR (dbm)2 |
The actual operating value of optical power received (dBm) for the specified card port. |
Non-normalized OPT (dbm)1 |
The actual operating value of optical power transmitted (dBm) for the specified card port. |
1 This value should be somewhat consistent from port to port and cannot be configured. 2 This value will vary from port to port because of received optical signal power differences. This value can be configured by calibrating the nominal value to the initial receive power level when the port is put in service. |
12.6 ASAP Card Performance Monitoring
The following sections define performance monitoring parameters for the Any Service Any Port (ASAP) card.
12.6.1 ASAP Card Optical Performance Monitoring Parameters
Table 12-4 lists the near-end and far-end section layer PMs.
|
|
|
|
|
|
|---|---|---|---|---|
RS-EB |
MS-EB |
MS-PSC |
HP-PPJC-Pdet |
HP-BBE |
1 SDH path performance monitoring parameters increment only if IPPM is enabled. For additional information, see the "Intermediate-Path Performance Monitoring" section. To monitor SDH path performance monitoring parameters, log into the far-end node directly. 2 In CTC, the count fields for HP-PPJC and HP-NPJC PM parameters appear white and blank unless they are enabled on the Provisioning > Line tab. See the "Pointer Justification Count" section. 3 SDH path PM parameters do not increment unless IPPM is enabled. See the "Intermediate-Path Performance Monitoring" section. |
12.6.2 ASAP Card Ethernet Performance Monitoring Parameters
CTC provides Ethernet performance information, including line-level parameters, port bandwidth consumption, and historical Ethernet statistics. The ASAP card Ethernet performance information is divided into Ether Ports and POS Ports windows within the card view Performance tab window.
12.6.2.1 ASAP Card Ether Port Statistics Window
The Ethernet Ether Ports statistics window lists Ethernet parameters at the line level. The Statistics window provides buttons to change the statistical values. The Baseline button resets the displayed statistics values to zero. The Refresh button manually refreshes statistics. Auto-Refresh sets a time interval at which automatic refresh occurs. The ASAP Statistics window also has a Clear button. The Clear button sets the values on the card to zero, but does not reset the ASAP card.
During each automatic cycle, whether auto-refreshed or manually refreshed (using the Refresh button), statistics are added cumulatively and are not immediately adjusted to equal total received packets until testing ends. To see the final PM count totals, allow a few moments for the PM window statistics to finish testing and update fully. PM counts are also listed in the ASAP card Performance > History window.
Table 12-5 defines the ASAP card statistics parameters.
12.6.2.2 ASAP Card Ether Ports Utilization Window
The Ether Ports Utilization window shows the percentage of Tx and Rx line bandwidth used by the Ethernet ports during consecutive time segments. The Utilization window provides an Interval menu that enables you to set time intervals of 1 minute, 15 minutes, 1 hour, and 1 day. Line utilization is calculated with the following formulas:
Rx = (inOctets + inPkts * 20) * 8 / 100% interval * maxBaseRate
Tx = (outOctets + outPkts * 20) * 8 / 100% interval * maxBaseRate
The interval is defined in seconds. The maxBaseRate is defined by raw bits per second in one direction for the Ethernet port (that is,1 Gbps). Table 12-6 provides the maxBaseRate for ASAP cards.
|
|
|
|---|---|
VC3 |
51840000 |
VC4 |
155000000 |
VC4-2c |
311000000 |
VC4-4c |
622000000 |
Note ![]() Line utilization numbers express the average of ingress and egress traffic as a percentage of capacity.
Line utilization numbers express the average of ingress and egress traffic as a percentage of capacity.
12.6.2.3 ASAP Card Ether Ports History Window
The Ethernet Ether Ports History window lists past Ethernet statistics for the previous time intervals. The History window displays the statistics for each port for the number of previous time intervals as shown in Table 12-7. The listed parameters are defined in Table 12-5.
12.6.2.4 ASAP Card POS Ports Statistics Parameters
The Ethernet POS Ports statistics window lists Ethernet POS parameters at the line level.
Table 12-8 defines the ASAP card Ethernet POS Ports parameters.
12.6.2.5 ASAP Card POS Ports Utilization Window
The POS Ports Utilization window shows the percentage of Tx and Rx line bandwidth used by the POS ports during consecutive time segments. The Utilization window provides an Interval menu that enables you to set time intervals of 1 minute, 15 minutes, 1 hour, and 1 day. Line utilization is calculated with the following formulas:
Rx = (inOctets * 8) / interval * maxBaseRate
Tx = (outOctets * 8) / interval * maxBaseRate
The interval is defined in seconds. The maxBaseRate is defined by raw bits per second in one direction for the Ethernet port (that is,1 Gbps). The maxBaseRate for ASAP cards is shown in Table 12-6.
Note ![]() Line utilization numbers express the average of ingress and egress traffic as a percentage of capacity.
Line utilization numbers express the average of ingress and egress traffic as a percentage of capacity.
12.6.2.6 ASAP Card POS Ports History Window
The Ethernet POS Ports History window lists past Ethernet POS Ports statistics for the previous time intervals. The History window displays the statistics for each port for the number of previous time intervals as shown in Table 12-7. The listed parameters are defined in Table 12-8.
 Feedback