Deviation Report Parameters
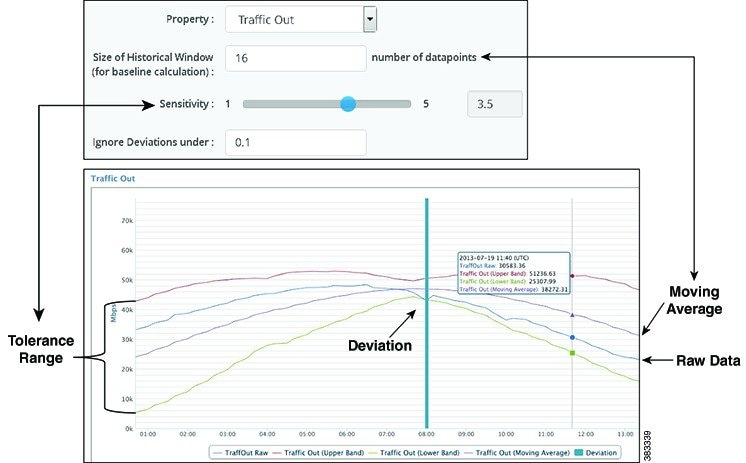
The moving average and range of acceptable tolerance for the property value are determined by two configurable fields, each of which creates corresponding lines in the graph.
-
Size of Historical Window—Identifies how many past data points to use in the calculation of the moving average.
-
The moving average, which appears in the graph, is how WAE Live expects the property value to change based on past behavior. This is calculated using Bollinger Bands.
-
A data point is a point in time in which you collect data. For example, if you collect every 5 minutes and you want the moving average to be based on the last 24 hours, enter 288.
-
-
Sensitivity—Identifies the tolerance range (standard deviation), which is how far from the moving average the raw data can be before it is flagged as a deviance: the higher the number, the higher the tolerance. This creates two lines that are equal distance on either side of the moving average line. If raw data crosses either the upper or lower band of tolerance, a deviance is recorded. See Deviation Report Configuration and Output for an example.
You can also set a threshold under which property values are not considered for the deviation calculation, thus filtering out insignificant deviation points. If the current data point is larger than the upper band or lower than the lower band, it is compared to the previous data point. If the absolute difference of these two values is lower than the “Ignore Deviations Under” value, the property value is ignored.
Example: Upper band is 1,000 Mbps and lower band is 500 Mbps. The “Ignore Deviations Under” value is 5. The last data point is 999 and the current data point is 1003.
1003 (last data point) - 999 (current data point) = 4
4 < 5 (Ignore Deviations Under)
Therefore, the current data point of 1003 would not be considered as a deviant. Note that had there not been an “Ignore Deviations Under” value set, the 1003 data point would be a deviant since it is larger than the upper band.
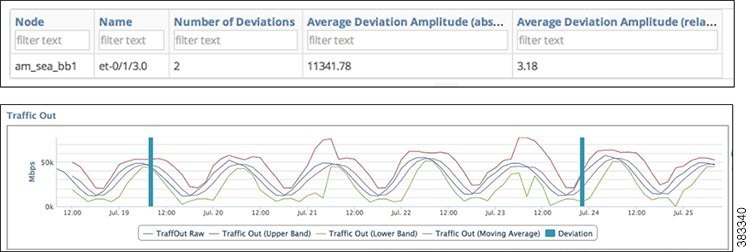
In addition to the graph, the report output identifies the following.
-
Number of Deviations
-
Average Deviation Amplitude Absolute, which is the size difference between the highest and lowest property values
-
Average Deviation Amplitude Relative, which is a comparison of the absolute amplitude to the standard deviation
To configure reports for a specific network, choose it from the Network menu (top left). If there is only one network configured, the word “default” appears.
Example: Example Deviation Report shows an example of a report identifying two deviations. Deviation Report Configuration and Output shows the configuration and an enlarged section of its output.
 Feedback