Cisco WAE 6.4 Network Visualization Guide
Bias-Free Language
The documentation set for this product strives to use bias-free language. For the purposes of this documentation set, bias-free is defined as language that does not imply discrimination based on age, disability, gender, racial identity, ethnic identity, sexual orientation, socioeconomic status, and intersectionality. Exceptions may be present in the documentation due to language that is hardcoded in the user interfaces of the product software, language used based on RFP documentation, or language that is used by a referenced third-party product. Learn more about how Cisco is using Inclusive Language.
- Updated:
- January 19, 2016
Chapter: Using Layouts
Using Layouts
A single plan can contain numerous layouts, each containing its own set of visual properties. Given the complexity of networks, you might need to create different layouts for numerous reasons. For instance, you might need to simplify sections of the network for better analysis or planning purposes. Another use might be to display a geographic layout or a schematic layout.
The attributes that are set and saved on a per-layout basis are hide/show objects, interface styles, site name placement, and all plot options. You can save the plot options as user defaults, thus making it easier to apply the same plot options to different layouts.
Saving a plan file saves all layouts. Once plot layouts have been designed for a particular plan file, you can copy them to another plan file by selecting the File->Copy From Template menu.
Weathermap vs. Design Layouts
There are two layout types: Weathermap and Design.
- The Weathermap layout is designed for use in a static, non-interactive view of a fixed network layout, with an emphasis on seeing operational issues such as high utilization. It is recommended for creating and editing WAE Live weathermap templates.
- The Design layout is more useful for interactive work where the emphasis is on detailed interactions and network editing. It is recommended for planning and design work within the WAE Design GUI. The WAE Design Archive application only supports the Design layout.

Note![]() Plan files open using the layout named Default, which is a Design layout. If this is your first time opening a plan file and you are modifying it to use in WAE Live, you must first either create a Weathermap layout or change the Default type to be a Weathermap layout. For instructions, see the Create or Edit Layouts section.
Plan files open using the layout named Default, which is a Design layout. If this is your first time opening a plan file and you are modifying it to use in WAE Live, you must first either create a Weathermap layout or change the Default type to be a Weathermap layout. For instructions, see the Create or Edit Layouts section.
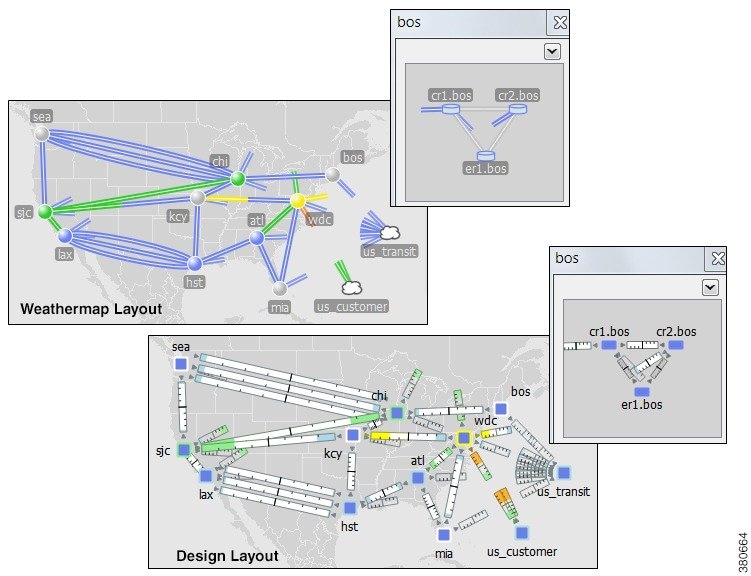
The conventions described in this guide apply to both Weathermap and Design layout types, but there are key differences between the two. Table 3-1 describes these differences, and Figure 3-1 shows an example of each layout using the same topology and canvas.
Table 3-1 Differences Between Weathermap and Design Layouts
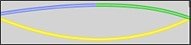
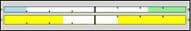


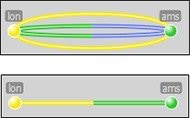
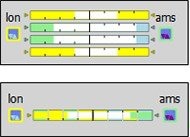


Figure 3-1 Example Weathermap and Design Layouts Using the Same Topology and Canvas
Create or Edit Layouts
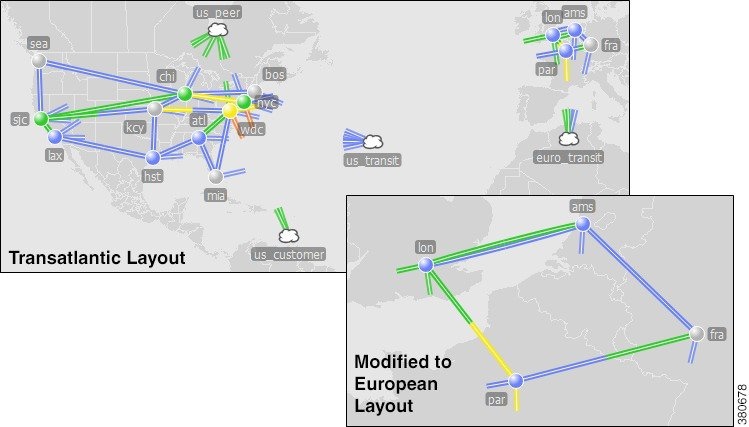
You can create or edit layouts to change the appearance or to narrow or broaden what you see in the plan file. This might be useful, for example, to focus on a specific section of a network. For example, Figure 3-2 shows a transatlantic layout that was modified to show only the European sites. Following are a few of the ways in which you might choose to create or edit layouts.
- Modify interface style. For example, you might want to shorten the interfaces to external sites.
- Show or hide sites.
- Arrange objects.
- Change the background map.
- Make other visual changes to the plot, such as identifying how circuits and interfaces appear.
Figure 3-2 Example Modified Weathermap Layout
Create Layouts
Step 1![]() Select Edit Layout from the Layouts drop-down list. The Edit Plot Layouts dialog box appears.
Select Edit Layout from the Layouts drop-down list. The Edit Plot Layouts dialog box appears.
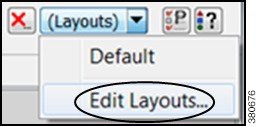
Step 2![]() You can use either New or Duplicate to create a new layout, or use the Edit option to edit existing layouts.
You can use either New or Duplicate to create a new layout, or use the Edit option to edit existing layouts.
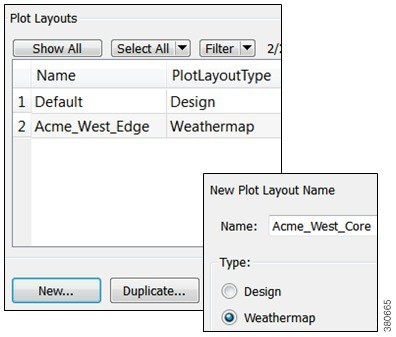
In the New Plot Layout dialog box, enter the layout name.
Select whether this is a Design or Weathermap layout.
If the sites have longitude and latitude coordinates defined, those are preserved. Otherwise, the sites are arranged in a square formation. Other plot settings are set to their defaults.
Step 3![]() Click OK in the Edit Plot Layouts dialog box.
Click OK in the Edit Plot Layouts dialog box.
Edit Layout Name or Type
Step 1![]() Select the name of an existing layout from the Edit Layouts menu, and then click Edit.
Select the name of an existing layout from the Edit Layouts menu, and then click Edit.
Step 2![]() Modify the name, the type, or both, and then click OK.
Modify the name, the type, or both, and then click OK.
Step 3![]() Click OK in the Edit Plot Layouts dialog box.
Click OK in the Edit Plot Layouts dialog box.
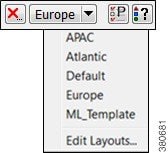
View Layouts
To view a layout, click on the Layout icon in the top, right corner, and select the desired layout from the drop-down list.
Related Topics
- Visualizing a WAE Network chapter
- Plan Files and Templates chapter
- Access WAE Live chapter
- Access an Archive chapter
- Access WAE Automation Server and Deploy chapter
 Feedback