Cisco WAE Live 6.2 Configuration Guide
Bias-Free Language
The documentation set for this product strives to use bias-free language. For the purposes of this documentation set, bias-free is defined as language that does not imply discrimination based on age, disability, gender, racial identity, ethnic identity, sexual orientation, socioeconomic status, and intersectionality. Exceptions may be present in the documentation due to language that is hardcoded in the user interfaces of the product software, language used based on RFP documentation, or language that is used by a referenced third-party product. Learn more about how Cisco is using Inclusive Language.
- Updated:
- October 1, 2015
Chapter: Map Settings
Map Settings
Access: WAE Live > Settings and select Map Settings tab
The Map Settings page enables you to configure the WAE Live Map panels, as well as set a default layout for the weathermap.
The Map Settings configurations are applicable to all networks and are not configurable for a specific network.
Configure Traffic Panel
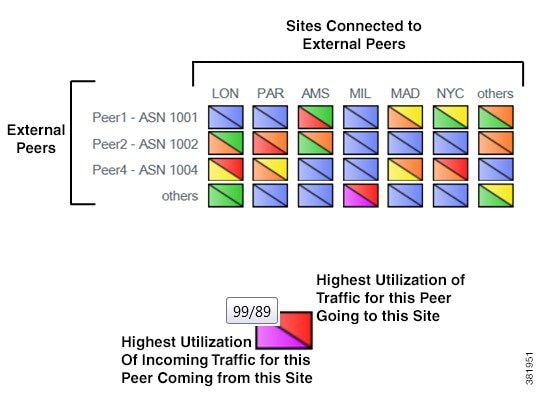
The Traffic Widget section enables you to configure the Peering panel that appears on the Map page. This panel shows the highest traffic utilization per peer and per site. The far left column lists the peers, while each top column lists the associated sites. The icons in the panel represent the traffic flowing between the two.
For this panel to have data, you must configure the collection of BGP. For information on how to configure the collection of data, see the WAE Platform Configuration Guide.
Traffic Widget Fields
- Enabled—If selected, the panel shows in the Map page. If not selected, the panel does not appear.
- Title—Name of the panel to appear on the Map page.
- Rows—Configure the ASNs (external peers) used in the panel. Their names appear on the left side of the panel. Each ASN represents a row in the panel.
–![]() Top ___ ASNs by Traffic Utilization—The ASNs with the highest traffic utilization. Enter a whole number 1-20.
Top ___ ASNs by Traffic Utilization—The ASNs with the highest traffic utilization. Enter a whole number 1-20.
–![]() Except—To exclude specific ASNs that would be captured by the highest utilization, enter one or more ASNs separated by commas.
Except—To exclude specific ASNs that would be captured by the highest utilization, enter one or more ASNs separated by commas.
–![]() Only These—To use only a specific set of ASNs, regardless of their traffic utilization, enter one or more ASNs separated by commas.
Only These—To use only a specific set of ASNs, regardless of their traffic utilization, enter one or more ASNs separated by commas.
- Columns—Configure the sites used in the panel. Their names appear across the top of the panel. Each site represents a column in the panel.
–![]() Top ___ Sites by Traffic Utilization—The sites with the highest traffic utilization. Enter a whole number 1-20.
Top ___ Sites by Traffic Utilization—The sites with the highest traffic utilization. Enter a whole number 1-20.
–![]() Only These—To use only a specific set of sites, regardless of their traffic utilization, enter one or more site names separated by commas.
Only These—To use only a specific set of sites, regardless of their traffic utilization, enter one or more site names separated by commas.
Configure Events Panel
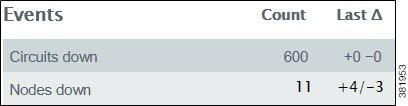
The Events Widget section enables you to configure which events appear on the Map page. This panel tracks a set of current events and the number of changes since the last plan file was received.
Configuration of this panel is a combination of this UI and the default_timeplot_summary_format.txt file located in the $CARIDEN_HOME/etc/matelive directory. ( $CARIDEN_HOME is the location of where the software package is installed, which is by default /opt/cariden/software/mate/current.)
For an event to appear, it must be configured in both locations. Combining the examples in this section would result in two events in the panel: Circuits down and Nodes down.
-
default_timeplot_summary_format.txtfile—Defines the metrics used for the events. Each metric is listed in the “Queries” section. For information on how to configure this file, see the comments at the end of the file, or refer to the Archive chapter in the WAE Platform Configuration Guide.
Example: This is an excerpt from the default file.
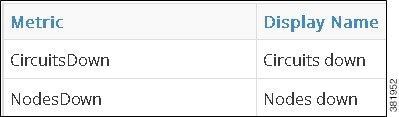
- Events Widget UI—This section lists the metrics and their display names. Each metric must match an event metric (query) that appears in the
default_timeplot_summary_format.txtfile.
Events Widget Fields
- Enabled—If selected, the panel shows in the Map page. If not selected, the panel does not appear.
- Title—Name of the panel to appear on the Map page.
- Add Metric—Click to add a new event for display on the Map page.
–![]() Metric—The name of the event metric that appears in the
Metric—The name of the event metric that appears in the default_timeplot_summary_format.txt file.
–![]() Display Name—The event name that appears in the panel on the Map page.
Display Name—The event name that appears in the panel on the Map page.
- Edit (pencil icon)—Edit the event metric name or the display name.
- Delete (trash can icon)—Delete a metric from the UI so that it no longer appears in the Events panel. There is no undo.
- Advanced Config—This is for advanced configuration editing only. Consult your support representative for assistance.
Related Topics
-
default_timeplot_summary_format.txtconfiguration, see comments in the file or see the Archive chapter in the WAE Platform Configuration Guide - General Settings
- User-Defined Properties
 Feedback