Using Prepackaged Reports
Operations Reports provides many prepackaged reports that cover a wide range of data available in Cisco Prime Network. The following categories of prepackaged reports are available:
-
Data Center Reports
-
Fault Reports
-
Mobility Reports
-
Network Service Reports
-
Physical Inventory Reports
Some of the prepackaged reports are customizable, allowing you to tweak them to meet your organization's needs.
In addition, some of the prepackaged reports allow you to drill down to more granular details. For example, if you ran the Device Administration report, device details are displayed in the report, with each IP address hyperlinked. Clicking the IP address opens a new report with device details. This report can be opened only through a read-only prepackaged report. Additionally, the read-only prepackaged reports can be scheduled and viewed in a preferred format.
Note You cannot delete prepackaged reports.
This section contains the following topics:
Generating Reports
The procedure to generate a report depends on the type of report you choose. Customizable prepackaged reports are denoted by a small pencil icon next to the report name in the left navigation pane. A plain report icon indicates that the report is ready-only. To see the image, see Figure 1-2.
This section contains the following topics:
Generating Customizable Prepackaged Reports
To generate a report:
Step 1 Double-click the report from the left navigation pane.
Step 2 If you are viewing Fault reports, you must first set the period for which you need the fault data to be reported. Click the
Prompts
icon and set the
From
and
To
dates.
Step 3 Click
View Report.
If the Output type is PDF, and if you are using the Google Chrome browser, ensure to do the following:
1. Choose chrome://plugins/.
2. In the Chrome PDF Viewer area, toggle the mode from Enable to Disable.
3. In the Operations Reports window, click View > Refresh.
4. Click View Report to view and download, or Print the selected report in the Reporting pane.
Step 4 If you wish to customize the report to suit your requirement, from the left navigation pane, choose the report, and click the
Edit
icon. The customizing options are now available. For more information, see Customizing Reports.
Generating Read-Only Prepackaged Reports
To generate a report:
Step 1 From the left navigation pane, choose the report you prefer to run.
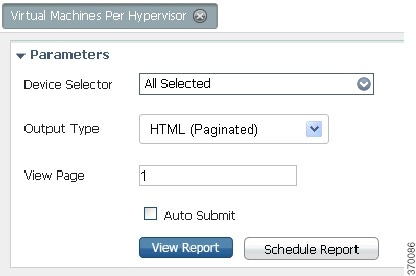
Step 2 Enter the parameters, as required. From the example shown in for a report Virtual Machines per Hypervisor, the details required are the devices for which a report must be generated, the output type, and the number of pages the report must span.
Note If you are generating Fault reports, you must select the period for which the fault data must be reported.
A report can be generated in one of the following formats:
-
HTML—Displays the report in a browser window. HTML is the default format. The report contains only one HTML page with the report data.
-
HTML (Paginated)—Some reports that represent voluminous data have the option of HTML paginated view for better usability. If you selected this option, the report is split into several pages. The first page opens by default. To view the subsequent pages, enter the page number in the
View Page
field.
-
PDF—Displays a PDF version of the report.
Note If you are using the Google Chrome browser, you must ensure that Chrome PDF Viewer is in the disable mode. To disable the Chrome PDF Viewer, choose chrome://plugins/ and toggle the Chrome PDF Viewer to Disable mode. After you complete the setup, you should refresh your selected report area in the right pane (Click View > Refresh), to view and download the PDF report.
-
CSV—Creates a CSV version of the report that you can either save to a specific location or view using another application. The CSV version contains only the report data; it does not contain the header information, layout, or formatting information that is available in other formats.
-
XLS—Creates an XLS version of the report that you can either save to a specific location or view using another application, such as Microsoft Excel.
-
RTF—Creates an RTF version of the report that you can either save to a specific location or view using another application, such as Microsoft Word.
Figure 3-1 Parameters Window
Step 3 Click
View Report.
Alternatively, check the
Auto Submit
check box to generate the report as you select the parameters.
Operations Reports generates and presents a latest report. Depending on the type of report, the data may be presented in a bar chart, pie chart, table, or a trend diagram.
If there is no connection to the database, while generating read-only prepackaged report, the following message appears:
Error processing component.
Refreshing Prepackaged Read-Only Reports
By default, prepackaged read-only reports are updated with the latest changes in database when you open the report from the left navigation pane. If new devices are added, the devices appear in the Device Selector list after one hour of generation of the report for the first time. To view the updated list of devices in the Device Selector, close and reopen the report.
However, it takes up to five minutes for changes made in the Prime Network GUI clients to be reflected in Operations Reports. For example, when a VNE is added to the system, it is not shown in Operations Reports until the discovery is complete which could take up to five minutes. Other changes to devices, such as port up/down, might take less time to be reflected in the reports. After the expiry of 5 minutes, click
View Report
for the report to be updated with the relevant data.
Prepackaged Data Center Reports
Using prepackaged data center reports, you can view data center inventory details such as that of VM and host. It can also be used to view vital statistics of the host and VM; the reports present data on VMs based on state, based on the hypervisor it is associated with, or based on their current state such as powered off state or suspended state. The host and VM statistics are updated every 15 minutes. This section lists the data center reports that are provided with Operations Reports and provides a general summary of the content of each report.
|
|
|
|
|
Virtual Machine State Distribution
|
Generates a report of virtual machines based on state. Provides the VM details such as VM IP address, VM State, MAC address, VM version. Using this report, you can view the following fields as well:
-
Fault Tolerance Enabled
-
VM Up time
-
VM Communication State
-
VM Lifecycle State
|
Virtual Machine Per Hypervisor
|
Generates a report of the number of virtual machines associated with a hypervisor. This provides host details, hypervisor details such as version, start time, software type, number of VMs, and the associated VM count.
|
Virtual Machines - Powered Off State
|
Provides a report on the number of virtual machines which are powered off. Using this report, you can view the following fields of a virtual machine:
-
Virtual Data Center Name
-
Host Name
-
VM Name
-
VM IP Address
-
VM Description
-
MAC Address
-
VM State
-
Virtual CPU
-
Fault Tolerance Enabled
-
VM Up time
-
UUID
-
VM Communication State
-
VM Lifecycle State
|
Virtual Machines - Suspended State
|
Provides a report of the virtual machines that are operationally down. Using this report, you can view the following fields of a virtual machine in suspended state:
-
Virtual Data Center Name
-
Host Name
-
VM Name
-
VM IP Address
-
VM Description
-
MAC Address
-
VM State
-
Virtual CPU
-
Fault Tolerance Enabled
-
VM Up time
-
UUID
-
VM Communication State
-
VM Lifecycle State
|
|
Read-Only Reports
|
Virtual Machine State Distribution
|
Generates pie charts that depict the distribution of devices by their state. It also displays the device name, VM name, IP address, VM state, and UUID. The number of devices that you selected when generating the report is displayed below the pie chart.
Click the respective device state in the pie chart to filter and view the details of devices that are in a particular state. The selected filters appear in the beginning of the table that displays the device details. Click the X link that appears next to a filter to remove that filter.
|
Virtual Machine Per Hypervisor
|
For the selected devices, generates a report on the number of virtual machines associated with each hypervisor. Provides information on type of hypervisor, name, description, and the number of VMs associated.
|
Virtual Machines - Powered Off State
|
For the selected devices, generates a report on the number of virtual machines that in the state ‘Powered Off’. Provides information on name of device, VM name, IP address, VM state, and UUID.
|
Virtual Machines - Suspended State
|
For the selected devices, generates a report on the virtual machines in the state ‘Suspended’.
|
Prepackaged Fault Reports
Fault reports help you understand the various types of faults that arise in the network. Fault report include various reports on network event and non-network events. Non-network events reports are listed in
Table 3-1
.
The reports help you understand your deployments and the state of operations better. Using the data that the reports present, network operations center (NOC) managers are better positioned to take decisions that can increase the efficiency of the operations.
Some of the reports can be used for daily management of NOCs while others can be used for long-term planning. For example, using the Daily Average and Peak report, you can understand when the number of events peaks. This could be directly linked to another network activity such as an installation or addition of network elements. If this pattern occurs for an extended period, it may indicate the need to perform capacity planning such as upgrade the hardware availability in the network.
However, reports such as Archived Event Count per Device helps capacity planning, configuration changes analysis, service planning, and service changes analysis. An analysis of the events for a certain period on a certain number of devices, may be indicative of a systemic problem in some of the devices. This may be a symptom of an underlying issue such as device maintenance. The NOC managers may have to look at the mean time to replace the hardware equipment in the operation center. For example, if the pattern of events occurs every 18 months instead of a planned window of 20 to 24 months, it may mean that the devices must be replaced once in 18 months.
Customizable reports present data on archived events/tickets. These events or tickets are not active and are the ones that are already cleared. The data present historical trend of events.
Read-only prepackaged reports present both active and archive fault data.
This section lists the fault reports that are provided with Operations Reports and provides a general summary of the content of each report.
|
|
|
|
|
Archived Event Correlation Statistics
|
Provides a report of the average, minimum, and maximum number of events that were correlated to each ticket type for a given period. Based on a ticket type, the report displays the lowest, average, and highest number of events correlated.
|
Archived Event Count by Severity per Device
|
Generates a report on the event count based on the severity of archived event.
|
Archived Event Count by Type per Device
|
Generates a report on the count of each type of archived event.
|
Archived Syslog Count by Device
|
Generates a report on the number of archived syslogs for devices.
|
Archived Syslog Count by Type
|
Provides a report on the number of archived syslogs by type for a given period.
|
Archived Syslog Count by Type per Device
|
Provides a report on the number of archived syslogs by type for each device for a given period.
|
Archived Trap Count by Device
|
Generates a report on the number of archived traps by device.
|
Daily Count of Archived Events per Type
|
Provides a report on the daily count of archived events for every type for each device for a selected period.
|
Daily Standard Event Count
|
Provides a report on the daily count of standard events per detection type for a selected period.
|
Standard Event Count by Device
|
Provides a report on the number of standard events by device for a selected period.
|
Standard Syslog
|
Provides a report that lists all standard syslogs with severity, device on which the syslog was raised, and total events.
|
|
|
Threshold—Crossing Syslogs
|
Provides a report that lists the count of events, per syslog type, that has crossed the threshold limit, which was set when generating the report. For example, if the threshold is set to 10, the count of events less than 10 are filtered from the detailed report and the count of filtered events is displayed as Ignored Count. So, the total event count will be the sum of ignored count and the count of events that has crossed the threshold.
|
Daily Average and Peak
|
Provides a graphical representation of the count of number of events per day. The sampling period can be set to seconds, 10 seconds, minute, hour, or day. For example, if you select the sampling rate to be 10 seconds, the day’s duration is split into 10-second intervals, and the number of events occurring in those intervals are represented in the graph. The peak is the highest number of events recorded in a 10-second interval, and average is the total number of events divided by the number of 10-second intervals seen on that day.
Note Changing the sampling rate does not alter the naming of Y-axis. Despite selecting 10 seconds as sampling rate, the Y-axis defaults to Count of Events per Day. However, the values represented are dynamic and change according to the sampling rate selected.
The graph indicates where the activity has been the highest and the lowest. The peak rate of events could be attributed to a particular reason or combination of events. For example, an increase in the number of events at a particular point in a day could be due to external events. The administrator can use this report to determine if the events normalize after the external event is cleared. An example of an external event could be construction equipment interfering with fiber optical lines.
Also, if the number of events increases at a particular point in the day, it could indicate a heavy load due to over staffing at that period. To normalize the events, the staff working have to be assigned different shifts.
|
Events Distribution
|
Generates pie charts representing the number of events based on devices, severity, and fault category. This report provides a high-level view of where the events arise from. You can identify the event in one of the 11 categories such as Communications, Quality of Service. Based on category of events and their severity, the NOC administrators use the data represented by this report for planning purposes. For example, an increase in the number of Communication events over a particular period may be because of a high number of staff during that period. This may require replanning on allocation of the staff.
Similarly, a high number of events in Quality of Service may indicate the need to revisit the configuration policies and to reduce the number of events coming in.
|
Incoming Events Distribution
|
Displays a bar chart of the incoming event trend distributed by severity for a selected period. This is a micro-level view of events that are recorded on a daily basis to determine if the day-to-day functioning of the network is as expected.
|
Incoming Tickets Distribution
|
Generates a bar chart depicting the distribution of tickets by maximum severity of event for a selected period. This report presents the number of tickets that are incoming on a daily basis, and the number of tickets that are cleared. Using this, the efficiency of staff can be evaluated.
|
Mean Time to Close Tickets
|
Generates a bar chart of the mean time to resolve tickets for a selected period. This represents the average time taken to resolve a ticket, with the highest time taken to resolve a ticket being the first item. Using this, you can determine which tickets took the longest to close. The time taken is arranged in descending order. The time taken to close a ticket is calculated based on the last modification time, which is the time of the ticket being cleared, and then archived.
If the time taken to close tickets is too long, the administrator can analyze the operation procedures involved in closing tickets, and, if required, enhance maintenance operation.
Note The time to repair is based on the ticket creation time and the time the ticket was last modified. For example, if you acknowledge a ticket after it has been cleared. the acknowledgement time affects the time to repair for that ticket.
|
Most Common Syslogs
|
Generates a pie chart of the syslogs for the selected period. Represents the following data:
-
Syslog Mnemonic
-
Count
-
Severity
-
First Occurrence Time
-
Last Occurrence Time
Using this report, an administrator can determine the most common syslogs, and check the policies that are configured on network elements to handle the syslogs. If the number of syslogs received are high, with no action being taken on them, the administrator can change the policy to not forward the syslogs to the devices.
|
Ticket Trend
|
Provides a graphical representation of incoming and archived ticket trend for a selected period.
Archived ticket means that the ticket has been acknowledged and cleared. The ticket gets closed one hour after it was cleared if no other related event occurs. This ticket is also archived.
|
Upgraded Events vs. Standard Events
|
Provides a report that lists the daily count of each of the following types of upgraded events and standard events for the selected period:
-
Syslogs
-
Traps
-
Tickets
-
Correlated events
-
Uncorrelated events
-
Nonnetwork events
-
Network-originated events
-
Network-originated events and services events
Use this report to compare the daily number of upgraded and standard events.
|
Non-Network Reports
Non-network reports covers report for audit, provisioning, security, and system event details. All of these are customizable reports.
Table 3-1 Audit, Provisioning, System, Security Event Reports (Non-Network Reports)
For this non-network event information:
|
|
|
Can you specify a time period?
|
|
|
Audit event details:
-
Severity, timestamp, description
-
Username, originating IP address
-
Command details: name, parameters,
|
Detailed Audit Events
|
No
|
Yes
|
Provisioning Event Details:
-
Severity, event ID, date and time, description, location
-
Username, device username, status.
|
Detailed Provisioning Events
|
No
|
Yes
|
Security Event Details:
-
Severity, event ID, date time, description, location
-
Username, originating IP address
|
Detailed Security Events
|
No
|
Yes
|
System Event Details:
-
Severity, event ID, time, description, location,
|
Detailed System Events
|
No
|
Yes
|
Prepackaged Mobility Reports
Using prepackaged mobility reports, you can view the details of mobility services that are configured on a device. You can view high-level data of the Access Point Names (APN) that are configured on the various devices, and the other services that are configured. For example, you can view the visiting profiles of the various APNs of the devices chosen. A report with roaming profile and device name can help an administrator determine the APNs that have a specific roaming profile. This helps in planning prior to any configuration changes, such as change of roaming profile.
This section lists the mobility reports that are provided with Operations Reports and provides a general summary of the content of each report.
|
|
|
|
|
Mobility Gateway Applications
|
Provides a report of the mobility services configured per device along with the associated service name and the context name.
|
|
|
APNs by Device
|
This report can also be used to ascertain the APNs that are present in the various devices to facilitate capacity and service planning. This report allows you to compare the various APN properties that are configured on the various APNs in a particular device. Provides a report of Access Point Names configured on devices. Depicts the following data:
Provides APN details upon clicking the APN name listed in the report. To compare the APN properties configured on different APNs, click the APN name from the report, and then compare the properties.
|
Devices by APN
|
Generates a report of list of devices configured with an Access Point Name. Since each APN can be identified with a service for an enterprise customer, and APNs are configured on a range of gateways, the report can be used to understand which device provides a particular service and how the device can be optimized further.
The following details are displayed:
Provides APN details of the APN in a device upon clicking the APN name listed in the report.
|
Mobility Gateway
|
Generates a report that specifies if the following mobility services are configured on the selected devices. If a service is configured, the service is marked with Yes against the device on which it is configured.
-
Serving Gateway
-
Packet Data Network Gateway
-
Mobility Management Entity
-
Home Agent
-
Packet Data Serving Node
-
Evolved Packet Data Gateway
-
Gateway GPRS Support Node
-
Serving GPRS Support Node
|
Prepackaged Network Service Reports
Using the Network Service reports, you can generate reports to view virtual connection details with filters such as EVC or map name. The reports also display details such as, layer 2 VPN name and customer label (business tag). The Virtual Connection Summary generates a report with additional details, such as Edge EFPs associated with the EVC or Layer 2 VPN, and EFT fragment name and type.
Using the Network Service reports, you can also view all the services that are created and associated with maps.
Using Network Pseudowire report, you can view network pseudowire information with additional filters such as name, type, or map name. The Network Pseudowire Summary report presents additional information such as pseudowire details and type, pseudowire edge, Ethernet flow point, or switching entity.
The VPLS information presents VPLS/H-VPLS information which you can filter using a VPLS/H-VPLS name or map name, customer labels (business tags), or maps containing the VPLS/H-VPLS instance.
|
|
|
|
|
|
Virtual Connection Detailed
|
Provides a detailed report with the following information for each virtual connection :
-
Virtual connection or Layer 2 VPN name
-
Business tag assigned to the virtual connection or layer 2 VPN instance
-
EVC name
-
Business tag assigned to the EVC
-
Maps containing the Virtual connection or Layer 2 VPN
-
Edge EFPs associated with the EVC or Layer 2 VPN
-
EFD fragment names
-
EFD fragment type
You can filter report content by specifying part or all of the following:
-
Virtual connection name
-
EVC name
-
Virtual connection business tag
-
EVC business tag
-
Map name
|
Network Pseudowire Detailed
|
Provides a detailed report with the following information for each network pseudowire:
-
Pseudowire name
-
Pseudowire type
-
Business tag assigned to the pseudowire
-
Maps containing the pseudowire
-
Pseudowire details
-
Type of pseudowire, such as pseudowire edge, Ethernet flow point, or switching entity
You can filter report content by specifying part or all of the following:
-
Pseudowire name
-
Pseudowire type
-
Business tag
-
Map name
|
VPLS Detailed
|
Provides a detailed report with the following information for each VPLS or H-VPLS instance:
-
VPLS or H-VPLS name
-
Business tag associated with the VPLS or H-VPLS instance
-
Maps containing the VPLS or H-VPLS instance
-
VPLS details
-
Type of VPLS service, such as VPLS forward, access EFP, or core pseudowire
You can filter report content by specifying part or all of the following:
-
VPLS or H-VPLS name
-
Business tag
-
Map name
|
|
|
Virtual Connection Summary
|
Provides a summary of the following information for each Virtual connection:
-
Virtual connection or Layer 2 VPN name
-
Business tag assigned to the Virtual connection or Layer 2 VPN instance
-
EVC name
-
Business tag assigned to the EVC
-
Maps containing the Virtual connection or Layer 2 VPN
You can filter report content by specifying part or all of the following:
-
Virtual connection name
-
EVC name
-
Virtual connection business tag
-
EVC business tag
-
Map name
|
Network Pseudowire Summary
|
Provides a summary of the following information for each network pseudowire:
-
Pseudowire name
-
Pseudowire type
-
Business tag assigned to the pseudowire
-
Maps containing the pseudowire
You can filter the report content by specifying part or all of the following:
-
Pseudowire name
-
Pseudowire type
-
Business tag
-
Map name
|
VPLS Summary
|
Provides a summary of the following information for each VPLS or H-VPLS instance that is associated with a map:
-
VPLS or H-VPLS name
-
Business tag assigned to the VPLS or H-VPLS instance
-
Maps containing the VPLS or H-VPLS instance
You can filter the report content by specifying part or all of the following:
-
VPLS or H-VPLS name
-
Business tag
-
Map name
|
Prepackaged Physical Inventory Reports
Using Physical Inventory Reports, you can view the current status of your physical devices. For example, to gain a comprehensive view of the different module types configured in the network, you can run Module Type Distribution report. This report lists all modules types (modules and submodules) with hardware serial number, and the software and hardware version of a device. To view further details of a module type, click the respective slice in the pie chart.
To know the modules that run software that are moving towards end of life state, run the Module Summary by Version report. The report can further be filtered to view the required software versions.
Device Administration report presents a general overview of the physical inventory in the network.
This section lists the physical inventory reports that are provided with Operations Reports and provides a general summary of the content of each report.
|
|
|
|
|
Device Polling Approach
|
Generates a report on the distribution of devices based on the polling approach. Presents information on device name, polling group, and the polling approach.
|
Device Polling Approach Summary
|
Generates a report on the consolidated number of devices that are governed by a polling approach.
|
Device Summary
|
Provides details of devices for every device series. For every device series, provides device information on name, type, IP address, communication state, number of chassis, number of modules, and number of ports.
|
Hardware Detailed
|
For every device, generates a report on the modules, sub-modules, and the module status.
|
Module Summary by Device
|
Presents a report on the module and sub-module details for every chassis and device type. Details include type, serial number, software version, and hardware version.
|
Module Summary by Type
|
Generates a report on device details for every chassis, module, and sub-module type. Provides device information such as device IP, module serial number, hardware and software version.
|
Software Summary by Device
|
For every device, presents a report on the details of software such as software version, image file, serial number.
|
Software Summary by Version
|
For every software version, presents details of associated devices. Details include device type, IP address, serial number, image type.
|
|
|
Device Administration Report
|
Generates pie charts that depict the distribution of devices by operational status, scheme, and polling group. The number of device series and device vendor that you selected when generating the report are displayed below the pie chart.
Click the respective slice in a pie chart to filter and view the details of devices that fall under that particular operational status, scheme, and polling group. The selected filters appear in the beginning of the table that displays the device details. Click the X link that appears next to a filter to remove that filter. In the operational status, devices with Connection Failed, Operational, Maintenance, Not Operational state are displayed in the pie chart.
|
Device Type Distribution
|
Generates a bar chart depicting the number of devices by device type. The number of device series and device vendor that you selected when generating the report are displayed below the bar chart.
Click the respective bar and the hyperlinked device IP to filter and view the device details. Click the Remove Chart Filter link to remove the filter.
|
Device Unreachable
|
Provides details of devices with connection failed state in the form of a pie chart. The number of devices that you selected when generating the report is displayed below the pie chart. From the pie chart, click the device status to filter and view the details of every device that belongs to the respective device status. The following details appear:
-
Name
-
IP Address
-
SNMP Protocol
-
SNMP Protocol State
-
SNMP Protocol State Since
-
Telnet Protocol
-
Telnet Protocol State
Click the Remove Chart Filter link to remove the filter.
|
Module Type Distribution
|
Generates a bar chart of the distribution of all modules by module types. The number of devices, device series, device vendor, and device type that you selected when generating the report are displayed below the bar chart. Click the bar that represents a particular slot type to filter and view module details. To view the device details, click the hyperlinked device IP address. Click the Remove Chart Filter link to remove the filter.
|
Software Distribution
|
Provides a bar chart of the distribution of all devices by software version. The number of device series and device vendor that you selected when generating the report are displayed below the bar chart. Click the bar that represents a particular software type to filter and view the software details. To view the device details, click the hyperlinked device IP address. Click the Remove Chart Filter link to remove the filter.
|

 Feedback