Introduction
From Prime Central's Data Center page, you can monitor the health and performance of your data center. The components that make up your data center include compute service resources (such as bare metal blade servers and virtual machines), managed VPNs, and storage devices. To access the Data Center page, choose .
At the top of the Data Center page, you will find four tabs:
-
Overview
-
Compute
-
Network
-
Storage
The information displayed on the Data Center page will vary, depending on which of these tabs you select. A good amount of this information is gathered from Prime Performance Manager. Keep the following in mind when viewing this page:
-
After Prime Performance Manager integration with Prime Central completes: -
It will take anywhere from one hour to a few hours for Prime Performance Manager chart data to be generated and displayed.
-
All of the necessary Prime Performance Manager reports will be enabled with the correct report settings configured. For more information, see Default Prime Performance Manager Reports.
-
-
After the Prime Central server starts, it might take a few hours for the charts for certain Data Center objects to become visible.
Default Prime Performance Manager Reports
Take note of the reports listed in the following table. After you integrate Prime Performance Manager with Prime Central, all of these reports should be enabled within Prime Performance Manager and configured to report data for one of the four default reporting intervals (the past 15 minutes, the past hour, the past week, and the past month). We recommend that you do not make any changes to these settings because Prime Central will not display Prime Performance Manager data properly if you do so.
|
Report Name |
Path |
Corresponding Prime Performance Manager Dashboard Path (if applicable) |
|---|---|---|
|
SNMP/Hypervisor Ping |
— |
|
|
Interfaces |
||
|
Interface Status |
||
|
Interface Status Aggregate |
||
|
CPU |
||
|
Memory |
||
|
Interface |
||
|
Host Per Datastore |
||
|
Host Total CPU |
||
|
Host Total Memory |
||
|
vCenter Host Total CPU |
||
|
vCenter Host Per Network |
||
|
vCenter Host Per Datastore |
||
|
vCenter Host Total Memory |
||
|
vCenter VM Per Network |
||
|
vCenter VM Total Memory |
||
|
vCenter VM Total CPU |
||
|
vCenter VM Per Datastore |
||
|
vCenter Host Per Datastore |
||
|
vCenter VM Per Datastore |
||
|
CPU |
||
|
Memory |
||
|
Disk |
||
|
Interface |
||
|
CPU |
||
|
Memory |
||
|
Disk |
||
|
Interface |
||
|
L3 General VPN |
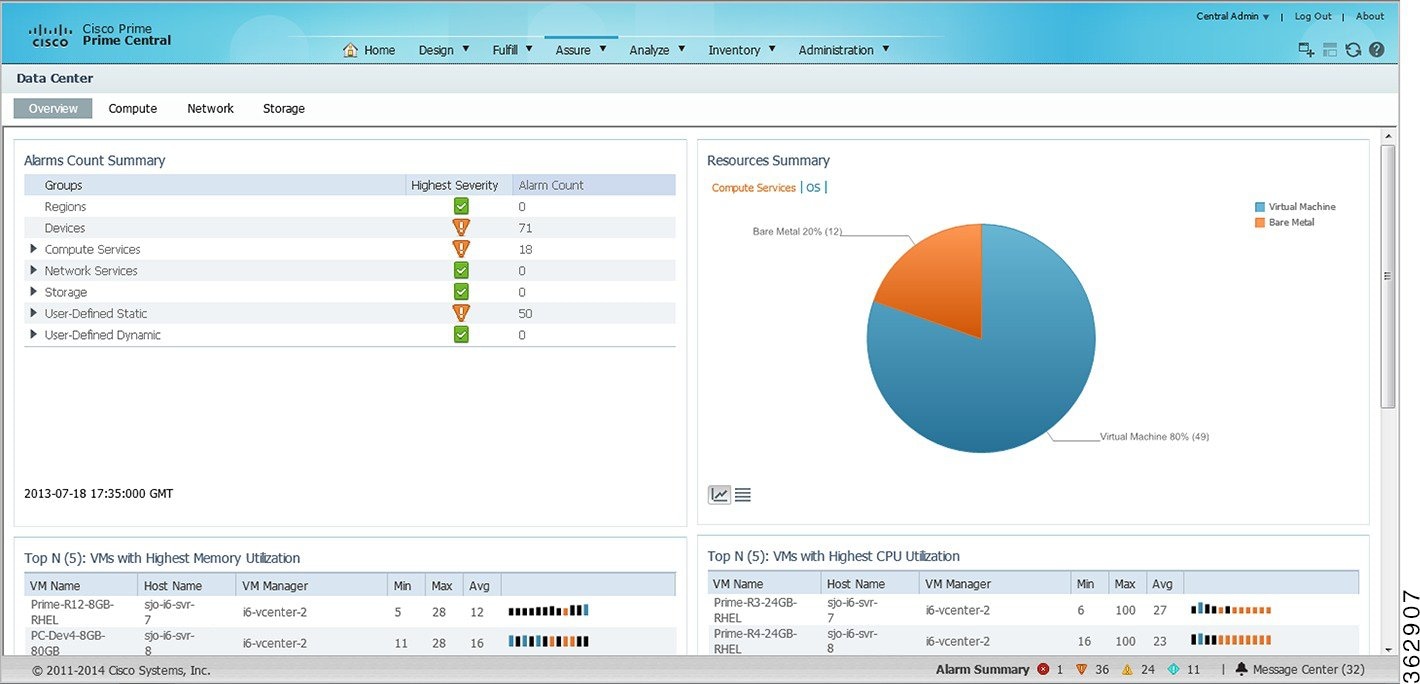
Overview Window
When monitoring your data center, begin by viewing the Overview window (see the following figure). The six portlets displayed here paint a high-level picture of your data center's performance and status, providing data such as:
-
An alarm count (broken down by group)
-
A chart that visualizes the compute service resources that are currently running
-
Tables that list the top virtual machines by four key benchmarks: memory utilization, CPU utilization, alarm count, and I/O latency
With this information, you can identify any area within your data center that needs further attention.
Note the following regarding the Overview window:
-
You cannot remove any of the default portlets displayed here.
-
Any additional portlets you choose to add are automatically placed at the top of the window.
-
You cannot customize the window's layout.
Compute Window
From the Compute window you can view information about the compute service resources that are managed within your data center. These resources include bare metal blade servers and virtual machines, hypervisors, and device clusters. At the top of the window, you will find the following tabs:
-
Compute Service
-
Hypervisor
-
Clusters
To view information for a particular compute service resource type, click the corresponding tab.
Compute Service Pane
From the Compute Service pane, you can view information about the bare metal blade servers and virtual machines associated with your data center.
The following table describes the information provided in the Compute Service pane.
| Column | Description |
|---|---|
|
Name |
Name of a compute service resource. |
|
Status |
Current status of a compute service resource. |
|
Alarm |
Indicates the highest severity of any alarms generated for the compute service resource. |
|
Total Alarm Count |
Total number of alarms generated for the compute service resource. |
|
Server |
Server associated with the compute service resource. |
|
Customer |
Customer associated with the compute service resource. |
|
IP Address |
IP address configured for the compute service resource. |
|
Type |
Indicates whether the compute service resource is a bare metal blade or virtual machine. |
|
Hypervisor Type |
Type of hypervisor configured for the selected virtual machine. |
|
Lifecycle |
Current lifecycle state for the compute service resource: Development, Production, or Staging. For more information, see Setting the Lifecycle State and Priority for a Compute Service Resource. |
|
Priority |
Priority assigned to the compute service resource. For more information, see Setting the Lifecycle State and Priority for a Compute Service Resource. |
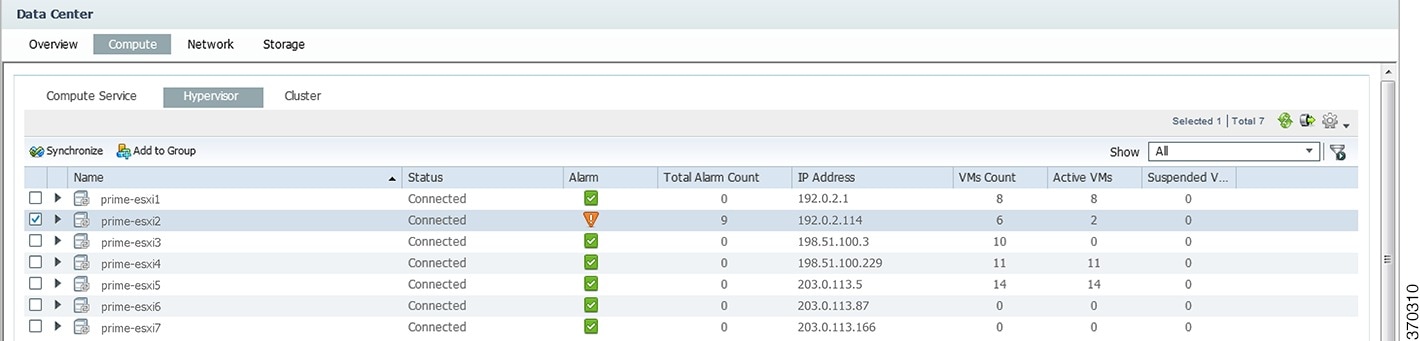
Hypervisor Pane
From the Hypervisor pane, you can view information about the hypervisors associated with your data center and determine if the number of alarms for any of these hypervisors is higher than normal.
The following table describes the information provided in the Hypervisor pane.
| Column | Description |
|---|---|
|
Name |
Name of a hypervisor. |
|
Status |
Current status of the hypervisor. |
|
Alarm |
Indicates the highest severity of any alarms generated for the hypervisor. |
|
Total Alarm Count |
Total number of alarms generated for the hypervisor. |
|
IP Address |
IP address configured for the hypervisor. |
|
VMs Count |
Number of VMs associated with the hypervisor. |
|
Active VMs |
Number of VMs associated with the hypervisor that are currently active. |
|
Suspended VMs |
Number of VMs associated with the hypervisor that are currently suspended. |
Cluster Pane
From the Cluster pane, you can view information about the device clusters associated with your data center and determine if the number of alarms for any of these clusters is higher than normal.
The following table describes the information provided in the Cluster pane.
| Column | Description |
|---|---|
|
Name |
Name of a device cluster. |
|
Host Count |
Number of host associated with the device cluster. |
|
Alarm |
Indicates the highest severity of any alarms generated for the device cluster. |
|
Total Alarm Count |
Total number of alarms generated for the device cluster. |
|
vMotion Events |
Number of vMotion events that have occurred on the devices associated with a particular cluster. A vMotion event is triggered each time a managed virtual machine is moved from one host to another host. |
Network Window
From the Network window you can view information for the VPNs managed within your data center and identify any VPNs that need to be looked at more closely (as indicated by a high alarm count). The list of VPNs provided here is gathered from Prime Network.
 Note |
When Virtual Routing and Forwarding (VRF) is deleted from the network, the corresponding VPN is deleted automatically after 10 days. |
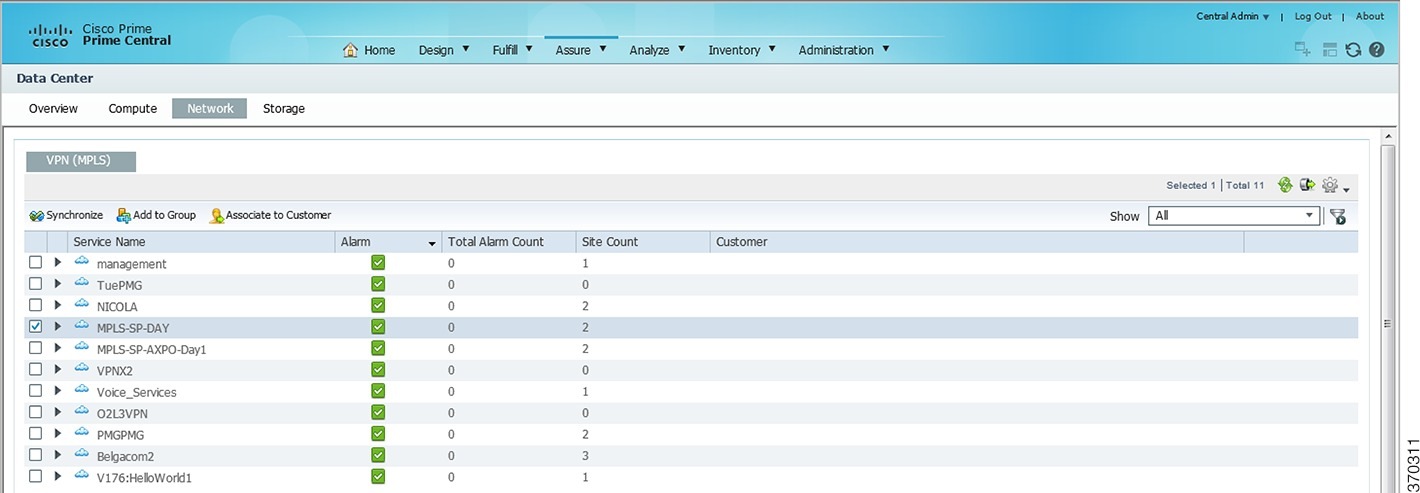
The following table describes the information provided in the VPN (MPLS) pane.
| Column | Description |
|---|---|
|
Service Name |
Name of the VPN. |
|
Alarm |
Indicates the highest severity of any alarms generated for the VPN. |
|
Total Alarm Count |
Number of alarms generated for the VPN. |
|
Site Count |
Number of sites the VPN is associated with. |
|
Customer |
Indicates the customer associated with the VPN. Note that only one customer can be associated with a VPN at any given time. |
Storage Window
From the Storage window you can view information for the storage devices associated with your data center and quickly determine if you need to free up space on any of these devices. The list of devices displayed here is gathered from Prime Network.
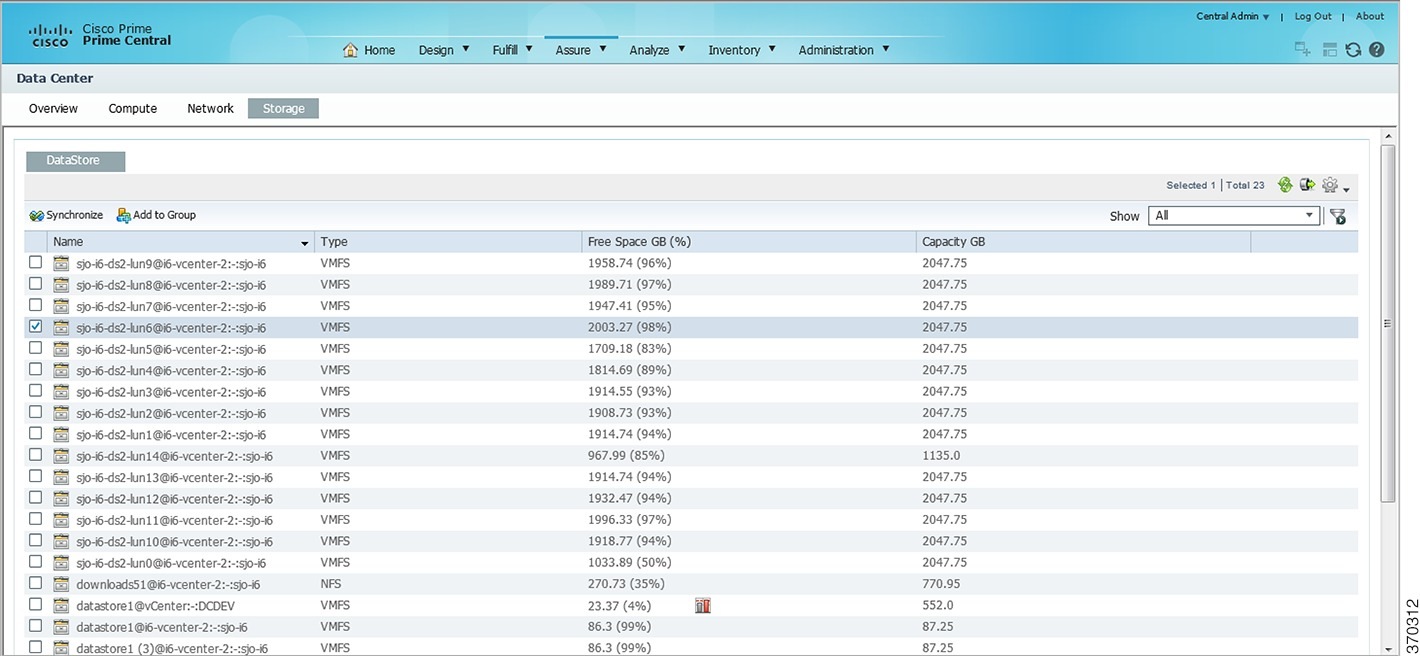
The following table describes the information provided in the Storage window.
| Column | Description |
|---|---|
|
Name |
Device name. |
|
Type |
Device type. |
|
Free Space GB (%) |
Percentage of available free space on a device. |
|
Capacity GB |
Total storage capacity of a device. |
Data Center Dashboards
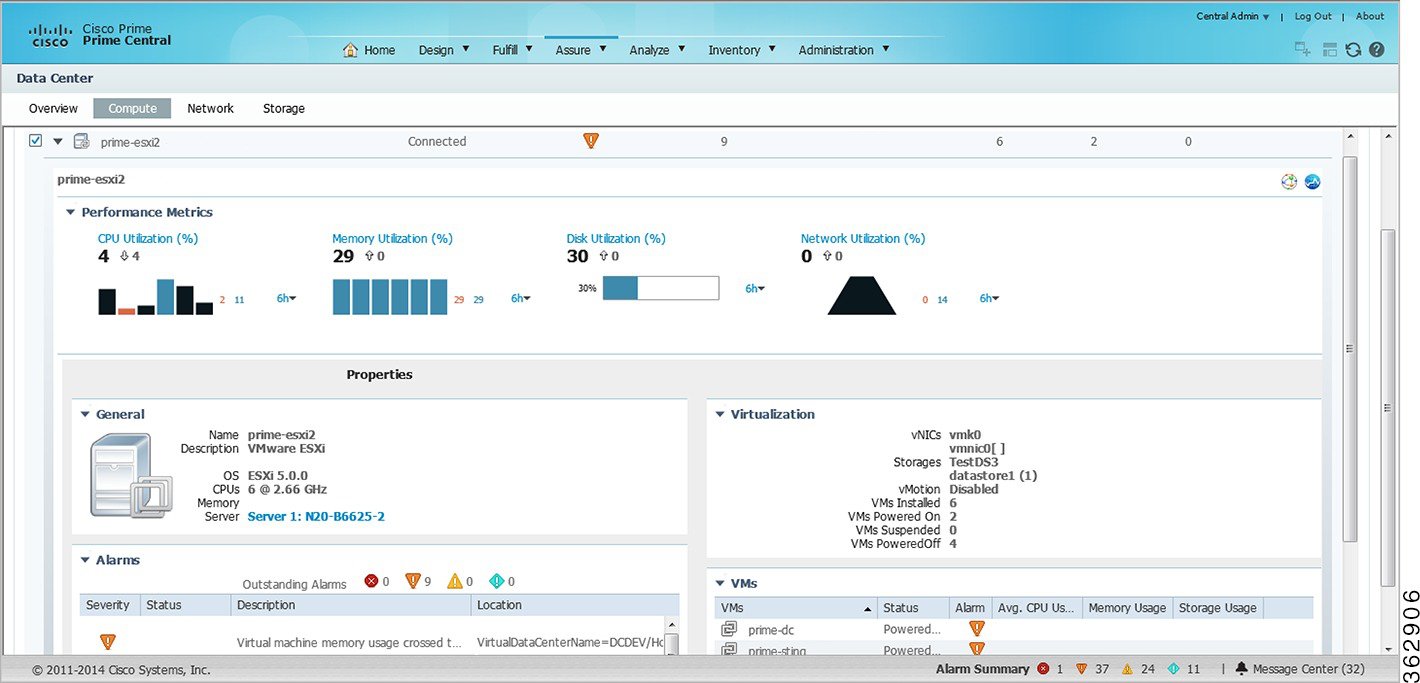
When monitoring your data center, you can view dashboards that provide a higher level of detail for the selected compute service resource or VPN (see the following figure). In addition to information that is specific to the type of resource you selected (such as the number of active virtual machines running on a hypervisor or the status of physical interfaces on a VPN), these dashboards provide alarm information and performance metric charts.
Note |
The Data Center dashboard for Prime Optical devices does not include performance metric charts. |
To access these dashboards:
Procedure
| Step 1 |
From the Prime Central menu, choose . |
| Step 2 |
Do one of the following:
|
| Step 3 |
Click the Compute Service, Hypervisor, or Cluster tab. |
| Step 4 |
To the left of the compute service resource or VPN name, click the Expand icon to open the corresponding dashboard. |
-
There are two sets of source icons. The icons in the top-right corner of the dashboard apply to the selected VPN, and the icons in the Properties table apply to the VRF selected in the VPN table.
-
If multiple instances of Prime Network and Prime Optical are running and you click an icon, the instance with the highest priority associated with the VPN or VRF is launched.
In the dashboard for a bare metal server or a hypervisor, the CPUs field shows the number of CPU cores at a given CPU speed. Bare metal servers can have multiple CPU listings that might appear to be identical, but are unique per CPU.
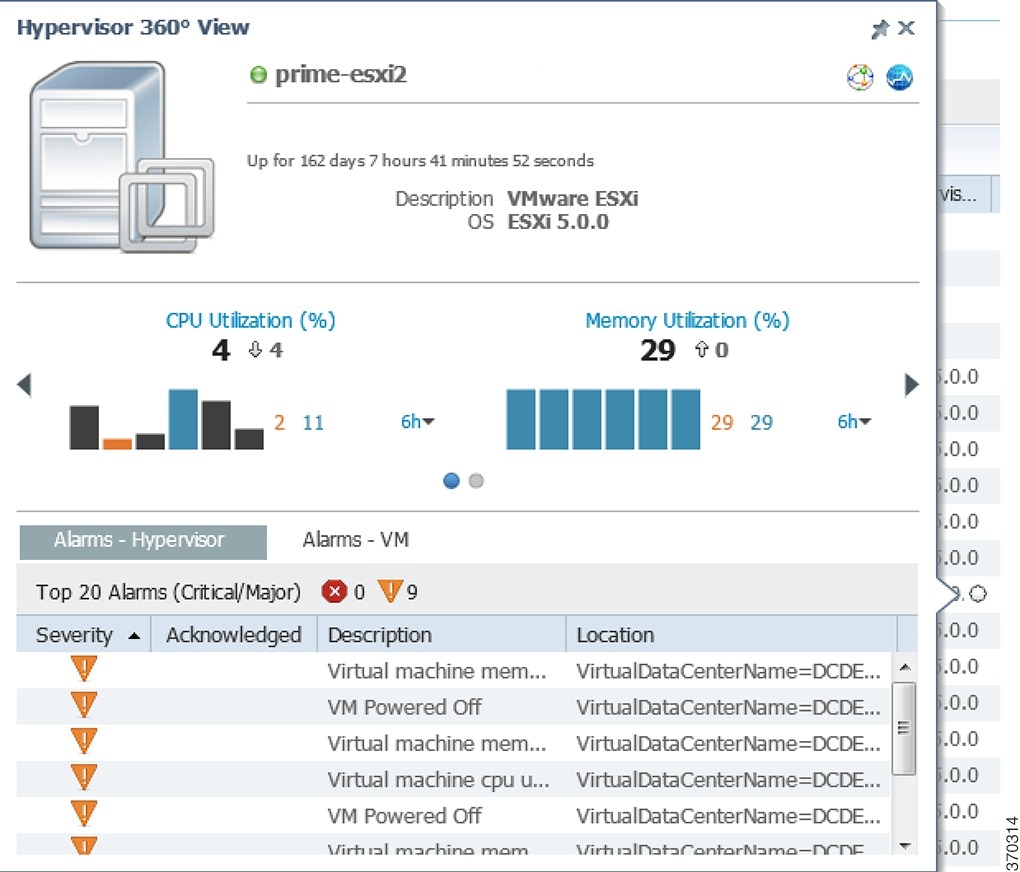
Data Center 360° View
To quickly view additional information for a compute service resource, VPN, or storage device, open its 360° view. To do so, place your cursor over the resource's table entry and then click the radio button in one of the following columns:
-
Name column (Compute Service pane, Hypervisor pane, Clusters pane, and Storage window)
-
Service Name column (Network window)
-
Hypervisor Type (when launching a hypervisor's 360° view in the Compute Service pane)
The information displayed will vary (depending on the resource type you select), but typically the 360° view provides alarm information and performance metric charts. You can cross-launch the application that manages the resource and retrieve even more detailed information for it by clicking the appropriate source icon.
Note |
|
Synchronizing Scopes and Inventory Data
Administrators can perform an on-demand, manual synchronization of user device scopes and inventory. When you first add a vCenter to Prime Network, you must manually synchronize the data center logical inventory to see the updates immediately in Prime Central. Alternately, you can wait for the automatic inventory synchronization, which occurs every two days. (Manual synchronization is not required when you add a virtual machine or ESX server to a vCenter that is already present in Prime Central.)
To synchronize scopes and inventory data:
Procedure
| Step 1 |
From the Prime Central menu, choose . The Data Center page opens. |
||
| Step 2 |
Click the Compute, Network, or Storage tab. |
||
| Step 3 |
Click the Synchronize icon.
|
||
| Step 4 |
In the Synchronize dialog box, do the following: |
||
| Step 5 |
In the top-right corner of the Data Center page, click the Refresh icon. The synchronized data is displayed. |
Setting the Lifecycle State and Priority for a Compute Service Resource
In the Compute Service pane, you can assign lifecycle states and priority values to resources that are associated with customers. Note that the values set for these parameters have no effect on how Prime Central manages the resources. Their purpose is to allow you to logically group resources and quickly identify the resources of a particular lifecycle state or priority when necessary. It is up to you to define what the various lifecycle states and priority values mean for your data center.
Procedure
| Step 1 |
From the Prime Central menu, choose . |
| Step 2 |
From the Data Center page, click the Compute tab. |
| Step 3 |
In the Compute Service pane, check the check box for the appropriate resources, and then click the Set Lifecycle and Priority icon. |
| Step 4 |
Select the lifecycle state you want to assign to the resources. |
| Step 5 |
Select the priority (P1 - P6) you want to assign to the resources. |
| Step 6 |
Confirm that the resources you selected are listed and then click Set. |
Performing a Contextual Cross-Launch to the Common Inventory Portlet
While monitoring your data center, you can perform a contextual cross-launch to the Common Inventory portlet and view detailed inventory information for a particular blade server.
Procedure
| Step 1 |
From the Prime Central menu, choose . The Data Center Overview window opens. |
||
| Step 2 |
Click the Compute tab. The Compute Service pane is displayed. |
||
| Step 3 |
Do one of the following:
|
||
| Step 4 |
To the left of the appropriate blade server or hypervisor, click the Expand icon to open the corresponding dashboard. |
||
| Step 5 |
From the General section, click the blade server's link. The Common Inventory portlet opens, displaying detailed inventory information for the selected blade server.
|
Adding Data Center Resources to Groups
You can add a compute service resource, VPN, or storage device to any of the static groups configured in the Group Management portlet (). See Adding a Group Member.
Associating Data Center Resources with Customers
Prime Central allows you to associate a compute service resource or VPN with a particular customer. See Associating Resources to Customers.
 Feedback