Cisco Prime Central 1.5.2 User Guide
Bias-Free Language
The documentation set for this product strives to use bias-free language. For the purposes of this documentation set, bias-free is defined as language that does not imply discrimination based on age, disability, gender, racial identity, ethnic identity, sexual orientation, socioeconomic status, and intersectionality. Exceptions may be present in the documentation due to language that is hardcoded in the user interfaces of the product software, language used based on RFP documentation, or language that is used by a referenced third-party product. Learn more about how Cisco is using Inclusive Language.
- Updated:
- October 13, 2016
Chapter: Managing Faults
- What Is Fault Management?
- Fault Management Terminology
- Alarm Processing
- Monitoring Affected Services and Customers
- Opening the Alarm Browser Portlet
- Information Displayed in the Alarm Browser Portlet
- Accessing Additional Alarm Information
- Viewing Alarms in the Alarm Summary
- Acknowledging or Deacknowledging an Alarm
- Clearing an Alarm
- Retiring an Alarm
- Adding Notes to an Alarm
- Resynchronizing Applications
- Sorting Columns
- Refreshing Data
- Finding Data
- Changing the Alarm Information Displayed
- Filtering Alarms Using the Quick Filter
- Filtering Alarms Using the Advanced Filter
- Creating and Editing Views
- Freezing and Unfreezing the Alarm Browser
- Configuring Email and SMS for Alarm Notifications
- Changing Alarm Browser Preferences
- Managing Prime Central Fault Sources
- Analyzing Fault Data
- Configuring the SNMP Gateway for NBI Integration
- Gateways and DSAs Used with Prime Central
Managing Faults
This section describes how Prime Central locates, diagnoses, and reports network problems.
 Note | Prime Central Fault Management uses a very limited version of the IBM Tivoli Netcool/OMNIbus technology. Some of the windows in the Alarm Browser and Alarm Report portlets have a Help button that launches the IBM Tivoli Netcool online help. See the Cisco license agreement for the limitations that apply. |
This section contains the following topics:
What Is Fault Management?
Fault management is the process of locating, diagnosing, and reporting network problems. This is important for increasing network reliability and effectiveness, and for increasing the productivity of network users. Fault management is more than just handling emergencies. It provides functions for managing problems with services and handling customer-facing service problems.
Efficient fault management can:
-
Save repair costs through efficient fault detection, location, and correction
-
Improve customer care through efficient trouble administration
-
Improve service availability and equipment reliability through proactive maintenance and through measurement, review, and corrective action
One responsibility of fault management is to detect faults. A piece of equipment, a transmission medium, a software module, or a database is said to be in a fault state if it cannot perform its intended function and meet all of the requirements placed on that function. The onset of a fault is called a failure event and is usually signaled by one or more alarm reports. The termination of a fault state is called a clear event.
Fault management is responsible for determining, from a variety of information sources, the root cause of a fault, and for its repair. In certain cases, the root cause of a fault might be in a connecting network. In such cases, fault management is responsible for reporting the problem through appropriate channels.
- Fault Management Terminology
- Alarm Processing
- Monitoring Affected Services and Customers
- Managing Prime Central Fault Sources
- Analyzing Fault Data
- Configuring the SNMP Gateway for NBI Integration
- Gateways and DSAs Used with Prime Central
Fault Management Terminology
In Prime Network, an alarm represents a scenario that involves a fault in the network, a managed element, or the management system. A ticket represents an attention-worthy root cause alarm. A ticket has the same type as the root cause alarm it represents, and it has a status, which represents the entire correlation tree.
In Prime Optical, an alarm represents a notification from a managed network element (NE) that a certain fault condition occurred. Alarms usually represent error conditions on NEs. Prime Optical does not use the term tickets. NEs managed by Prime Optical perform correlation and suppression and report only root cause alarms.
A ticket in Prime Network represents the same information as an alarm in Prime Optical.
Prime Central Fault Management uses the term alarm to mean a root cause fault condition on which the entire fault lifecycle can be performed.
Alarm Processing
Prime Network receives events (syslogs and traps) from network elements and performs the first level of alarm correlation. Prime Central Fault Management receives correlated alarms from Prime Network and alarms for Prime Optical and performs second-level, cross-domain alarm correlation and deduplication. Prime Central Fault Management provides an aggregated view of correlated and deduplicated alarms to network operation center (NOC) operators.
Note | Prime Central Fault Management does not retrieve alarm data for Prime Provisioning or Cisco InTracer. |
Prime Central Fault Management:
-
Receives alarms from Prime Optical and tickets from Prime Network.
-
Receives system alarms and threshold crossing alerts from Prime Performance Manager.
-
Normalizes the alarms and tickets to a common alarm representation to perform aggregation, deduplication, correlation, and enrichment.
-
Maintains all active alarms in the Fault Management database. The alarms are also copied from the Fault Management database to the Oracle database for archiving and historical reporting.
Alarm Aggregation
Alarm aggregation involves the following functions:
-
Receive alarms from Prime Optical-Java and CORBA probes use the CORBA northbound interface (NBI) to get and register for alarms from Prime Optical.
-
Receive tickets from Prime Network—SNMP probes use the trap forwarding interface to receive tickets, ticket updates, and ticket severity updates from Prime Network.
-
Use the Fault Management SNMP probe and the Prime Performance Manager trap forwarding interface to aggregate Prime Performance Manager alarms.
-
Normalize and persist received alarms—Probes perform normalization; the Fault Management component persists normalized alarms.
Alarm Deduplication
Prime Optical and Prime Network manage the same CPT devices and generate the same alarm conditions for CPT managed objects. The following table shows some of the alarm conditions that Prime Optical and Prime Network generate for the same managed objects, and for which Prime Central Fault Management performs deduplication.
The following example illustrates an alarm deduplication:
Prime Network Alarm
Alarm Correlation
Prime Central Fault Management correlates Layer 2 or Layer 3 alarms generated by Prime Network to the root cause that Prime Optical detects in the dense wavelength-division multiplexing (DWDM) optical layer. In Prime Central 1.5.2, cross-application correlation is limited to within the same CPT, meaning the root cause alarm and the correlated alarm are on the same CPT device.
Prime Central Fault Management performs correlation of the alarm conditions listed in the following table by Prime Optical and Prime Network.
Alarm Aging
Prime Central Fault Management uses the following alarm aging policy:
-
By default, cleared alarms are deleted from the Prime Central Fault Management database after 60 minutes.
-
Indeterminate and informational alarms that are not being used for service impact analysis or customer impact analysis are deleted after 1 day.
-
Warning alarms that are not being used for service impact analysis or customer impact analysis are deleted after 7 days.
-
Active alarms that do not meet the preceding criteria persist indefinitely in the database, unless a user clears them manually.
-
The Prime Central database mirrors and archives the Prime Central Fault Management database. When you delete an alarm from the Prime Central Fault Management database, it is deleted immediately. However, the Prime Central database retains the deleted alarm for 14 days, and then purges it.
Note
User can configure alarm retention period, to configure please refer Configuring Alarms Retention Period.
Monitoring Affected Services and Customers
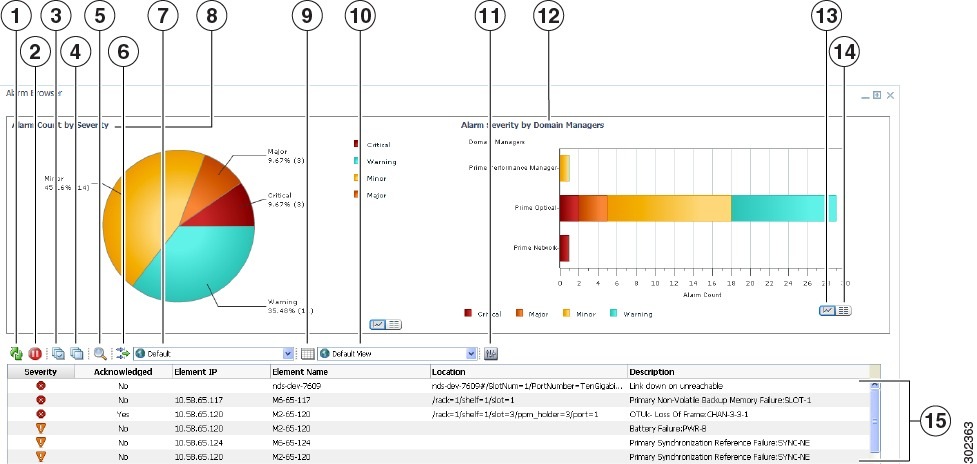
Prime Central provides an Alarm Browser portlet (see the following figure). Users with the Fault Management role and privileges can use the Alarm Browser to monitor and manage data about faults in the network. Information about alarms is displayed in the portlet according to filters and views:
- Opening the Alarm Browser Portlet
- Information Displayed in the Alarm Browser Portlet
- Accessing Additional Alarm Information
- Viewing Alarms in the Alarm Summary
- Acknowledging or Deacknowledging an Alarm
- Clearing an Alarm
- Retiring an Alarm
- Adding Notes to an Alarm
- Resynchronizing Applications
- Sorting Columns
- Refreshing Data
- Finding Data
- Changing the Alarm Information Displayed
- Filtering Alarms Using the Quick Filter
- Filtering Alarms Using the Advanced Filter
- Creating and Editing Views
- Freezing and Unfreezing the Alarm Browser
- Configuring Email and SMS for Alarm Notifications
- Changing Alarm Browser Preferences
Opening the Alarm Browser Portlet
To open the Alarm Browser portlet to display aggregated, deduplicated, and correlated active alarms:
| Step 1 | From the Prime Central menu,
choose
.
You must have the appropriate role and privileges to open the Alarm Browser. If not, the following message is displayed: You do not have access privileges to use the Fault Management component. Contact your administrator for access. |
| Step 2 | The first time you open the
Alarm Browser, you must accept the self-signed, untrusted security
certificates.
To accept the security certificates in Firefox, do the following: To accept the security certificates in Internet Explorer, do the following: |
| Step 3 | (Optional) You can replace the Prime Central certificates with your company’s signed, trusted certificates. See Managing the Self-Signed Certificates. |
Information Displayed in the Alarm Browser Portlet
The Alarm Browser portlet displays the following charts:
-
Alarms—Displays in pie chart format the total number of alarms of each severity (critical, major, minor, and warning) for all applications combined.
-
Alarms per Application—Displays in bar chart format the number of critical, major, minor, and warning alarms for individual applications.
-
The horizontal axis (x-axis) shows the alarm count.
The table on the bottom half of the portlet displays the following information by default.
The Alarm Browser's right-click menu options provide centralized alarm lifecycle management for the applications listed in the following table.
| Right-Click Menu Option | Supported by... | For More Information, See... | ||
|---|---|---|---|---|
|
— |
Prime Network | Prime Optical | Prime Performance Manager |
— |
|
Acknowledge |
Yes |
Yes |
Yes |
Acknowledging or Deacknowledging an Alarm |
|
Deacknowledge |
Yes |
Yes |
Yes |
Acknowledging or Deacknowledging an Alarm |
|
Clear |
Yes |
Yes 1 |
Yes |
Clearing an Alarm |
|
Retire |
Yes |
No |
Yes |
Retiring an Alarm |
|
Add to Journal |
Yes |
Yes |
Yes |
Adding Notes to an Alarm |
|
Resync Domain Managers |
Yes |
Yes |
Yes |
Resynchronizing Applications |
Note |
|
Cross-Application Alarm Management
When configured for Suite Mode, previous releases of Prime Central, Prime Network, Prime Optical, and Prime Performance Manager supported the following cross-application alarm management tasks from the Prime Central Fault Management GUI:
Starting with the latest release of these applications, you can also perform these tasks from Prime Network, Prime Optical, and Prime Performance Manager (again, when configured for Suite Mode).
Note | The Retire option is not supported by Prime Optical. |
In addition, you have the ability to attach a note to any of these tasks from both the Prime Central Fault Management GUI and NBI. Keep in mind that the applications handle notes differently. Prime Central, Prime Network, and Prime Optical store the notes and actions associated with an alarm as journal entries, logging the creation or modification date and the relevant user’s ID for each entry, whereas Prime Performance Manager stores a single note that can be modified as often as needed. Here are some other key differences in the way that the applications handle notes:
-
A journal entry with the appropriate action prefix is created for all alarm management tasks performed from the Prime Central Fault Management GUI or NBI. For example, acknowledging an alarm results in a journal entry prefixed with Acknowledge_Alarm:.
-
A journal entry is not created for any tasks (except for Add Notes) performed from Prime Network, Prime Optical, or Prime Performance Manager.
-
When you add a note to an alarm from Prime Network, Prime Optical, or Prime Performance Manager, the corresponding journal entry is not prepended with an action prefix.
-
In the alarm notifications sent by Prime Optical, there is no way to distinguish between notes generated in Prime Optical and notes generated in Prime Central. As a result, the journal entries for notes created in Prime Central for Prime Optical alarms are not prepended with an action prefix.
-
Unlike Prime Network and Prime Optical, Prime Performance Manager keeps only one note per alarm. Prime Central journals each alarm management action (such as acknowledging or clearing an alarm) that is performed on a Prime Performance Manager alarm, but maintains only one journal entry for each Prime Performance Manager alarm note. For example, when a note is generated by Prime Performance Manager, Prime Central creates a journal entry for that same note. If the note is later modified within Prime Performance Manager, Prime Central overwrites the previous journal entry with the new entry.
Note
Prime Performance Manager sends alarm note updates to Prime Central even if the updates are generated for alarm management actions carried out in Prime Central. As a result, it may appear that duplicate notes are listed in the Alarm Browser journal—this is normal. Prime Central maintains a journal entry for each alarm management action note it generates and a separate single journal entry for alarm notes generated by Prime Performance Manager.
For more information on notes, see Adding Notes to an Alarm.
Accessing Additional Alarm Information
From the Alarm Browser portlet, you can access more detailed information for a specific alarm by doing the following:
| Step 1 | Right-click an alarm and
choose
Device
Details. Depending on the alarm source, Prime Optical, Prime
Network, or Prime Performance Manager launches, allowing you to view detailed
alarm information at the application level.
| ||
| Step 2 | Right-click an
alarm and choose
Ticket
Details. Prime Network launches and displays additional information
for the ticket associated with the selected alarm. See the "Viewing Ticket
Properties" topic in the
Cisco Prime Network 4.1 User
GuideCisco Prime Network 4.3.2 User Guide for a description of
the information provided.
| ||
| Step 3 | Right-click an alarm in the table and choose Common Inventory. The Common Inventory portlet launches, where you can view detailed information about the device on which the selected alarm occurred. For more information, see What is Inventory Management?. | ||
| Step 4 | Right-click an alarm in the
table and choose
Correlated Alarms to view alarms that are correlated
to the selected alarm.
Prime Central identifies the relationship between a root cause alarm and its consequent alarms. It automatically correlates the consequent alarms as children of the root alarm. The Alarm Browser displays the root cause alarm, the aggregated severity of the alarm, and the severity of the root cause alarm. In addition, the Alarm Browser displays the time at which the original alarm was detected. | ||
| Step 5 | Right-click a service-impacting alarm in the table and choose Symptom Events to see which symptom events are affected by the service-impacting alarm. The filtered view shows the causal relationship between an event and the consequent events that occurred because of it. | ||
| Step 6 | Right-click an
alarm and choose
Subtending Events. The Subtending Events window
launches, listing all of the network events associated with the selected alarm
and providing information for those events.
| ||
| Step 7 | Either double-click an alarm or right-click an alarm and choose Information. The Alarm Status for Serial Number x dialog opens, showing additional fields that are parsed from the alarm. | ||
| Step 8 | Right-click an alarm and choose Journal. The Journal Information for Serial Number x dialog opens, listing all of the notes that have been created for the selected alarm. For more information about notes, see Cross-Application Alarm Management. |
Viewing Alarms in the Alarm Summary
At the bottom of the Prime Central home page, users with the Fault Management role and privileges can view a summary of the alarm status of the network. Intended as a quick reference, the Alarm Summary shows the total number of critical, major, minor, and warning alarms in the network—as do the charts in the Alarm Browser portlet.
You can change the rate at which the Alarm Summary refreshes automatically. Do the following:
| Step 1 | Click within the Alarm Summary area. | ||
| Step 2 | In the Alarm Summary Timer
dialog box, enter a refresh rate from 10 to 99,999 seconds. The default is 60
seconds.
| ||
| Step 3 | Click Update. The Alarm Summary refreshes at the rate you entered. | ||
| Step 4 | To stop the
Alarm Summary from refreshing, reopen the Alarm Summary Timer dialog box and
click
Stop. (If later you decide to restart the automatic
refresh, click
Start.)
If you refresh your web browser, or if you log out of Prime Central and log back in, the Alarm Summary refresh rate resumes at the default 60 seconds, even if previously you had changed the refresh rate or stopped it altogether. 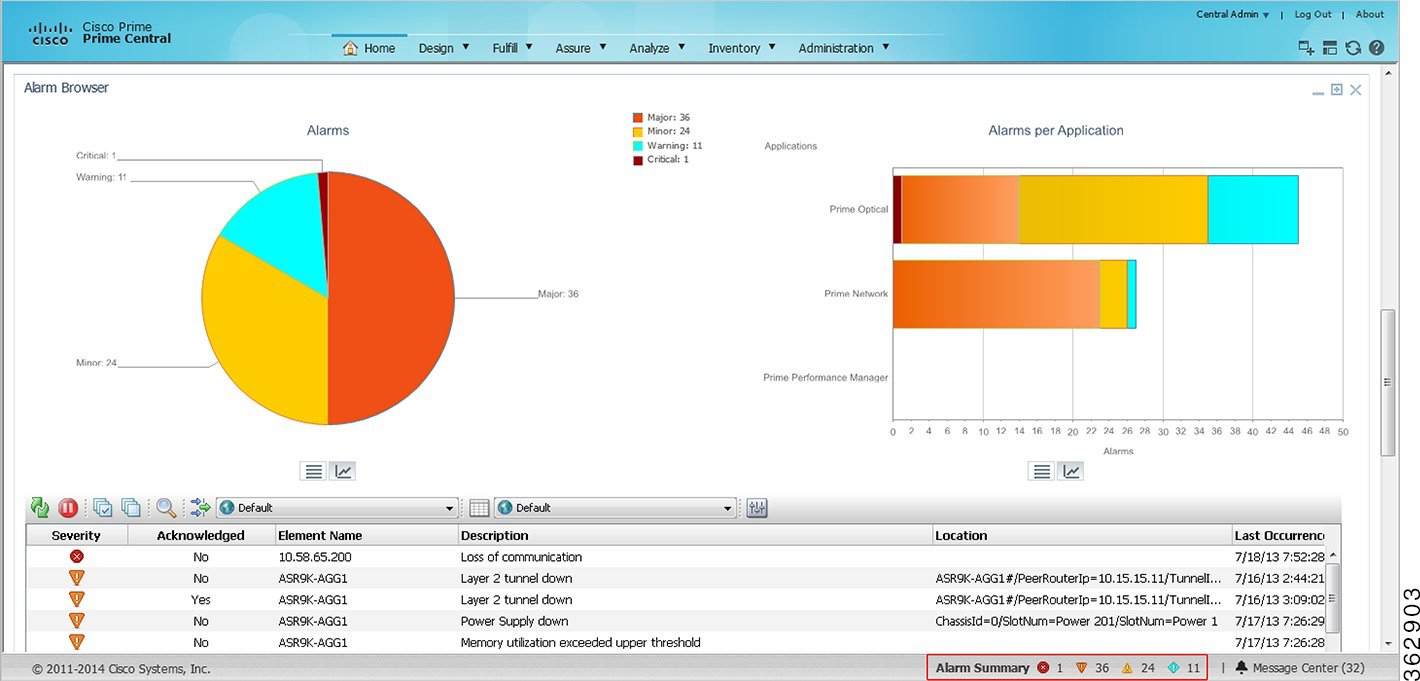 |
Acknowledging or Deacknowledging an Alarm
Acknowledging an alarm indicates that you are aware of the issue and are taking ownership of it. The acknowledged alarm remains visible in Prime Central.
To acknowledge or deacknowledge alarms within Prime Central and propagate the change back to the application:
| Step 1 | To acknowledge an alarm, right-click an alarm in the Alarm Browser and choose Acknowledge. |
| Step 2 | To deacknowledge a previously acknowledged alarm, right-click the alarm and choose De-acknowledge. |
| Step 3 | Refresh the Alarm Browser. The alarm is acknowledged (or deacknowledged) in Prime Central Fault Management, and the change propagates back to the application. |
Clearing an Alarm
Cleared alarms remain in the Prime Central database, but in the Clear state. You clear an alarm when the condition that caused it no longer exists. A cleared alarms means the alarm should no longer be considered a problem.
To manually clear an active alarm in Prime Central and propagate the change back to the application:
| Step 1 | Right-click one or more alarms in the Alarm Browser and choose Clear. |
| Step 2 | Refresh the Alarm Browser.
The alarm is cleared in Prime Central Fault Management, and the cleared
condition propagates back to the application.
When you try to clear certain Prime Optical alarms, the Prime Central Message Center might show the following error message for the clear operation: API_ERROR:clearAlarm operation failed. Reason: Unable to perform action on alarm IDs - alarm IDs not found. If the alarms exist in Prime Optical, you must clear them manually in Prime Optical. For a list of alarm categories that you must clear manually, see "EMS-Generated Alarms" in the Cisco Prime Optical 10.0 User Guide , Chapter 9, "Managing Faults." |
Retiring an Alarm
To retire a cleared alarm in Prime Central and delete that same alarm from the application:
Adding Notes to an Alarm
You can add and save your own alarm history information. You can maintain a journal for any alarm.
To add notes to an alarm and propagate the note back to the application:
| Step 1 | Right-click one or more alarms in the Alarm Browser and choose Add to Journal. The Journal dialog box opens. | ||
| Step 2 | Enter a note of up to 4000 characters. | ||
| Step 3 | Click Save to save the newly entered text and close the dialog box. The alarm note is saved in Prime Central and propagates back to the application. | ||
| Step 4 | To view an alarm note in
Prime Central:
|
Resynchronizing Applications
Complete the following procedure to resynchronize the alarm information provided by Prime Central and the Prime applications associated with it. Before you do so, be aware that:
-
This feature is available only for applications that support resynchronization with the Prime Central Fault Management component.
-
To initiate resynchronization from the right-click menu, at least one alarm must be reported in the Alarm Browser. If no alarms are present, initiate resynchronization by entering the following commands on the Fault Management server:
su - primeusr
fmctl resync
-
Resynchronization status is not indicated in either the Message Center or Audit Log.
| Step 1 | In the Alarm Browser, select an alarm and right-click it to open the right-click menu. |
| Step 2 | Select Resync Domain Managers. |
| Step 3 | To confirm that
resynchronization started and completed, enter the following command on the
Fault Management server to view the log file:
# tail -f ~/faultmgmt/log/resync.log |
Sorting Columns
Note the following when you sort columns in the Alarm Browser:
-
To sort a column in the Alarm Browser, click the column header once. The rows are sorted in ascending order.
-
To sort multiple columns, press Crtl and click the required column headers. The sorting importance of the columns is indicated in square brackets ([]) in the column header. To alternate the sorting of individual columns within the selection between ascending and descending order, keep Ctrl pressed and click the column headers. To unsort the columns, release Crtl and click any header from among the sorted columns. The previously sorted columns are unsorted; the column that you clicked is sorted in ascending order.
-
To lock a column, right-click the column header and click Lock Column. The column is moved to the left side of the portlet, and remains visible when you scroll horizontally. To unlock the column, right-click the column header and click Lock Column again.
Refreshing Data
The alarm list refreshes automatically at regular intervals to show all incoming alerts from the Prime Central integration layer. You can choose to refresh the alarm list manually between the configured intervals to view all the latest alerts at the current point in time.
To refresh the Alarm Browser manually between automatic refresh updates, click the Refresh icon in the toolbar.
Finding Data
Use the Find dialog box to search for specific text within the data in the Alarm Browser by doing the following:
Changing the Alarm Information Displayed
You can set what alarm information is displayed from the available data by editing the list view, or by selecting and applying a different view. You can also edit the filter criteria used by the current alarm list, or select a different filter to apply to the alarm list.
From the Alarm Browser, do any of the following:
-
To select a different view to apply to the alarm list, click the View drop-down list on the toolbar and select from the list of available views.
-
To edit the current view and change the columns displayed, click Edit Views. The View Builder opens, which you can use to edit the view. See Creating and Editing Views.
-
To select a different filter to apply to the alarm list, select an available filter from the Filter list.
For example, from the Filter list, choose Service Impact Alarms to view which customers and services are impacted by a specific alarm.
-
To edit the current filter, click Edit Filters. The Filter Builder opens. See Filtering Alarms Using the Advanced Filter.
Filtering Alarms Using the Quick Filter
You can use the quick filtering facility as a fast way of displaying alarms that match a selected criteria. You can filter for alarm data and display alarms that correspond to the value of a specific cell. For example, you can quickly display only those alarms that occurred at the same time as the selected alarm, or before the selected alarm.
| Step 1 | In the Alarm Browser portlet, right-click a cell that contains a value on which to base the quick filter. |
| Step 2 | From the right-click menu, choose Quick Filter and select a submenu option. |
| Step 3 | To remove quick filtering and restore the portlet to its original view of all alarms, right-click a cell again and choose Quick Filter > Off. |
Filtering Alarms Using the Advanced Filter
Network alarms typically create many alerts that are not of immediate importance to the personnel monitoring the system. Use advanced filters to control the alarm information that is displayed.
In the Alarm Browser, use the Filter drop-down list to filter alarm data by specific fields, such as Cleared Alarms.
To create and edit advanced filters for alarm data:
Note | At the time of Disaster Recovery (DR) configuration, you should create the views manually in the Standby machine. |
| Step 1 | In the Alarm Browser toolbar, click the Edit Filters icon. The Filter Builder opens. |
| Step 2 | Do one of the following: |
| Step 3 | Select the users to whom you want to grant access to the filter, and click OK. |
| Step 4 | Specify the
general properties for the filter:
|
| Step 5 | In the first row
of the
Basic tab, create a filter condition as follows:
|
| Step 6 | To add additional filter conditions, click +. You can add as many filter conditions as required. |
| Step 7 | Use the match options to specify how the filter conditions combine in aggregate: |
| Step 8 | (Optional) To preview the literal SQL WHERE clause output, click Advanced. |
| Step 9 | Click Metric and use the following fields to set the metric value: |
| Step 10 | Click Save and Close. |
Filter Builder Modes
You can use the following modes to create filters; the Filter Builder displays a tab for each mode after you click New Filter.
Basic Mode
Basic mode provides a set of lists and text fields that you use to specify the filter conditions. To build the conditions, select a field from the specified data sources, select a comparator, and enter a numeric data type or string data type value. The data type value is used as the filtering criterion used against the field. If you use basic mode to construct your filter, you can view the resulting SQL in the text field on the Advanced tab.
The fields in the Basic tab map to the following columns in the Alarm Browser default view:
| This field name: | ... Maps to this Alarm Browser column title: |
|---|---|
Advanced Mode
Provides a text field into which you can enter an SQL syntax. If you create a filter in advanced mode, it might not be possible to express the SQL syntax in the fields on the Basic tab. After you have saved a filter created in advanced mode, the Basic tab is removed for that filter.
Dependent Mode
This tab is displayed only for dependent filters. On this tab, use the Search fields to identify the filters that you want to use for the dependencies. After you have identified the required filters, move the filters from the Available filters list to the Selected dependencies list. In a dependent filter, the SQL WHERE statements of each filter are concatenated by using OR statements.
Metric Mode
A metric is an aggregate statistic that can be derived from the alerts that match a filter to display a useful figure; for example, an average, count, or sum of all field values. If a filter is displayed using a monitor box linked to an Alarm Browser, the metric information obtained from the set of alerts that match this filter is used for this display.
Creating and Editing Views
Use the View Builder to create and edit views that are dynamically applied to Alarm Browser data. The views determine what information is displayed from the available alarm data.
Note | At the time of Disaster Recovery (DR) configuration, you should create the views manually in the Standby machine. |
| Step 1 | In the Alarm Browser toolbar, click the Edit Views icon. |
| Step 2 | In the View Builder, do one of the following: |
| Step 3 | Select the users to whom you want to grant access to the view, and click OK. |
| Step 4 | Use the
following fields to set the general properties for the view:
|
| Step 5 | Select the
columns you want the Alarm Browser to display, and specify how those columns
are ordered.
|
| Step 6 | Click Save and Close. |
Freezing and Unfreezing the Alarm Browser
To take a snapshot of alarm information before it is changed by updates from the Prime Central integration layer, you can freeze all the fields on the Alarm Browser by doing the following:
| Step 1 | To freeze the fields, click
the
Freeze/Unfreeze icon in the Alarm Browser
toolbar.
The updates from the Prime Central integration layer are suppressed. |
| Step 2 | To unfreeze the fields and obtain updates from the Prime Central integration layer, click the Freeze/Unfreeze icon again. |
| Step 3 | (Optional) To force a refresh of the fields independently of the refresh rate, click the Refresh icon. |
Configuring Email and SMS for Alarm Notifications
You can configure Prime Central Fault Management to notify you whenever a critical or major alarm is generated. You can choose to receive either an email notification or a SMS notification sent to your cell phone.
Note | Prime Central Fault Management uses the Linux sendmail function under /usr/sbin, /sbin, /usr/lib, /bin, or /usr/bin to send email notification. |
| Step 1 | As the primeusr user, log in to the Prime Central portal with the primeusr password that you specified during installation. | ||
| Step 2 | Change directories to the installation-directory/faultmgmt folder. | ||
| Step 3 | Open the .primefmmailist file and
add both the email addresses and phone numbers that you want to receive alarm
notifications.
You can enter
multiple email addresses and phone numbers on a single line, separated by a
space. Entries for SMS message recipients should be formatted as follows:
recipient’s-mobile-number@carrier’s-SMS-gateway-address
| ||
| Step 4 | Save and close
the .primefmmailist file.
From: PRIMEFM User [mailto:primeusr@cisco.com]
Sent: Monday, February 17, 2014 7:21 AM
To: John Doe
Subject: Prime Central Fault Management Email
This message refers to node <node-ID>, which has the following problem:
Loss of communication

The severity is Critical
Sent by Cisco Prime Central Fault Management
# yum install sendmail sendmail-cf # yum install m4 |
Changing Alarm Browser Preferences
| Step 1 | In the Alarm Browser toolbar, click the Change preferences icon. |
| Step 2 | In the Preferences dialog
box, click the
Monitor Boxes tab and specify what information
is displayed by the monitor boxes on the Alarm Browser.
See Preferences Dialog Box for a description of the options you can set in the Preferences dialog box. |
| Step 3 | Click the Notifications tab and configure preferences for alert notifications when the alarm list is minimized. |
| Step 4 | Click the Flashing tab and specify alarm list preferences for flashing on receipt of new alerts. |
| Step 5 | Click the Event List tab and set other alarm list preferences. |
| Step 6 | Click Apply. |
| Step 7 | Click Save; then, click Close. |
Preferences Dialog Box
The following table describes the options you can set in the Alarm Browser’s Preferences dialog box.
| Option | Description |
|---|---|
|
Displays the highest severity of the alerts that match the filter. |
|
|
Displays the lowest severity of the alerts that match the filter. |
|
|
Displays a border around the monitor box in the color of the highest-severity alert that matches the filter. |
|
|
(Applicable only if you selected the Show Highest Severity option) Displays the highest-severity alert indicator in the color of the alert: for example, in red if the highest-severity alert is critical. |
|
|
(Applicable only if you selected the Show Lowest Severity option) Displays the lowest-severity alert indicator in the color of the alert. |
|
|
Choose the font and the font size for the text on the monitor boxes. |
|
|
Check this check box to receive notification of new, changed, or deleted alerts when the alarm list is minimized. |
|
|
Click this radio button to receive notification of new, changed, or deleted alerts on iconized desktop environments. An iconized desktop environment displays an icon when the alarm list is minimized. |
|
|
Click this radio button to always receive notification of new, changed, or deleted alerts. |
|
|
Select each option to indicate how a notification should occur: |
|
|
Displays each row of the alarm list with a background color that corresponds to the severity of the alarm. |
|
|
Displays the distribution summary bar, which shows the number of alerts that match each severity color. |
|
|
Choose the required date format. If you select Customize, enter a custom format. |
|
|
Specify how you want the alarm severity to be depicted in the Severity column: |
|
Customizing the Sound of Alarm Notifications
To set up the Play Sound option for audible notification:
| Step 1 | Prepare the sound file and place it in the following directory on your server: Fault-Management-installation-directory/faultmgmt/ tipv2/profiles/TIPProfile/installedApps/TIPCell/isc.ear/OMNIbusWebGUI.war/sounds. | ||
| Step 2 | In the Alarm Browser toolbar, click the Change preferences icon. | ||
| Step 3 | In the Notification area, check the Enabled check box. | ||
| Step 4 | In the Preferences dialog box, click the Notifications tab. | ||
| Step 5 | In the How
area, check the
Play
Sound check box.
| ||
| Step 6 | To change the
default sound to the one you uploaded in Step 1, specify the sound file in the
Play Sound field. Use the following format:
$(SERVER)/sounds/<sound-filename> For example: $(SERVER)/sounds/crash.wav | ||
| Step 7 | Click Apply. | ||
| Step 8 | Click Save; then, click Close. The change takes effect when a new notification appears. |
Managing Prime Central Fault Sources
From the Fault Source Management portlet, you can identify and keep tabs on the sources from which Prime Central gathers your network’s alarm and trap information. To view this portlet:
-
Ensure that you have have fault management privileges.
-
Add it to the Prime Central home page. See Adding a Portlet for instructions.
Note the following:
-
After a source has been registered with Prime Central’s fault management component, fault data for that source is displayed in the Alarm Browser portlet.
-
All instances of Prime Network, Prime Optical, and Prime Performance Manager associated with Prime Central are automatically added to the Fault Source Management portlet. Also, these are the only fault sources that cannot be modified or removed from the portlet.
Adding a Fault Source
| Step 1 | From the Fault Source
Management portlet, click
Add.
The Add New Fault Source dialog box appears. |
| Step 2 | Enter the appropriate
information and then click
OK.
Note the following:
See the Add New Fault Source Dialog Box topic for a description of the fields provided here. |
Editing a Fault Source
| Step 1 | From the Fault Source
Management portlet, select the fault source you want to modify and then click
Edit.
The Edit Fault Source dialog box appears. | ||
| Step 2 | Make the necessary changes and
then click
OK.
See the Add New Fault Source Dialog Box topic for a description of the fields provided here. |
Deleting a Fault Source
Add New Fault Source Dialog Box
The following table describes the fields that are provided in this dialog box.
|
Field |
Description |
|---|---|
|
Type |
Indicates the fault source type. |
|
Display Name |
Display name of the fault source, which is listed in the Fault Source Management portlet’s Source column. |
|
Host Name |
Hostname of the fault source. |
|
Instance Name |
Instance name of the fault source. |
|
(Optional) Description |
Description of the fault source. |
|
Version |
Version number of the fault source. |
|
(Optional) Patch |
Patch number of the fault source. |
|
Resync Support |
Indicates whether resync is enabled on the fault source. When this option is selected, the data for a particular fault source is automatically synchronized whenever you restart Fault Management. |
|
Resync URL |
URL of the fault source on which resync is enabled. |
|
User Name |
Username required to log in to the fault source. |
|
Password |
Password required to log in to the fault source. |
Analyzing Fault Data
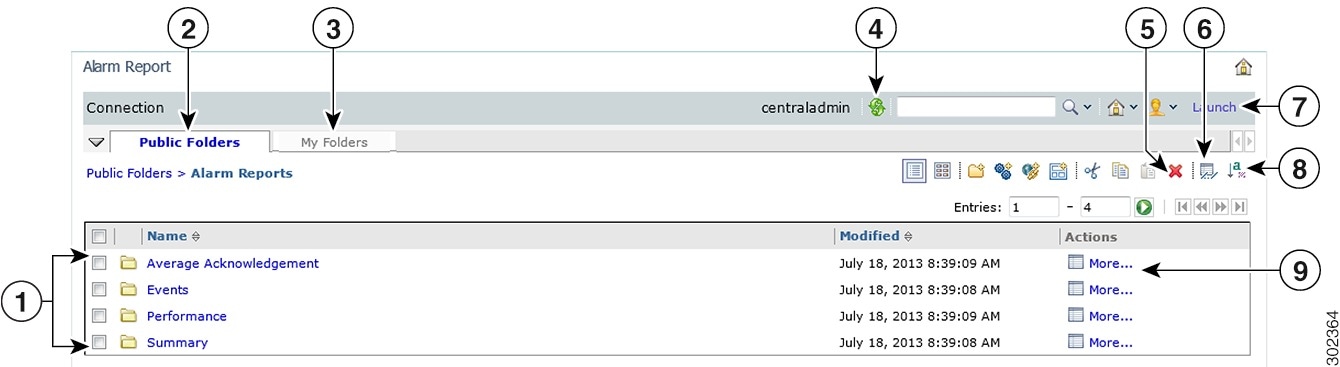
Prime Central provides an Alarm Report portlet (see the following figure) that lets you analyze fault data and help you make informed and timely decisions. Reports can be published to the portlet to ensure that everyone in your organization has accurate and relevant information when they need it.
The Alarm Report portlet shows an alarm summary and details grouped by node, severity, source application, and so on. Users with the appropriate role and privileges can view, customize, and schedule reports for active and historical alarms. You can export the generated reports in HTML, PDF, Excel, and PostScript format.
The Alarm Report portlet displays the following tabs:
-
Public Folders—Reports that are placed in Public Folders are of interest to and can be viewed by many users.
-
My Folders—You create personal folders and use them to organize reports according to your preferences. My Folders are accessible by you only when you are logged on.
Note | Report Studio is not supported in Prime Central 1.4. Also, the links under Launch menu are not supported. |
- Default Alarm Reports
- Opening the Alarm Report Portlet
- Creating a New Report
- Scheduling a Report
- Saving or Emailing a Report
- Setting Report Properties
- Specifying the Report Order
- Deleting a Report
- Configuring Alarms Retention Period
Default Alarm Reports
The Alarm Report portlet supports the predefined alarm reports shown in the following table.
| Report Name | Description | Purpose |
|---|---|---|
|
Shows a detailed breakdown of the average acknowledgment times within a network management environment for a specific user or group. |
Assists operators and managers in pinpointing and addressing discrepancies in acknowledgment rates across the network. |
|
|
Shows the average acknowledgment times within a network management environment for all users and groups. |
||
|
Displays a detailed report of all events of a selected node, class, manager, alert group, or severity over a user-specified time period. |
Assists operators and managers in providing coverage for specific criteria in event management. |
|
|
Displays the highest event-generating elements based on either node, class, manager, alert group, or severity over a user-specified time period. |
Helps identify low performance of a system or server over a period of time. |
|
|
Generates a supplementary drill-down report of a selected operator, group, class, or manager over a user-specified time period. |
Helps identify the most overloaded owner, class, or event manager, and assists in identifying performance issues. |
|
|
Generates a bar chart and supplementary drill-down table displaying the number of events handled by either an owner, class, or manager over a user-specified time period. |
||
|
Retrieves all journal entries associated with a specific node. |
Allows users to track journal or state change information about specific nodes and devices that have generated events. |
|
Opening the Alarm Report Portlet
 Tip | If multiple users plan to share the same browser instance and use the Alarm Report portlet, it is recommended that those users clear their browser cache before logging in to Prime Central. |
| Step 1 | From the Prime Central menu,
choose
.
If you do not have the appropriate role and privileges to open the Alarm Report, the following message is displayed: You do not have access privileges to use the Fault Management component. Contact your administrator for access. |
| Step 2 | The first time you open the
Alarm Report, you must accept the self-signed, untrusted security certificates.
To accept the security certificates in Firefox, do the following: To accept the security certificates in Internet Explorer, do the following: |
| Step 3 | (Optional) You can replace the Prime Central certificates with your company’s signed, trusted certificates. See Managing the Self Signed Certificates. |
Creating a New Report
| Step 1 | In the Alarm Report portlet,
click
.
Report Studio is a web product for creating reports that analyze corporate data according to specific information needs. |
| Step 2 | Click Create a new report or template. |
| Step 3 | Choose the desired report template; then, click OK. |
| Step 4 | Select the data items you
want to appear in your report:
|
| Step 5 | From the
Run menu, click one of the options to produce the
report in the format you want.
You can produce a report in HTML, PDF, CSV, various Excel formats, and XML. You cannot produce a report in CSV format if you have more than one query defined in the report unless the additional queries are used for prompts. The report runs. Once the report has finished running, you can run the report again in the same format or in a different format. If you run the report again in CSV or XLS format, the report will appear in a new browser window. |
Scheduling a Report
You can set up a schedule to run a report at a later time or at a recurring date and time.
If you no longer need a schedule, you can delete it. You can also disable it without losing any scheduling details. You can then enable the schedule at a later time.
| Step 1 | Drill down to the report for which you want to set up a schedule; for example, . |
| Step 2 | Click the Schedule - report name icon. |
| Step 3 | Specify the schedule parameters: |
| Step 4 | Click
OK.
A schedule is created and the report runs at the next scheduled time. |
| Step 5 | After clicking
OK, you might receive the following “Renew the credentials” prompt:
The user or password you provided is not valid. Provide valid credentials. If you enter the password you used to log in to Prime Central and click OK, the dialog box remains open, and the password field becomes blank. If you click OK without entering a password, or if you click Cancel, the dialog box closes, but the scheduled report fails to run because of a password authentication failure.
|
| Step 6 | The next time
you schedule a report, you do not have to rerun the updatePasswdForReporting.sh
script or renew your credentials. However, if
someone else runs the
script and changes the report scheduling password, you must renew your
credentials again. To do this:
|
Saving or Emailing a Report
You can distribute reports to other users by:
-
Saving them where other users can access the reports at their convenience, such as in the public folders. Public folders typically contain reports that are of interest to many users.
-
Sending them to users by email. This is especially useful if you want to share the report with a group of people who do not have access to the Alarm Report portlet.
Setting Report Properties
You can control the way a report appears and behaves by modifying its properties. To do so:
| Step 1 | Drill down to the report for which you want to set properties; for example, . |
| Step 2 | In the report’s Actions toolbar, click Set properties - report name. |
| Step 3 | Click the General tab and make any necessary changes to settings such as the report’s owner, display icon, and name. |
| Step 4 | Click the Report tab and set the default action that is taken on the report. |
| Step 5 | Click the Permissions tab and specify which users and groups have access to the report, as well as the actions they can perform on the content. |
| Step 6 | Click OK. |
Specifying the Report Order
You can specify the order of reports in the Alarm Report portlet. You might decide to organize reports by level of usage and place reports that you use daily at the top of the list.
By default, existing reports are sorted alphabetically. Reports added after the order is specified are shown at the end of the list.
| Step 1 | In the Alarm Report toolbar, click Order. |
| Step 2 | Select the reports in the “Shown in default order” list box and click the right-arrow button to move them to the “Shown first” list box. |
| Step 3 | Click the Up, Down, To top, and To bottom links to move the reports within the list. |
| Step 4 | Click OK. |
Deleting a Report
Configuring Alarms Retention Period
To retain the historical alarms data for more than 14 days (which is the default period), configure the retention period using Options section in Alarms Report portlet. After the configuration details are saved, the scheduler is triggered periodically to remove the historical data, which is older than the configured retention period.
Note |
|
Configuring the SNMP Gateway for NBI Integration
| Step 1 | As the primeusr user, log in to the Prime Central Fault Management server. | ||
| Step 2 | Copy the example properties file, NCO_GATE.props, from the $OMNIHOME/gates/snmp directory to the $OMNIHOME/etc directory. | ||
| Step 3 | In the
NCO_GATE.props file, change the values of the gateway-specific properties to
suit your operating environment. The gateway-specific properties are listed in
the following table:
| ||
| Step 4 | Enter the following command
to start the SNMP gateway:
nco_g_snmp & |
Gateway-Specific Properties
The following table lists the properties you can modify when configuring an SNMP gateway for NBI integration.
| Property Name | Command-Line Option | Description | ||
|---|---|---|---|---|
|
Gateway engine ID, which identifies the gateway as the source of the SNMPv3 traps. The default is 0x0102030405.
|
||||
|
Whether or not the gateway forwards alert updates to the ObjectServer. In effect, the original alert is duplicated but will include the updated data. The default is FALSE. |
||||
|
IP address and port to which the gateway forwards traps. The default is 127.0.0.1:162. If you are operating in an IPv4 environment, specify the location in IPv4 format as address:port. For example: If you are operating in an IPv6 environment, specify the location in IPv6 format, preceded by tcp6 or udp6, and followed by the port number, as tcp6|udp6:address:port. For example: |
||||
|
Object identifier (OID) for traps. The default is 1.3.6.1.4.1.1279 (an IANA-registered Private Enterprise Number). This property can also be defined as @NodeGroup to forward the value of the NodeGroup column in the status table. |
||||
|
Number of times that the gateway attempts to retry sending a message on failure. When this number is exceeded, the gateway stops sending messages to the port. The default is 5. |
||||
|
Security name for the gateway as defined in the configuration file of the receiver. The default is netcool.
|
||||
|
Authentication protocol that the gateway uses:
|
||||
|
Password used for authentication. The default is password.
|
||||
|
Password used for privacy. The default is password.
|
||||
|
Trap type value for the specific trap field in forwarded SNMP traps. The default is 1.
|
||||
|
Whether or not the gateway runs in store-and-forward mode. The default is FALSE.
|
||||
|
Name and location of the storage file that the gateway uses when operating in store-and-forward mode. The default is $OMNIHOME/var/NCO_GATE_snmp_.store. |
||||
|
Time (in seconds) that the gateway waits for a connection from an SNMP receiver before timing out. The default is 600.
|
||||
|
Trap type value of the generic trap field in forwarded SNMP traps.
|
Map Definition Files
Map definition files define how the gateway maps data from the SNMP gateway to the status tables in the Fault Management database. The default map definition file is $OMNIHOME/gates/snmp/snmp.map.
When an event is received, it is converted to the trap format defined in the CISCO-EPM-NOTIFICATION-MIB (see the following table). All OSS clients receive the same traps in the same trap format.
| Trap Name | Object ID | Type | Value |
|---|---|---|---|
|
cenAlarmVersion |
1.3.6.1.4.1.9.9.311.1.1.2.1.2 |
SnmpAdmin String |
MIB version number, in the format major version.minor version. Always set to 1.5.2. |
|
cenAlarmTimestamp |
1.3.6.1.4.1.9.9.311. 1.1.2.1.3 |
Timestamp |
Time when the alarm was raised. |
|
cenAlarmUpdatedTime stamp |
1.3.6.1.4.1.9.9.311.1.1.2.1.4 |
Timestamp |
Alarms persist over time and their fields can change values. The updated time indicates the last time a field changed and this alarm updated. |
|
cenAlarmInstanceID |
1.3.6.1.4.1.9.9.311.1.1.2.1.5 |
SnmpAdmin String |
Serial number that uniquely identifies each alarm. |
|
cenAlarmStatus |
1.3.6.1.4.1.9.9.311.1.1.2.1.6 |
Integer32 |
|
|
cenAlarmStatusDefinition |
1.3.6.1.4.1.9.9.311.1.1.2.1.7 |
SnmpAdmin String |
|
|
cenAlarmType |
1.3.6.1.4.1.9.9.311.1.1.2.1.8 |
Integer |
Not used. |
|
cenAlarmCategory |
1.3.6.1.4.1.9.9.311.1.1.2.1.9 |
Integer32 |
|
|
cenAlarmCategory Definition |
1.3.6.1.4.1.9.9.311.1.1.2.1.10 |
SnmpAdmin |
|
|
cenAlarmServer AddressType |
1.3.6.1.4.1.9.9.311.1.1.2.1.11 |
InetAddress Type |
Alarm server address type. Always set to IPv4. |
|
cenAlarmServerAddress |
1.3.6.1.4.1.9.9.311.1.1.2.1.12 |
InetAddress |
IP address of the application that sent the alarm. |
|
cenAlarmManaged ObjectClass |
1.3.6.1.4.1.9.9.311.1.1.2.1.13 |
SnmpAdmin String |
ID sent from the application to Prime Central Fault Management. |
|
cenAlarmManaged ObjectAddressType |
1.3.6.1.4.1.9.9.311.1.1.2.1.14 |
InetAddress Type |
Not used. |
|
cenAlarmManaged ObjectAddress |
1.3.6.1.4.1.9.9.311.1.1.2.1.15 |
InetAddress |
IP address of the application on which the alarm occurred. |
|
cenAlarmDescription |
1.3.6.1.4.1.9.9.311.1.1.2.1.16 |
OctetString |
Event message text. |
|
cenAlarmSeverity |
1.3.6.1.4.1.9.9.311.1.1.2.1.17 |
Integer32 |
|
|
cenAlarmSeverity Definition |
1.3.6.1.4.1.9.9.311.1.1.2.1.18 |
OctetString |
String representation of the alarm severity, in the format number,description; for example: 5,Critical |
|
cenAlarmTriageValue |
1.3.6.1.4.1.9.9.311.1.1.2.1.19 |
Integer32 |
Not used. |
|
cenEventIDList |
1.3.6.1.4.1.9.9.311.1.1.2.1.20 |
OctetString |
Not used. |
|
cenUserMessage1 |
1.3.6.1.4.1.9.9.311.1.1.2.1.21 |
SnmpAdmin String |
|
|
cenUserMessage2 |
1.3.6.1.4.1.9.9.311.1.1.2.1.22 |
SnmpAdmin String |
Service impacted by the alarm. |
|
cenUserMessage3 |
1.3.6.1.4.1.9.9.311.1.1.2.1.23 |
SnmpAdmin String |
Not used. |
|
cenAlarmMode |
1.3.6.1.4.1.9.9.311.1.1.2.1.24 |
Integer |
Always set to alert. |
|
cenPartitionNumber |
1.3.6.1.4.1.9.9.311.1.1.2.1.25 |
Unsigned32 |
Numerical ID of the service. |
|
cenPartitionName |
1.3.6.1.4.1.9.9.311.1.1.2.1.26 |
SnmpAdmin String |
Service type. |
|
cenCustomerIdentification |
1.3.6.1.4.1.9.9.311.1.1.2.1.27 |
SnmpAdmin String |
Name of the customer that is impacted by the alarm. |
|
cenCustomerRevision |
1.3.6.1.4.1.9.9.311.1.1.2.1.28 |
SnmpAdmin String |
ID of the customer that is impacted by the alarm. |
|
cenAlertID |
1.3.6.1.4.1.9.9.311.1.1.2.1.29 |
SnmpAdmin String |
Not used. |
Gateways and DSAs Used with Prime Central
The Prime Central base application includes two application probes and one Tier 1 SNMP gateway for connection to a third-party OSS.
-
Prime Central Tier 1 and Tier 2 gateways may not be used to connect Prime Central to third-party systems, such as third-party trouble ticketing systems, except through a separately purchased license.
-
Prime Central Tier 1 and Tier 3 data source adaptor (DSA) instances may only be used to connect to other Cisco applications or components embedded within Cisco applications, and in addition only if through a separately purchased license.
-
Prime Central may not be integrated with an OSS system using an MTOSI interface except through a separately purchased license.
-
Prime Central may not be integrated with Cisco applications except through a separately purchased license.
The following table lists the Tier 1 and Tier 2 gateways and the Tier 1 and Tier 3 DSAs that are available for use with Prime Central through a separately purchased license. For more information on Tier 1 gateways, see the IBM Tivoli Netcool OMNIbus Reference Guides.
| Gateway or DSA Name | Description |
|---|---|
|
The Gateway for SNMP Writer forwards Netcool alerts as Simple Network Management Protocol (SNMP) traps to an SNMP reader, such as the IBM Tivoli Netcool/OMNIbus SNMP probe. This allows Tivoli Netcool/OMNIbus to generate traps that are forwarded to another management platform such as SunNet Manager or HP Network Node Manager. The Gateway for SNMP Writer supports SNMP versions 1, 2, and 3. For more information, see the IBM Tivoli Netcool/OMNIbus SNMP Writer Gateway Reference Guide. |
|
|
The Gateway for Socket Writer uses a TCP connection to forward alerts. Any program that listens to that socket receives the alerts. For more information, see the IBM Tivoli Netcool/OMNIbus Socket Writer Gateway Reference Guide. |
|
|
The Gateway for Flat File Writer is a unidirectional gateway that reads alerts from the Netcool/OMNIbus object server, and writes the details to a flat file. The gateway can receive insert, update, and delete notification information from multiple tables within the object server. For more information, see the IBM Tivoli Netcool/OMNIbus Flat File Writer Gateway Reference Guide. |
|
|
The Gateway for ODBC uses a set of Open Database Connectivity (ODBC) libraries and drivers to enable data transfer between the Netcool/OMNIbus object server and Sybase, Microsoft SQL Server, Informix, DB2, and MySQL databases. For more information, see the IBM Tivoli Netcool/OMNIbus Gateway for ODBC Reference Guide. |
|
|
The Gateway for Message Bus receives Netcool events from the object server, uses a transformer module to transform them to an XML format that can be understood by a destination application, and uses a transport module to send the transformed events to the application. For more information, see the IBM Tivoli Netcool/OMNIbus Gateway for Message Bus Reference Guide. |
|
|
The Gateway for JDBC uses the standard Java Database Connectivity (JDBC) API to exchange alerts between Netcool/OMNIbus object servers and external databases. It communicates with the supported databases using Java Type 4 JDBC drivers supplied by the database vendors. The Gateway for JDBC can be used as a replacement for the Tivoli Netcool/OMNIbus Gateway for ODBC and the Tivoli Netcool/OMNIbus Gateway for Oracle. For more information, see the IBM Tivoli Netcool/OMNIbus Gateway for JDBC Reference Guide. |
|
|
The Gateway for Oracle writes selected alert details to Oracle databases. The gateway writes to three Oracle database tables (status, journal, and details) to record all transactions that occur within alerts selected by an object server reader. For more information, see the IBM Tivoli Netcool/OMNIbus Gateway for Oracle Reference Guide. |
|
|
The Gateway for HP OpenView Service Center is a fully functional bidirectional gateway. Alerts forwarded from the object server go through the gateway to form HP Service Center/Service Manager incident management tickets. Both systems work together to create and update alerts and tickets. For more information, see the IBM Tivoli Netcool/OMNIbus Gateway for HP OpenView Service Center/Service Manager Reference Guide. |
|
|
The Gateway for Remedy ARS is a help desk system that operates on UNIX platforms. The gateway converts alerts into Remedy help desk trouble tickets. Trouble tickets are updated according to a predefined mapping throughout the lifetime of the alert. For more information, see the IBM Tivoli Netcool/OMNIbus Gateway for Remedy ARS Reference Guide. |
|
|
The Gateway for TSRM provides bidirectional communication between Netcool/OMNIbus and Tivoli Service Request Manager (TSRM). The gateway supports TSRM version 7.1 (Fix Pack 4 and later), TSRM version 7.2, and IBM Maximo Base Services (MBS) version 7.1.1.5. For more information, see the IBM Tivoli Netcool/OMNIbus Gateway for TSRM Reference Guide. |
|
|
The LDAP DSA is used to access information stored in an LDAP server. This type of DSA is read-only. You cannot use Netcool/Impact to insert new LDAP data into the server data store. The LDAP DSA is built in and does not require additional installation or configuration. For more information, see the IBM Tivoli Netcool/Impact DSA Reference Guide. |
|
|
The socket DSA provides an interface between Tivoli Netcool/Impact and a socket server. For more information, see the IBM Tivoli Netcool/Impact DSA Reference Guide. |
|
|
The XML DSA reads and extracts data from any well-formed XML document. For more information, see the IBM Tivoli Netcool/Impact DSA Reference Guide. |
|
|
For more information, see the IBM Tivoli Netcool/Impact DSA Reference Guide. |
|
|
The JMS DSA sends and receives Java Message Service (JMS) messages from within a policy. The JMS DSA is installed automatically when you install Netcool/Impact. For more information, see the IBM Tivoli Netcool/Impact DSA Reference Guide. |
|
|
The web services DSA is a direct-mode DSA that Netcool/Impact automatically loads during application runtime. You do not have to start or stop this DSA independently of the application. The web services DSA is installed with Netcool/Impact and does not require additional installation or configuration. The web services DSA is compatible with its older versions in Netcool/Impact 3.x and 4.x. This means that your old IPL policies developed on Netcool/Impact 3.x and 4.x will continue to run without modification in the current version. The web services DSA provides support for WSDL version 1.1 and 2.0, and SOAP version 1.1. For more information, see the IBM Tivoli Netcool/Impact DSA Reference Guide. |
|
 Feedback