Cisco Open SDN Controller 1.2 Administrator Guide
Bias-Free Language
The documentation set for this product strives to use bias-free language. For the purposes of this documentation set, bias-free is defined as language that does not imply discrimination based on age, disability, gender, racial identity, ethnic identity, sexual orientation, socioeconomic status, and intersectionality. Exceptions may be present in the documentation due to language that is hardcoded in the user interfaces of the product software, language used based on RFP documentation, or language that is used by a referenced third-party product. Learn more about how Cisco is using Inclusive Language.
- Updated:
- September 16, 2015
Chapter: Monitoring Your System
Monitoring Your System
Open SDN Controller provides three pages that allow you to monitor the health and performance of your system: the Logs Dashboard page, the Metrics Dashboard page, and the Services Status page. The following topics describe these pages in more detail:
- Viewing the Logs Dashboard
- Viewing Controller Metrics
- Viewing Services Status
- Exporting Diagnostic Information
Viewing the Logs Dashboard
From the Logs Dashboard, you can view information for the events that have taken place in your system. To open the Logs Dashboard, select Logs from the main toolbar's Monitoring menu.

- Logs Dashboard Components
- Running Queries
- Creating Filters
- Setting the Logs Dashboard Timeframe
- Viewing Log Events
Logs Dashboard Components
The following table describes the components that make up the Logs Dashboard.
| Component | Description |
|
Toolbar |
From here, you can: |
|
Query field |
Allows you to search for event information that contains a particular string. See Running Queries for more information. |
|
Logs widget |
Lists the 500 latest events that have taken place in your system. See Viewing Log Events for more information. |
|
Log Summary widget |
Indicates the number of events (grouped by severity) that have taken place over the timeframe currently set for the Logs Dashboard. To determine the number of events that are of a specific severity, place your cursor over the corresponding bar in the graph. |
|
Component Summary widget |
Indicates the component or device from which events originated and the total number of events that took place on that component or device. |
|
Log Activity widget |
Visualizes the number of events that have occurred over the timeframe currently set for the Logs Dashboard. To determine the exact number of events that took place at a certain time, place your cursor over the corresponding bar in the timeline. |
Running Queries
By specifying a query, you can view only the event information that contains a particular string. To run a query, enter the appropriate text in the Query field and then click the Search icon or press the Enter key.
Note the following:
-
As you type the string you want to search for, Open SDN Controller suggests additional strings that you can select and search for instead.
-
To search for a string that is part of a longer string, enclose it within asterisks. For example, entering *Closeable* returned the results displayed in the following screenshot. If you had entered Closeable instead, only event information that contained Entries as a separate word would have been returned.
Figure 2. Sample Query 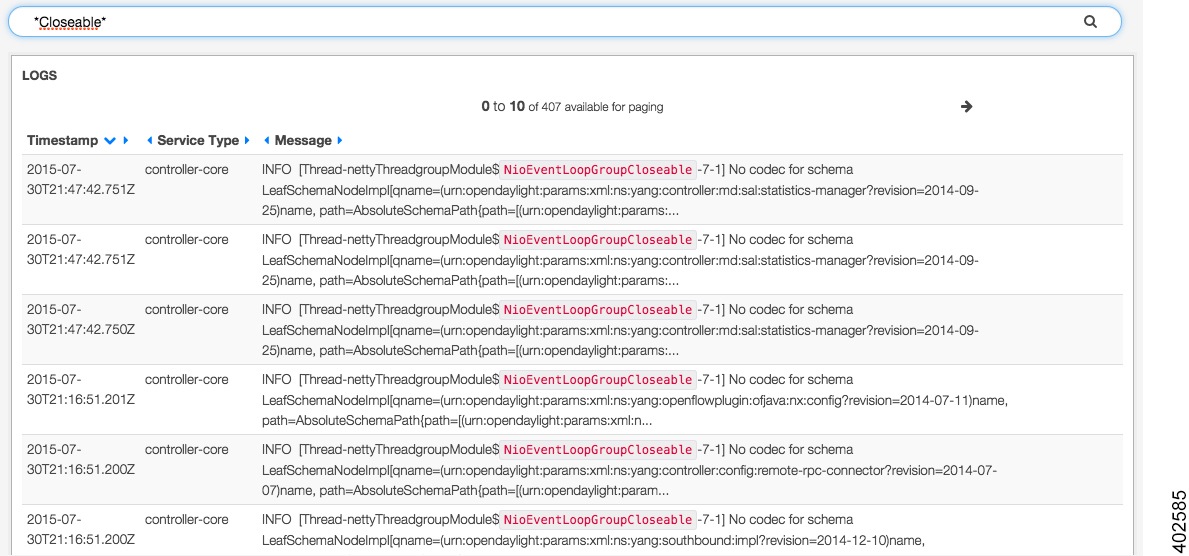
-
To clear the results of a query you have run, empty the Query field and then click the Search icon or press the Enter key.
-
You can toggle the Query field on and off by clicking the Query button.
Creating Filters
You can create a filter in two Logs Dashboard components: the Logs widget and the Component Summary widget.
From the Logs Widget
From the Component Summary Widget
Setting the Logs Dashboard Timeframe
Do one of the following to change the timeframe for which information is displayed in the Logs Dashboard:
-
At the top of the dashboard, click the link for the timeframe that is currently displayed in the dashboard. In the resulting drop-down list, select the desired timeframe. If you want to specify a timeframe that is not covered by one of the available options, select Custom, specify the desired timeframe, and then click Apply.

Note
From this drop-down list, you can also select Auto-Refresh and specify how often the information displayed by these graphs is automatically refreshed. To manually refresh this information, click the Refresh icon.
-
In the Log Activity widget, click the desired start time. While holding down the mouse, drag the cursor to the desired end time and then release the mouse.
Viewing Log Events
From the Logs widget, you can view a listing of the 500 most recent events that have taken place in your system.
To set which fields are displayed here:
| Step 1 | Click the table entry for any
event listed in the Logs table.
The table updates, displaying all of the fields that are available and their current values. |
| Step 2 | Locate the table entry for the field you want the Logs table to display. |
| Step 3 | From the Action column, click
the Toggle table column icon.
Repeat these steps to remove a field from the Logs table. |
Viewing Controller Metrics
From the Metrics Dashboard, you can view graphs that visualize the following performance metrics for the controller, helping you to identify any issues that require attention:
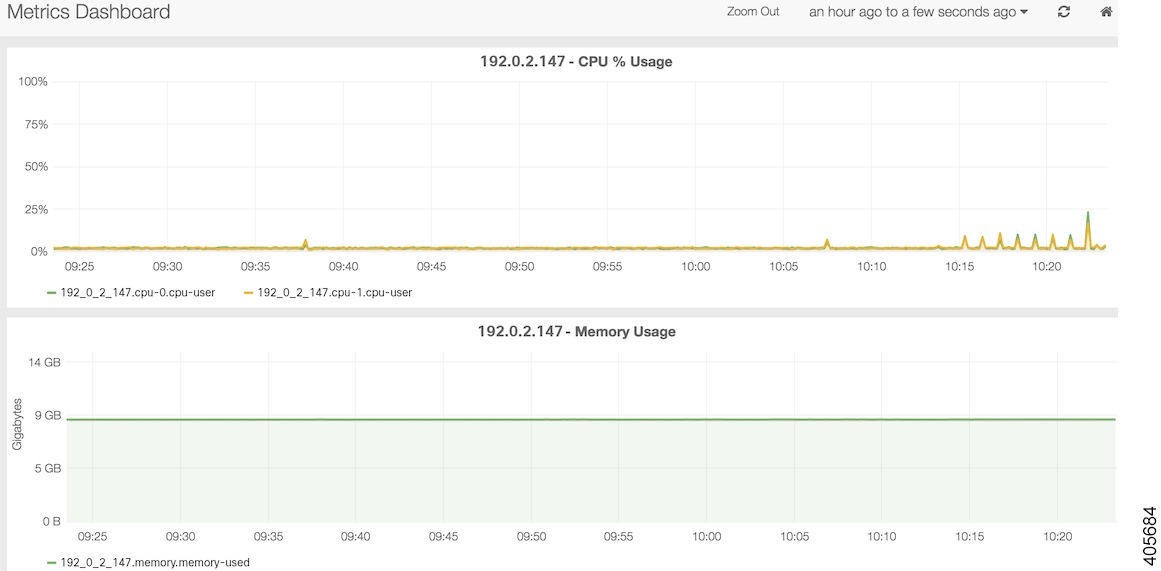
If multiple controller nodes are set up in your system, a separate graph for each of these metrics is displayed for each node.
To open the Metrics Dashboard, select Metrics from the main toolbar's Monitoring menu.
Do one of the following to change the timeframe for which information is displayed in the graphs:
-
From the top of the Metrics Dashboard, click Zoom Out. Every time you click this link, the timeframe these graphs cover is expanded.
-
To the right of the Zoom Out link, click the link for the timeframe that is currently displayed in the graphs. From the resulting drop-down list, select the desired timeframe. If you want to specify a timeframe that is not covered by one of the available options, select Custom, specify the desired timeframe, and then click Apply.
Note
From this drop-down list, you can also select Auto-Refresh and specify how often the information displayed by these graphs is automatically refreshed. To manually refresh this information, click the Refresh icon.
-
In any of the graphs, click the desired start time. While holding down the mouse, drag the cursor to the desired end time and then release the mouse.
Viewing Services Status
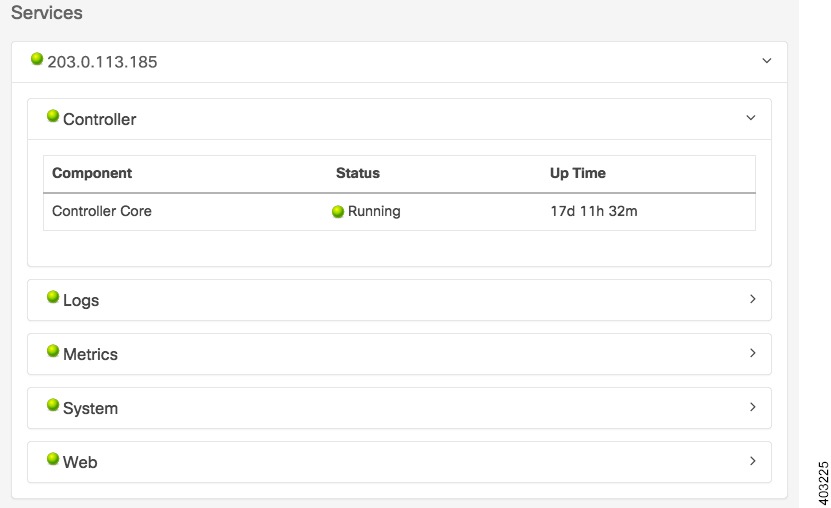
From the Services page, you can view the services installed on a controller node, determine whether they are running and, for the services that are running, see how long they have been up. By default, this page is open after you log into Open SDN Controller. To open the Services page when another page is open, select Services from the main toolbar's Monitoring menu.
Note | By default, the information displayed on this page is automatically refreshed every 10 seconds. |
Complete the following procedure to determine whether any services are down and need to be restarted.
-
View the ball icon that precedes a controller node's IP address. -
If necessary, click the node's link to bring up a listing of the five components for which service status is tracked: -
Click any component that is preceded by a red ball icon to view a listing of the services installed on that component.
-
Restart any services that are currently down (indicated by a red ball icon).
 Feedback