Setting Up the Application
Available Languages
Table Of Contents
Understanding NetFlow Interfaces
Understanding NetFlow Flow Records
Configuring NetFlow on Devices
For Devices Supporting Multi-Layer Switching Cache Running Cisco IOS
For Devices Supporting NDE v8 Aggregations Running Cisco IOS
For Devices Running Catalyst OS
For Devices That Support NDE Export From Bridged-Flows Statistics
For NAMs Located in a Device Slot
Configuring VACL on a WAN Interface
Configuring VACL on a LAN VLAN
Verifying NetFlow Data Source Information
Testing the Switch Community Strings
Creating Response Time Data Collections
Editing Response Time Data Collections
Deleting Response Time Data Collections
Setting Up the DiffServ Profile
Setting Up the Protocol Directory
Creating a NAM Trap Destination
Editing a NAM Trap Destination
Deleting a NAM Trap Destination
Setting Global Preferences for All Users
Setting Up the Application
These topics help you set up and configure the application:
•
Setting Up the Protocol Directory
•
Viewing Switch Parameters
Step 1
Step 2
The Switch System Information Table (Table 3-1) is displayed.
Testing SNMP on the Switch
To test SNMP communication on the switch, click Test.
The Switch Community String Test window is displayed with the results of the test. Click Close to close the window.
Setting Up Data Sources
There are currently three versions of the Catalyst 6500 NAM:
•
•
•
The WS-X6380-NAM and WS-SVC-NAM-1 devices can have only one active SPAN session. You can select a switch port, VLAN, EtherChannel, or NetFlow Data Export (NDE) as the SPAN source; however, you can select only one SPAN type. WS-SVC-NAM-2 devices and switch software support two SPAN destination ports.
Before you can monitor data, you must direct specific traffic flowing through a switch to the NAM for monitoring purposes using the methods described in the Methods of Directing Traffic table (Table 3-2).
The SPAN Sources Table (Table 3-3) describes the streams of traffic you can use as SPAN sources.
You can also use locally generated NDE records (the NDE source) as a packet stream to populate NAM collections. You can activate only a subset of the NAM collection types defined in the NDE Collection Types Table (Table 3-4)on the NDE source.

Note
Creating a SPAN Session
Creating a SPAN session on a switch running Catalyst OS software and a switch running Cisco IOS software are different. Unless otherwise stated, the following steps apply to switches running both Catalyst OS and Cisco IOS software.
Step 1
Step 2
The Active SPAN Sessions Dialog Box (Table 3-5) is displayed. The SPAN session directed to the NAM is selected by default, otherwise the first radio button is selected.
Step 3
The Create SPAN Session Dialog Box (Table 3-6) is displayed. Switch Port is the default for the SPAN Type.
Step 4
Step 5
The Active SPAN Sessions dialog box is displayed and the SPAN session is saved for switches running Catalyst OS software only.
Step 6
Note
Step 7
Editing a SPAN Session
You can only edit SPAN sessions that have been directed to the NAM.
Step 1
Step 2
The Active SPAN Sessions dialog box is displayed.
Step 3
The Edit SPAN Session Dialog Box(Table 3-7) is displayed.
Step 4
Deleting a SPAN Session
To delete a SPAN session, simply select it from the Active SPAN Session dialog box, then click Delete.
Understanding NetFlow Interfaces
To use a remote device as an NDE data source for the NAM, you must configure the remote device itself to export NDE packets to UDP port 3000 on the NAM. You might need to configure the device itself on a per-interface basis. An NDE device is identified by its IP address. By default the switch's local supervisor engine is always available as an NDE device.
You can define additional NDE devices by specifying the IP addresses and (optionally) the community strings. Community strings are used to upload convenient text strings for interfaces on the remote devices that are monitored in NetFlow records.
Distinguishing among different interfaces on the remote NDE devices is a feature in this release that allows you to arbitrarily bundle groups of interfaces on each remote NDE device into a conceptual data source instead of simply grouping all flows into the same collections.
If you try to distinguish every interface on every remote device (potentially in both directions separately), this action could result in a large, unmanageable number of data sources. By using conceptual data sources, you have complete flexibility to group all interfaces in all directions into a single conceptual data source.
You could also choose to create a separate conceptual data source for each interface on the device. In general, you can combine any number of "simple flow paths" to form a conceptual data source. Each simple flow path can consist of a single interface in the input direction, the output direction, or both directions.
The following restrictions apply to creating conceptual data sources and assigning flow paths to them:
•
•
•
Understanding NetFlow Flow Records
An NDE packet contains multiple flow records. Each flow record has two fields:
•
•
Note
In most cases, turning on NetFlow on an interface populates the NetFlow cache in the device with flows that are in the input direction of the interface. As a result, the input SNMP ifIndex field in the flow record has the ifIndex of the interface on which NetFlow was turned on. Sample NetFlow Network (Figure 3-1) shows a sample network configuration with a NetFlow router.
Figure 3-1 Sample NetFlow Network
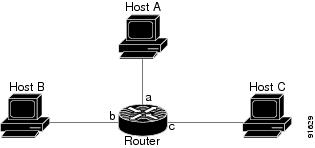
The Reporting Flow Records table (Table 3-8) lists the reported flows if NetFlow is enabled on interface a.
Table 3-8 Reporting Flow Records
a
b
Yes
a
c
Yes
b
c
No
b
a
No
c
a
No
c
b
No
Configuring NetFlow on Devices
The configuration commands for NetFlow devices to export NDE packets to the NAM are platform and device specific. The example configuration commands provided here are the ones most commonly found for devices running Cisco IOS or Catalyst OS. For more detailed information, see your device documentation.
For Devices Running Cisco IOS
Step 1
Prompt#configure terminalPrompt(config)#interface <type slot/port>Step 2
Prompt(config-if)#ip route-cache flowStep 3
Prompt(config)#ip flow-export destination <NAM IP address> 3000
For Devices Supporting Multi-Layer Switching Cache Running Cisco IOS
Step 1
Prompt(config)#mls nde sender version <version-number>
Note
Step 2
Prompt(config)#mls flow ip fullStep 3
Prompt(config)#mls nde senderStep 4
Prompt(config)#ip flow-export destination <NAM IP address> 3000
For Devices Supporting NDE v8 Aggregations Running Cisco IOS
Step 1
Prompt(config)#ip flow-aggregation cache <aggregation-type>Where aggregation-type can be:
•
•
•
•
Step 2
Prompt(config-flow-cache)#enableStep 3
Prompt(config-flow-cache)#export destination <NAM address> 3000
For Devices Running Catalyst OS
Step 1
Prompt>(enable) set mls nde version <nde-version-number>
Note
Step 2
Prompt>(enable) set mls flow fullStep 3
Prompt>(enable) set mls nde enableStep 4
Prompt>(enable) set mls nde <NAM address> 3000
For Devices That Support NDE Export From Bridged-Flows Statistics
Step 1
Prompt>(enable) set mls bridged-flow-statistics enable <vlan-list>Step 2
Prompt>(enable) set mls nde <NAM address> 3000
For NAMs Located in a Device Slot
If the NAM is located in one of the device slots, the device can be set up to export NDE packets to the NAM.
Step 1
Prompt>(enable) set mls nde version <nde-version-number>Step 2
Prompt>(enable) sel mls nde fullStep 3
Prompt>(enable) set mls nde enableStep 4
Prompt>(enable) set snmp extendedrmon netflow enable <NAM-slot>
Configuring VACL on a WAN Interface
Because WAN interfaces do not support the SPAN function, you must use the switch CLI to manually configure a VACL in order to monitor WAN traffic with the NAM. This feature only works for IP traffic over the WAN interface.
VACL can also be used of there is no available SPAN session to direct traffic to the NAM. In this case, a VACL can be set up in place of a SPAN for monitoring VLAN traffic.
Note
The following example shows how to configure a VACL on an ATM WAN interface and forward both ingress and egress traffic to the NAM. These commands are for switches running Cisco IOS version 12.1(13)E1 or higher. For LAN VACLs on Catalyst OS, the security Access Control List (ACL) feature can be used to achieve the same result. For more information on using these features, see your accompanying switch documentation.
Cat6509#config terminalCat6509(config)#access-list 100 permit ip any anyCat6509(config)#vlan access-map wan 100Cat6509(config-access-map)#map ip address 100Cat6509(config-access-map)#action forward captureCat6509(config-access-map)#exitCat6509(config)#vlan filter wan interface AM6/0/0.1Cat6509(config)#analysis module 3 data-port 1 capture allowed-vlan 1-4094Cat6509(config)#analysis module 3 data-port 1 captureCat6509(config)#exitTo monitoring egress traffic only, get the VLAN ID that is associated with the WAN interface by using the following command:
Cat6509#show cwan vlan
Hidden			VLAN		swidb->i_number					Interface
1017 94 ATM6/0/0.1
Once you have the VLAN ID, configure the NAM data port using the following command:Cat6509(config)#analysis module 3 data-port 1 capture allowed-vlan 1017To monitor ingress traffic only, replace the VLAN number in the capture configuration with the native VLAN ID that carries the ingress traffic. For example, if VLAN 1 carries the ingress traffic, you would use the following command:
Cat6509(config)#analysis module 3 data-port 1 capture allowed-vlan 1Configuring VACL on a LAN VLAN
For VLAN Traffic monitoring on a LAN, traffic can be sent to the NAM by using the SPAN feature of the switch. However, in some instances when the traffic being spanned exceeds the monitoring capability of the NAM, you might want to pre-filter the LAN traffic before it is forwarded. This can be done by using VACL.
The following example shows how to configure VACL for LAN VLAN interfaces. In this example, all traffic directed to the server 172.20.122.226 on VLAN 1 is captured and forwarded to the NAM located in slot 3.
Cat6509#config terminalCat6509#(config)#access-list 100 permit ip any anyCat6509#(config)#access-list 110 permit ip any host 172.20.122.226Cat6509#(config)#vlan access-map lan 100Cat6509#(config-access-map)match ip address 110Cat6509#(config-access-map)#action forward captureCat6509#(config-access-map)#exitCat6509#(config)#vlan access-map lan 200Cat6509#(config-access-map)#match ip address 100Cat6509#(config-access-map)#action forwardCat6509#(config-access-map)#exitCat6509#(config)#vlan filter lan vlan-list 1Cat6509#(config)#analysis module 3 data-port 1 capture allowed-vlan 1Cat6509#(config)#analysis module 3 data-port 1 captureCat6509#(config)#exitManaging NetFlow Devices
Before you can monitor NetFlow data, you must add the NetFlow devices to be monitored. The remote NDE device must also be confgured to export NDE packets to the NAM. For more information on configuring NetFlow on devices, see the "Configuring NetFlow on Devices" section or your accompanying device documentation. The following topics help you set up and manage the devices used for NetFlow monitoring:
Creating Devices
Once you create a NetFlow device, NetFlow data sources are automatically created for that device. You can use the Listening Mode to verify that NDE packets are active on these data sources. For more information on using the Listening Mode, see the "Using the Listening Mode" section.
Step 1
Step 2
The Active SPAN Sessions table is displayed.
Step 3
The NetFlow Devices table is displayed.
Step 4
The New Device dialog box appears.
Step 5
•
•
•
Editing Devices
Note
Step 1
Step 2
The Active SPAN Sessions table is displayed.
Step 3
The NetFlow Devices table is displayed.
Step 4
The Edit Device window appears.
Step 5
•
•
•
Deleting Devices
Step 1
Step 2
The Active SPAN Sessions table is displayed.
Step 3
The NetFlow Devices table is displayed.
Step 4
Note
Testing Devices
You can test the SNMP community strings for the devices in the Devices table. To test a device, select it from the Devices table, then click Test. The Device System Information Dialog Box (Table 3-9) is displayed.
Creating Custom Data Sources
A NetFlow data sources are automatically learned when you create a device in the Devices section. For more information on creating NetFlow devices, see the "Creating Devices" section. This option allows you to create custom data sources on NetFlow devices with specific interface information.
Step 1
Step 2
Step 3
The NetFlow Data Sources table is displayed.
Step 4
The following table shows the wizard used to create or edit a NetFlow data source.
Selecting a NetFlow Device
Step 1
Step 2
Step 3
Selecting the Interfaces
Step 1
Step 2

Tip
If no interfaces are listed, manually enter them in the Interface Index text box.
Step 3
The selected interfaces are displayed in the Selected Interfaces section.
•
•
Step 4
Special (0) Interface
NDE packets sometimes have NetFlow records reporting either (or both) input if-index and output if-index fields as being 0. This could be a result of one or more of the following reasons:
•
•
•
For more information, see the accompanying documentation for your NetFlow devcice.
Verifying NetFlow Data Source Information
Step 1
Step 2
•
•
Editing a Custom Data Source
Step 1
Step 2
Step 3
The NetFlow Data Sources table is displayed.
Step 4
The wizard used to edit NetFlow data sources is displayed.
Step 5
•
•
Deleting a Custom Data Source
To delete a data source, select it from the NetFlow Data Source table, then click Delete.
Note
Using the Listening Mode
The Listening Mode of the NAM allows you to view the IP addresses of devices sending NDE packets to the NAM, the number of NDE packets, and time that the last NDE packet was received. The NetFlow Listening Mode table only lists devices that the NAM currently receives NDE packets from.
Step 1
Step 2
Step 3
The NetFlow Listening Mode Table (Table 3-10) is displayed.
Step 4
Step 5
Note
Viewing Details from the NetFlow Listening Mode Table
Select the device from the table, then click Details.
The Device Details Window (Table 3-11) is displayed.
Adding a Device To Monitor
Step 1
The New Device Window is displayed.
Step 2
The new device is added to the NetFlow Devices table.
Testing the Switch Community Strings
Before the switch can send information to the NAM using SNMP, the switch community strings set in the NAM Traffic Analyzer must match the community strings set on the actual switch. The Switch Parameters dialog box displays the switch name, hardware, Supervisor software version, system uptime, location, and contact information.
The switch automatically sends the read and write community strings to the NAM. If the switch is running Catalyst OS, you can manually enter the switch SNMP community strings.
To set the community strings on the switch, use the switch CLI. For information on using the switch CLI, see Catalyst 6500 Series Switch and Cisco 7600 Series Internet Router Network Analysis Module Installation and Configuration Note Release 3.1.

Caution
Step 1
Step 2
The Switch Parameters dialog box is displayed.
Note
Step 3
The Switch Community String Test dialog box is displayed.
Setting Up Data Collections
Before you can monitor data, you must set up the data collections in the Monitor option of the Setup tab. For information on data collections, see the "Overview of Data Collection and Data Sources" section on page 4-2. There are options for:
•
Monitoring Core Data
You can enable or disable individual core data collections on each available data source. The following core collections are available:
•
•
•
•
•
•
•
•
Note
Note
Step 1
Step 2
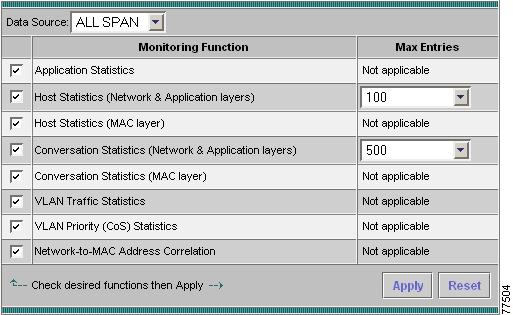
The Core Monitoring Functions Dialog Box (Figure 3-2) is displayed.
Figure 3-2 Core Monitoring Functions Dialog Box
Step 3
Step 4
Step 5
Step 6
•
•
Enabling Mini-RMON Collection
Enabling mini-RMON on the switch Supervisor allows you to monitor port statistics data from each switch port. You must enable mini-RMON in privileged mode from the CLI. To enable mini-RMON, do one of the following:
For Switches Running Catalyst OS
Enter the set snmp rmon enable command.
For Switches Running Cisco IOS
You must enable mini-RMON on each individual interface.
Enter the following commands:
Supervisor name(config) #interface interface-nameSupervisor name(config-if) #rmon collection stats collection-control-index owner monitorSupervisor name(config-if) #endwhere:
•
•
been used.
Note
Monitoring Voice Data
When you enable monitoring for voice data, the results are exclusively available through the NAM Traffic Analyzer. You can use the Monitor tab to view the collected voice data. For more information on viewing the voice data, see the "Viewing Voice Data" section on page 4-19.
The voice monitoring option is on by default, however to monitor voice data, you must enable voice monitoring in the NAM Traffic Analyzer application.
Step 1
Step 2
The Core Monitoring Functions table is displayed.
Step 3
The Voice Monitor Setup Dialog Box(Table 3-12) is displayed.
Step 4
Note
Step 5
•
•
Monitoring Response Time Data
You can monitor response time to collect the response time between a client and a server. You can enable or disable response time monitoring on individual collection data sources. When you enable response time monitoring, the application supplies the default collection parameters.
The response time monitoring option is on by default; however to monitor response time data, you must enable response time monitoring in the NAM Traffic Analyzer application.
These topics help you set up and manage response time monitoring:
•
•
•
Creating Response Time Data Collections
Step 1
Step 2
The Core Monitoring Functions table is displayed.
Step 3
The Response Time Monitoring Setup table is displayed.
Step 4
The Response Time Monitoring Setup, Collection Configuration Dialog Box (Table 3-13) is displayed.
Step 5
Step 6
•
•
Editing Response Time Data Collections
Step 1
Step 2
The Core Monitoring Functions table is displayed.
Step 3
The Response Time Monitoring Setup table is displayed.
Step 4
The Response Time Monitoring Setup, Collection Configuration Dialog Box(Table 3-13) is displayed.
Step 5
•
•
Deleting Response Time Data Collections
To delete one or more response time data collections, simply select the data collections from the Response Time Monitoring Setup table, then click Delete.
Monitoring DiffServ Data
Differentiated services monitoring (DSMON or DiffServ) is designed to monitor the network traffic usage of differentiated services code point (DSCP) values.
To monitor DiffServ data, you must configure at least one aggregation profile and one or more aggregation groups associated with each profile. For more information on configuring an aggregation profile, see the "Creating a DiffServ Profile" section.
Step 1
Step 2
The Core Monitoring Functions table is displayed.
Step 3
The DiffServ Monitor Setup Dialog Box(Table 3-14) is displayed.
Step 4
Step 5
•
•
Setting Up the DiffServ Profile
A DiffServ profile is a set of aggregation groups that can be monitored as a whole. After you create the proper profile(s), you can enable DiffServ collection. For more information on setting up DiffServ collections, see the "Monitoring DiffServ Data" section.
These topics help you set up and manage the DiffServ profile:
Creating a DiffServ Profile
Step 1
Step 2
The Core Monitoring Functions table is displayed.
Step 3
The DiffServ Monitor Profile Dialog Box is displayed.
Step 4
The DiffServ Profile Setup Dialog Box (Table 3-15) is displayed.
Step 5
Step 6
•
•
Editing a DiffServ Profile
Step 1
Step 2
The Core Monitoring Functions table is displayed.
Step 3
The DiffServ Monitor Profile Table is displayed.
Step 4
The DiffServ Profile Setup Dialog Box (Table 3-15) is displayed.
Step 5
•
•
Deleting a DiffServ Profile
To delete one or more DiffServ profiles, simply select the profiles from the DiffServ Monitor Profile table, then click Delete.
Setting Up the Protocol Directory
The Catalyst 6500 NAM contains a default set of protocols to be monitored. You can edit and delete protocols from the RMON2 protocol directory table on the NAM.
These topics help you manage the protocol directory:
Creating a Protocol
Step 1
Step 2
The Core Monitoring Functions table is displayed.
Step 3
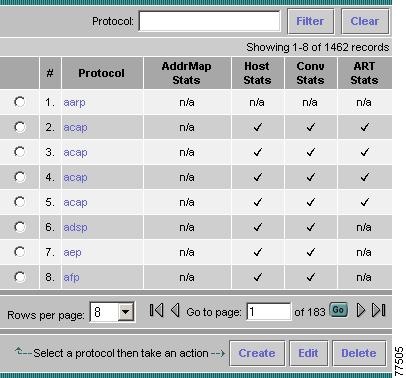
Protocol Directory Table (Figure 3-3) is displayed.
Figure 3-3 Protocol Directory Table
Step 4
The Create New Protocol dialog box is displayed.
Step 5
The New Protocol Parameters Dialog Box (Table 3-16) is displayed.
Step 6
Step 7
•
•
Tip
Editing a Protocol
Note
Step 1
Step 2
The Core Monitoring Functions table is displayed.
Step 3
The Protocol Directory table is displayed.
Step 4
The Edit Protocol Dialog Box (Table 3-17) is displayed.
Step 5
Step 6
•
•
•
Tip
•
Deleting a Protocol
To delete a protocol, simply select it from the Protocol Directory table, then click Delete.
Tip
Setting Alarm Thresholds
You can set up alarm thresholds on the NAM by defining threshold conditions for the following monitored variables on the NAM:
•
•
•
•
•
•
•
•
•
•
These topics help you set up and manage alarm threshold settings:
•
Setting NAM MIB Thresholds
NAM MIB thresholds are values you set that trigger alarms. Thresholds can be set on network hosts, MAC-layer hosts, network conversations, and MAC-layer conversations.
Selecting NAM MIB Variables
Step 1
Step 2
Step 3
Step 4
Step 5
Selecting NAM MIB Parameters
Step 1
Step 2
The New Alarm Dialog Box(Table 3-18) is displayed.
Step 3
Step 4
•
•
Viewing Alarm Details from the NAM MIB Thresholds Table
To view details of a specific alarm from the NAM MIB Thresholds table, select the radio button, then click Details. The Alarms Details Table (Table 3-19) is displayed.
Editing a NAM MIB Threshold
Step 1
Step 2
The Thresholds table is displayed.
Step 3
The Edit Alarm dialog box is displayed.
Step 4
Step 5
•
•
Deleting a NAM MIB Threshold
To delete a NAM MIB threshold, simply select it from the Alarms table, then
click Delete.Setting Voice Thresholds
Voice threshold events can be logged locally on the NAM or sent to remote syslog hosts. For information on setting up syslogs, see the "Setting Up the Syslog" section.
Step 1
Step 2
The Thresholds table is displayed.
Step 3
The Voice Alarms Dialog Box (Table 3-20) is displayed.
Step 4
Step 5
•
•
Setting Up the Syslog
Syslogs are created for MIB threshold events, voice threshold events, or system alerts. The NAM maintains two syslog files, one for logging RMON threshold events (for MIB and voice threshold events) and one for logging local NAM system alerts.
You can specify whether syslog messages should be logged locally on the NAM, on a remote host, or both. You can use the Catalyst 6500 NAM Traffic Analyzer to view the local NAM syslogs.
For information on viewing the syslogs, see "Viewing Alarms." You can use a standard text editor to view syslogs on remote hosts.
Step 1
Step 2
The Thresholds table is displayed.
Step 3
The Syslog Dialog Box (Table 3-21) is displayed.
Step 4
Step 5
•
•
Setting Switch Thresholds
You can configure RMON thresholds in the switch mini-RMON MIB. You can specify only variables from the etherStatsTable in the mini-RMON MIB to monitor for threshold-crossing conditions.
These topics help you set up and manage switch thresholds:
Creating Switch Thresholds
Step 1
Step 2
The Thresholds table is displayed.
Step 3
The Switch Threshold Alarms dialog box is displayed.
Step 4
The New Switch Alarm Dialog Box(Table 3-22) is displayed.
Step 5
•
•
Note
Editing Switch Thresholds
Step 1
Step 2
The Thresholds table is displayed.
Step 3
The Switch Threshold Alarms dialog box is displayed.
Step 4
The Edit Alarm dialog box is displayed.
Step 5
•
•
Deleting Switch Thresholds
To delete an existing switch threshold alarm, simply select it from the Switch Threshold Alarms table, then click Delete.
Setting NAM Trap Destinations
Traps are used to store alarms triggered by threshold crossing events. When an alarm is triggered, you can trap the event and send it to a separate host.
These topics help you set up and manage NAM traps:
•
•
•
Creating a NAM Trap Destination
Step 1
Step 2
The Thresholds table is displayed
Step 3
The Traps dialog box is displayed.
Step 4
The Create Trap Dialog Box (Table 3-23) is displayed.
Step 5
Step 6
•
•
Editing a NAM Trap Destination
Step 1
Step 2
The Thresholds table is displayed
Step 3
The Traps dialog box is displayed.
Step 4
The Edit Trap dialog box is displayed.
Step 5
Step 6
•
•
Deleting a NAM Trap Destination
To delete an existing trap, simply select it from the Traps table, then click Delete.
Setting Global Preferences for All Users
Global preferences settings apply to all users of the NAM and determine how data displays are formatted.
Step 1
Step 2
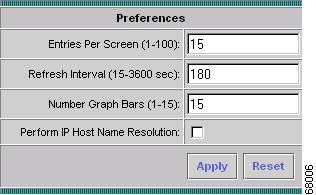
The Preferences Dialog Box (Figure 3-4) is displayed.
Figure 3-4 Preferences Dialog Box
Step 3
Step 4
•
•
 Feedback