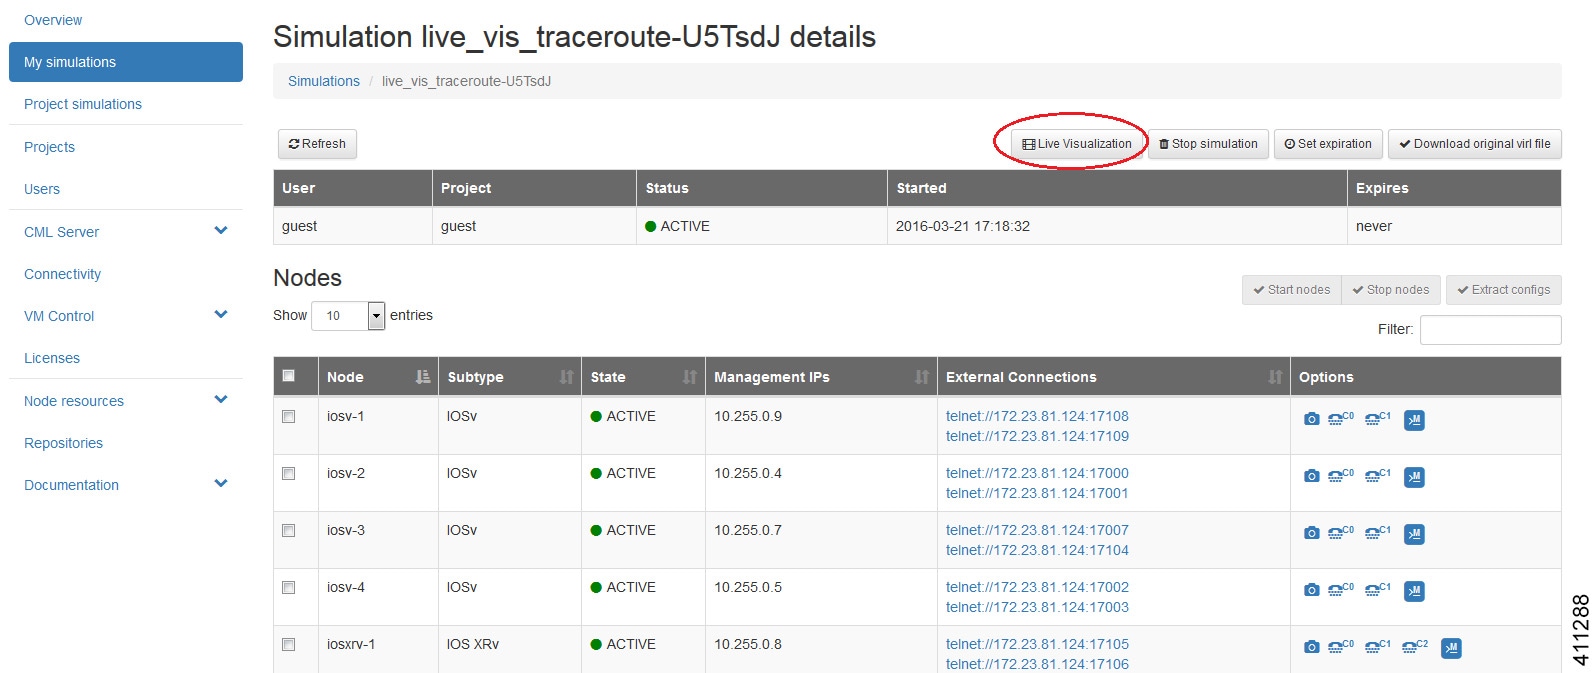
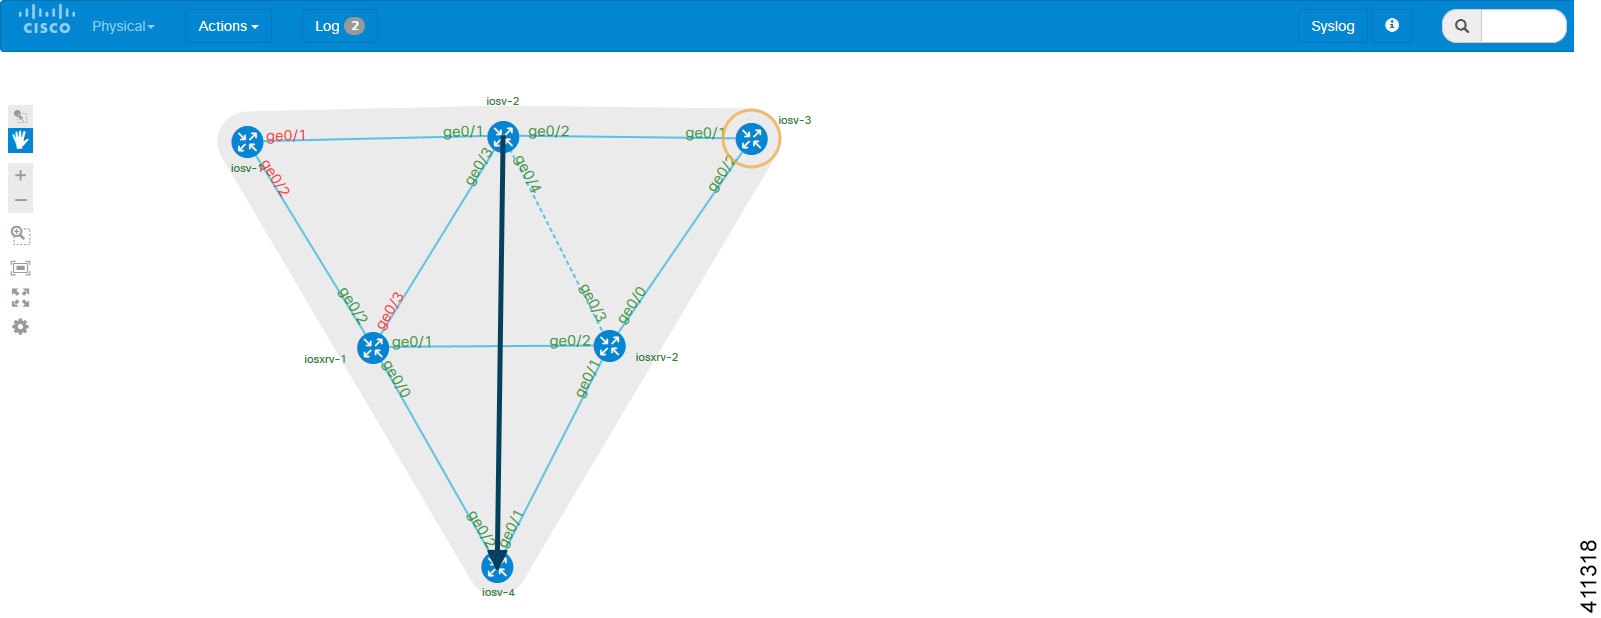
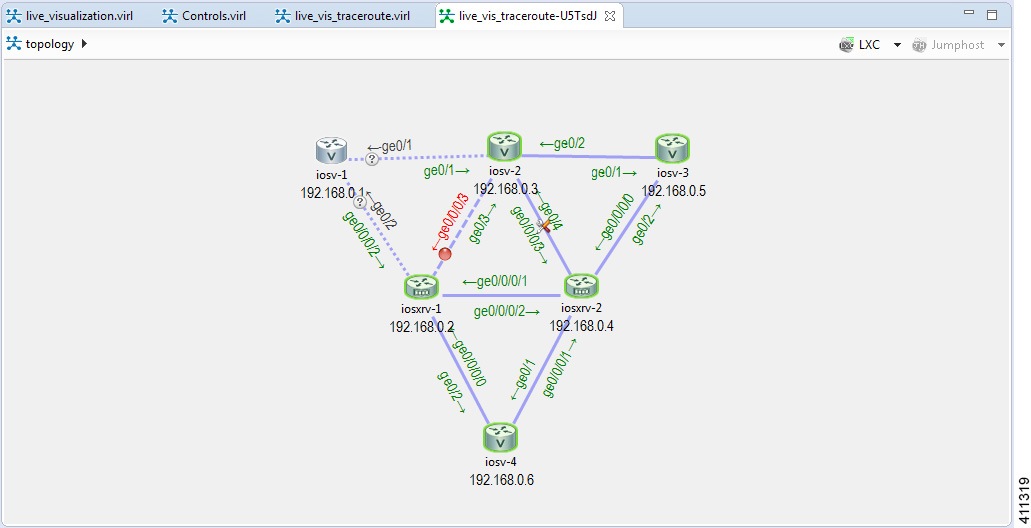
The initial Live
Visualization overlay that is displayed in the browser window is the physical
model of the topology. The physical model shows the nodes and interface
connections between the nodes based on the .virl file. It is similar to the
Cisco Modeling Labs topology view.
The
Physical
drop-down list provides a series of overlays such as the physical live overlay,
the OSPF live overlay, the iBGP live overlay and so on. When you select one of
these options, Cisco Modeling Labs collects the live data from the nodes in the
topology and draws the protocol map.
The
Actions
drop-down list provides a list of actions that are applied for each specific
protocol. When an action is selected from the
Actions
drop-down list, this results in commands being executed on each active virtual
machine. The
Actions
drop-down list also provides other functions such as Shutdown Simulation, Show
Interface Table, Clear Traceroute Paths.
Placing the cursor
over a node displays a pop-up view of information about that node. The type of
information displayed depends on the selected option and node configuration.
You can also hover over the connections to see connection details.
Selecting a node
displays a pop-up menu of available options for the node.
Available options
are:
-
Shutdown Node: Allows
you to shutdown a running node, with the results reported in the
Log view.
-
Telnet to
Serial0/Serial1: Allows you to Telnet to a node's serial ports 0 and 1.
Opens a console port to serial or aux ports from within the web browser.
-
Collect Node Route
Table: Allows you to collect the route table from every node in the
simulation, with the results reported in the
Log view.
-
Plot Routes to
Prefix (alpha): Allows you to select a node and the system will show the
next hops taken by traffic to this node's loopback address. This only work for
nodes that are Cisco IOSv instances.
-
Ping From/To: Allows
you to ping from one node to another node. A five packet ping is triggered from
source to destination, with the results reported in the
Log view.
-
Trace From/To: Allows
you to execute a traceroute between nodes, with the results reported in the
Log view.
Selecting an
interface displays a pop-up menu of available options for the interface.
Available options
are:
-
Disable/Enable
Interface: Allows you to disable an interface, with the results reported in
the
Log view.
-
Setup Packet Capture:
Allows you to start a packet capture. Opens the User Workspace Management
interface in a new web browser, where you can set the required capture limits.
-
Plot Routes to
Prefix (alpha): Allows you to select an interface and the system will show
the next hops taken by traffic to this interface's loopback address.
-
Trace From/To:Allows
you to execute a traceroute between interfaces, with the results reported in
the
Log view.
-
Ping From/To: Allows
you to ping from one interface to another interface, with the results reported
in the
Log view.
Physical Connections
To view the live
physical data, place the cursor over the
Physical list and select
Physical Live
from the drop-down list.

Note |
The collect
interfaces action is run automatically when a Live Visualization session is
first loaded.
|
Hovering over an interface displays the information collected
about the interface. The command
is used to collect IP addressing
information from the interfaces in order to perform reverse mappings, such as,
IGP, BGP, and traceroute data processing. If the IPs are changed, you need to
re-run this command. You can view the command applied in the
Log view.
OSPF
To view the live
OSPF data, do either of the following:
-
Choose
from the drop-down list; or
-
Choose
. For both options, the
Collect
OSPF action runs the relevant show OSPF command on the nodes and then
triggers the processor to parse and build the connectivity. The results are
shown as adjacencies on the topology.
You can view the show command applied in the
Log view.
iBGP
To view the live
iBGP data, do either of the following:
-
Choose
from the drop-down list; or
-
Choose
. For both options, the
Collect
BGP action runs the relevant show BGP command on the nodes and then
triggers the processor to parse and build the connectivity. The results are
shown as adjacencies on the topology.
You can view the
show command applied in the
Log view.
SYSLOG
You can configure
all nodes to send syslog messages to a syslog process. From the
Actions
drop-down list, click
Setup Syslog.
This sets up the virtual machines to send syslog messages to the LXC management
node.
These messages are
forwarded through a web socket to the front-end and can be seen under the
Syslog option.
 Feedback