Logging into the Cisco APIC-EM
Procedure
| Step 1 |
In your browser address bar, enter the IP address of the Cisco APIC-EM in the following format: https://IP address |
| Step 2 |
On the launch page, enter your username and password that you configured during the deployment procedure. The Home page of the APIC-EM controller appears. The Home page consists of the following three tabs:
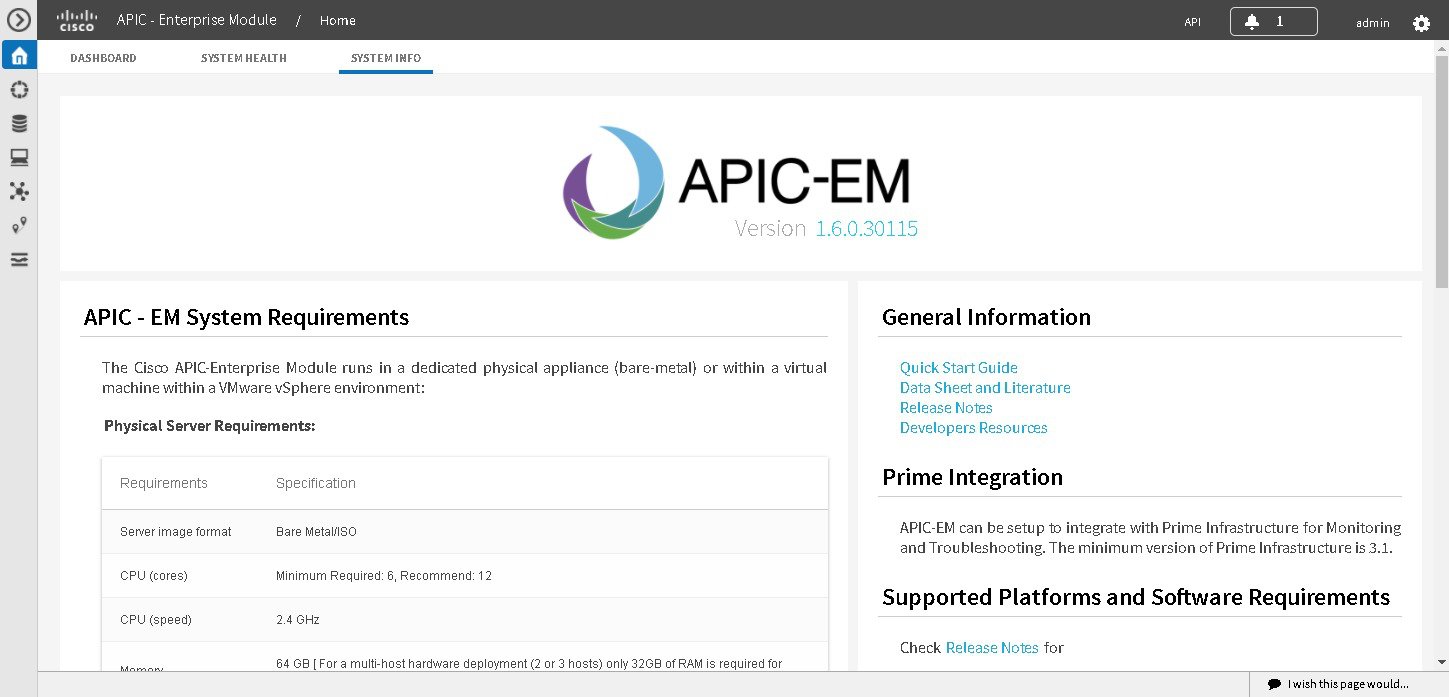 |
Reviewing the SYSTEM INFO Tab
You can use the SYSTEM INFO tab to access information at a glance about the controller, its system requirements, supported platforms, and other information. The SYSTEM INFO tab is directly accessible from the Home page.
Before you begin
You must have successfully deployed the Cisco APIC-EM and it must be operational.
All users can access the contents of the SYSTEM INFO tab. The SYSTEM HEALTH tab access is limited to users with ROLE_ADMIN privileges and RBAC scope configured to All. The DASHBOARD tab is limited to users with ROLE_ADMIN privileges and RBAC scope configured to All or ROLE_POLICY_ADMIN privileges and RBAC scope configured to All.
For information about user permissions and RBAC scopes required to perform tasks using the Cisco APIC-EM, see the chapter, "Managing Users".
Log into the Cisco APIC-EM Home page, as described in the previous procedure.
Procedure
| Step 1 |
On the Home page, click the SYSTEM INFO tab to view general information about the controller. Proceed to perform any or all of the following actions listed in the steps below. |
| Step 2 |
Review the information displayed on the GUI page about system requirements. |
| Step 3 |
Review the information displayed on the GUI page about supported platforms and software requirements |
| Step 4 |
Review the information displayed on the GUI page about Prime Infrastructure support. |
| Step 5 |
Click the link to open the Quick Start Guide. The Quick Start Guide provides an introduction to the controller and its basic functionality. |
What to do next
Click the datasheet links or Cisco DevNet links for additional information about the controller and access to Cisco DevNet, respectively.
Click the other tabs to review the controller's dashboard and system health.
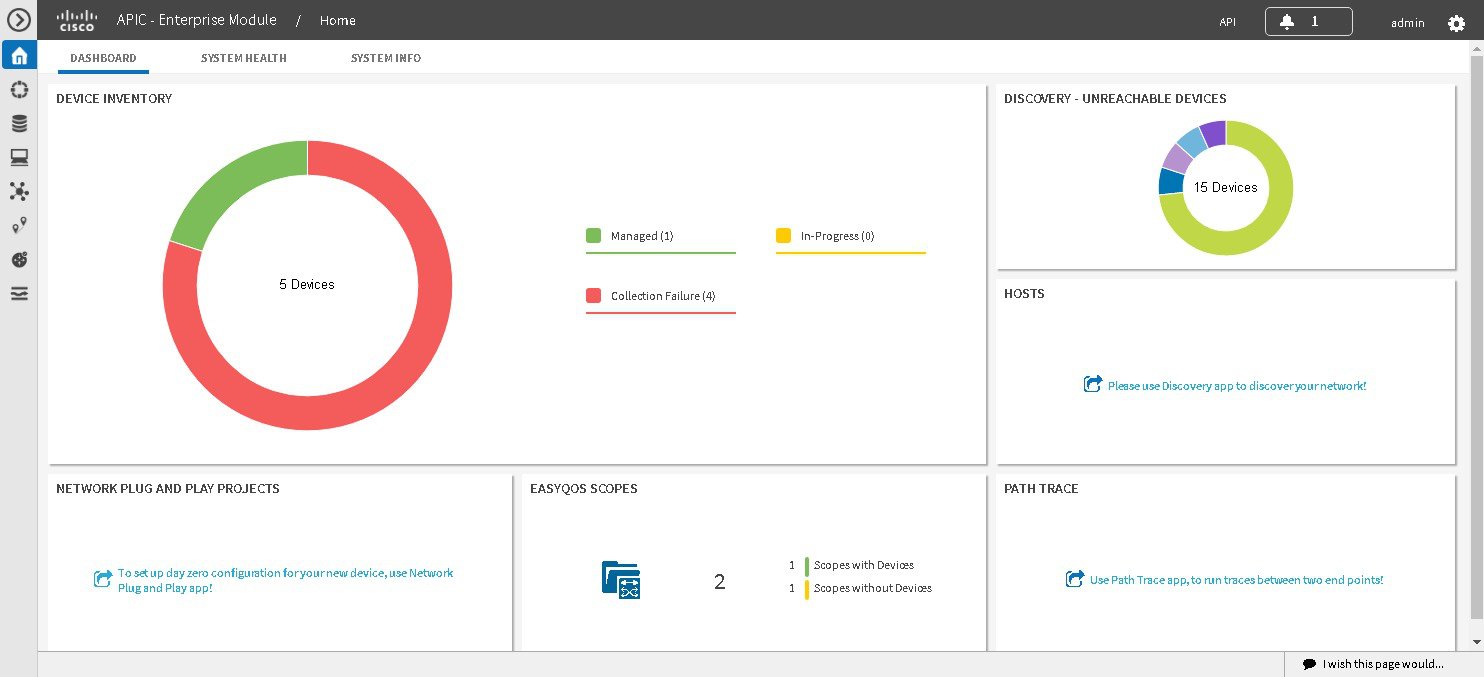
Reviewing the DASHBOARD Tab
You can use the DASHBOARD tab to quickly view graphical displays of key applications on the controller and their operational status. This information can be used to monitor the controller, the network devices that the controller manages, as well as to assist in troubleshooting any problems. The DASHBOARD tab is directly accessible from the Home page.
Before you begin
You must have successfully deployed the Cisco APIC-EM and it must be operational.
All users can access the contents of the SYSTEM INFO tab. The SYSTEM HEALTH tab access is limited to users with ROLE_ADMIN privileges and RBAC scope configured to All. The DASHBOARD tab is limited to users with ROLE_ADMIN privileges and RBAC scope configured to All or ROLE_POLICY_ADMIN privileges and RBAC scope configured to All.
For information about user permissions and RBAC scopes required to perform tasks using the Cisco APIC-EM, see the chapter, "Managing Users".
Log into the Cisco APIC-EM Home page, as described in the previous procedure.
Procedure
| Step 1 |
On the Home page, click the DASHBOARD tab to view information about the controller's current activities. You can view data about the controller's current activities through the dashboard. This data is organized through a set of seven widgets, although only six widgets are displayed at a time.
Unless you have started a discovery and/or a specific controller application, the widgets in the dashboard will be grayed out and inactive. After starting a discovery, data will start to populate and appear in these widgets. Data displayed is updated every few minutes. |
||||||||||||||||||
| Step 2 |
After performing a successful discovery, review the data displayed in each of the seven widgets.
Each widget in the above table displays data related to an application. If that widget's application is not enabled on the controller, then no data will be visible for that application. |
||||||||||||||||||
| Step 3 |
Proceed to click within any widget icon to view additional detailed data about its subject matter. Additionally, by clicking the appropriate link within the widget you can immediately access the underlying application. |
What to do next
Click the other tabs to review the controller's system health and system information.
Reviewing the SYSTEM HEALTH Tab
You can use the SYSTEM HEALTH tab to quickly view graphical displays of both the basic health of the system and the applications running on the controller. This information can be used to monitor the controller and its applications, as well as to assist in troubleshooting any problems. The SYSTEM HEALTH tab is directly accessible from the Home page.

Before you begin
You must have successfully deployed the Cisco APIC-EM and it must be operational.
All users can access the contents of the SYSTEM INFO tab. The SYSTEM HEALTH tab access is limited to users with ROLE_ADMIN privileges and RBAC scope configured to All. The DASHBOARD tab is limited to users with ROLE_ADMIN privileges and RBAC scope configured to All or ROLE_POLICY_ADMIN privileges and RBAC scope configured to All.
For information about user permissions and RBAC scopes required to perform tasks using the Cisco APIC-EM, see the chapter, "Managing Users".
Log into the Cisco APIC-EM Home page, as described in the previous procedure.
Procedure
| Step 1 |
On the Home page, click the SYSTEM HEALTH tab to view information about the health of the basic system and the applications running on the controller. The following information is displayed in the SYSTEM HEALTH tab.
|
||||||||
| Step 2 |
Place your cursor over a specific service to view additional information about it. The following additional information is displayed about the service:
|
||||||||
| Step 3 |
(Optional) Click the green-colored addition icon (+) within the service to grow (start up) an instance of that service for an application.
|
||||||||
| Step 4 |
(Optional) Click the red-colored subtraction icon (-) within the service to harvest (shut down) an instance of the service for an application.
|
What to do next
Click the other tabs to review the controller's dashboard and system information.


 Feedback