Cisco SCA BB Service Security Note, Release 5.2.x
Bias-Free Language
The documentation set for this product strives to use bias-free language. For the purposes of this documentation set, bias-free is defined as language that does not imply discrimination based on age, disability, gender, racial identity, ethnic identity, sexual orientation, socioeconomic status, and intersectionality. Exceptions may be present in the documentation due to language that is hardcoded in the user interfaces of the product software, language used based on RFP documentation, or language that is used by a referenced third-party product. Learn more about how Cisco is using Inclusive Language.
- Updated:
- September 19, 2015
Chapter: Anomaly Based Detection
Anomaly-Based Detection
Introduction
This chapter describes anomaly-based detection by using the Cisco SCE platform. It consists of these sections:
Overview
The most comprehensive threat detection module is the anomaly detection module. The module monitors successful (correctly established for TCP, bidirectional otherwise) and unsuccessful (uni-directional, also termed “suspected”) connection rates to and from any IP address viewed by the system. It triggers the detection of an anomaly based on one of the following criteria:
- Suspected connection rate exceeded a predefined threshold, and suspected-to-unsuspected connections ratio exceeded a predefined threshold.
The ratio metric is a robust indicator for malicious activity, and together with a rate qualifier, serves as a reliable identifier for malicious activity.
Anomaly detection is split into categories based on the directional nature of anomalies as described in the following subsections. The concepts used by the three methods are identical, but they differ in the role of the endpoint that is monitored for the anomaly.
Scan/Sweep/Attack is a category of malicious activity that is based on detecting an anomaly in the connection rate from an IP address. In this case, the module ignores the destination IP addresses involved.
The anomaly is detected based on the criteria specified in the previous paragraphs and can indicate one of the following:
- An attack—A host is participating in an attack on another host.
- A sweep—A host is sweeping the network in search of a vulnerable host. This activity is typical of network worms.
- A scan—A host is scanning the ports of other hosts to find out what services they are using and which ports are potentially vulnerable.
A DoS attack is detected based on an anomaly in the connection rate between a pair of hosts. One host is attacking the other. This attack can be either an isolated attack, or part of a larger scale DDoS attack.
A DDoS attack is detected based on an anomaly in the connection rate to an IP address. The module ignores the source IP addresses involved. A high connection rate indicates that the destination IP address is being attacked. The attack can be from either a single IP address (DoS) or multiple IP addresses (DDoS).
For many types of anomalies, flexibility is reflected in the ability to define detection thresholds and the action to be taken for each:
- Anomaly direction (subscriber/network)
- Protocol (TCP/UDP/ICMP/Other)
- Port uniqueness for TCP/UDP—Whether the anomaly threshold is applicable to a single port or the aggregate of ports.
The malicious traffic reports family in the reporter contains reports that allow monitoring different aspects of malicious activity.
Configuring Anomaly Detection
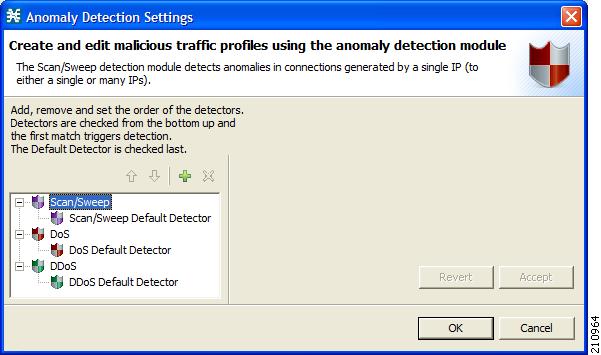
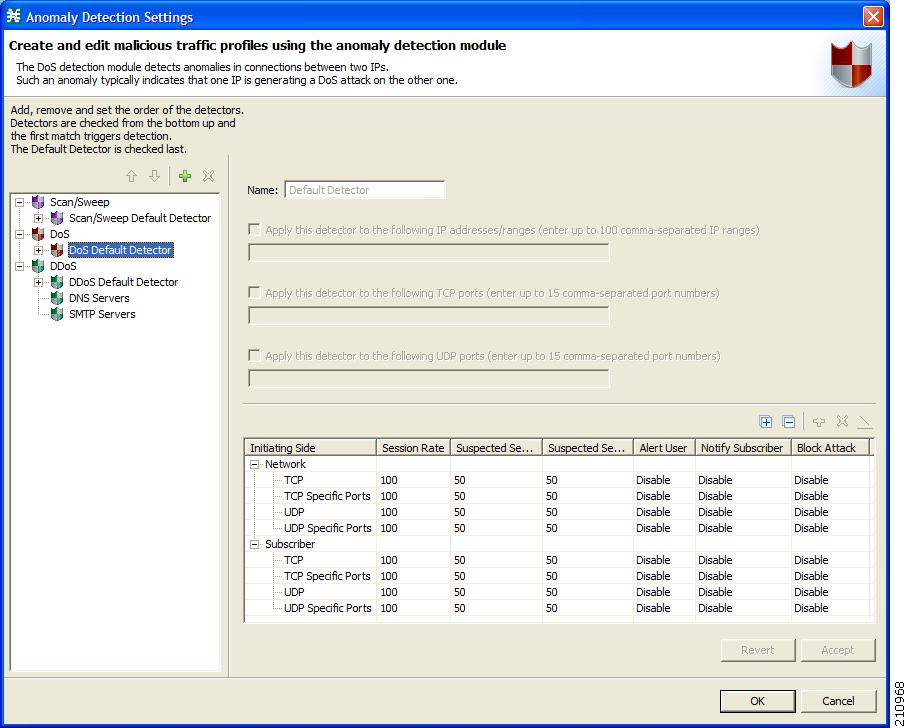
The configuration screen for anomaly detection shows the “tree” of various detectors (Figure 3-1). The tree comprises the three categories of anomalies.
The three categories are separate from a configuration perspective—Scan/Sweep, DoS, and DDoS.
Figure 3-1 Configuring Anomaly Detection
General Concepts in Anomaly Detection Configuration
Detector Structure
The terms used in anomaly detection are described in this chapter. The term “related to” is used extensively; however, its meaning depends on the semantics of each anomaly and is mentioned in the description for each category of anomalies (Scan/Sweep/Attack, DoS, and DDoS).
The first level of hierarchy within the detector contains two subcategories: Subscriber and Network. The Subscriber subcategory refers to malicious traffic related to IP addresses that are on the subscriber port. The Network subcategory refers to malicious traffic related to IP addresses that are on the network port.
These subcategories allow an operator to act on anomalies that are related to either the subscriber or network side (see Figure 3-2).
Under each subcategory, six further granular subcategories exist:
- TCP—Refers to anomalies in connection rate related to a host over any TCP destination port. The aggregate rate of connections on all TCP ports is applicable for matching this rule.
- TCP Specific—Refers to anomalies in connection rate related to a host over any specific TCP destination port. For example, the rate of connections related to a specific host on port 80 is applicable for matching this rule, as well as the rate of connections related to a host over each of the TCP ports 23, 25, 110 (and any specific TCP port).
- UDP—Refers to anomalies in connection rate related to a host over any UDP destination port. The aggregate rate of connections on all UDP ports is applicable for matching this rule.
- UDP Specific—Refers to anomalies in connection rate related to a host over any specific UDP destination port. For example, the rate of connections related to a host on port 53 is applicable for matching this rule, as well as the rate of connections generated by a host over each UDP port.
- ICMP—Refers to anomalies in the connection rate related to a host using Internet Control Message Protocol (ICMP).
- Other—Refers to anomalies in the connection rate related to a host using non-TCP/UDP/ICMP protocols.
Configuring Detection Thresholds
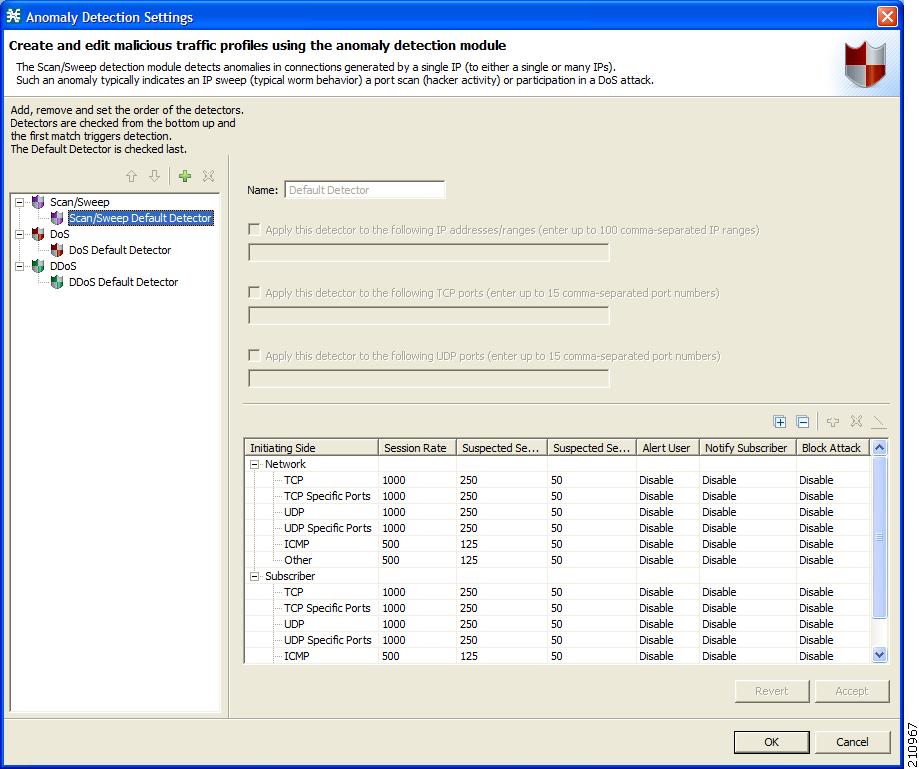
The configuration of specific detection parameters and related actions is carried out on a per subcategory basis (see Figure 3-3).
The configurable detection parameters for each anomaly subcategory are:
- Session Rate—Refers to the threshold of session-rate (sessions per second for an IP address) that for itself would trigger the anomaly of this type.
For example, configuring the value 1000 on the session-rate for the TCP anomaly means that if a rate of 1000 TCP sessions per second (on any port) was detected from a host, the anomaly would be triggered.
- Suspected Session Rate—Refers to the threshold of suspected-sessions-rate (suspected-sessions per second) that for itself would trigger the anomaly line item.
Suspected sessions are TCP sessions that were not properly established or unidirectional sessions for other protocols (UDP/ICMP/Other).
This parameter is used with the suspected-sessions ratio as an indicator of a traffic anomaly—a relatively high session-rate for which a large number do not respond typically indicates malicious activity.
For example, configuring the value 1000 suspected-sessions per second for the TCP anomaly means that if a rate of 1000 TCP suspected-sessions per second (on any port) was detected from a host, and the suspected connection-ratio crossed the predefined threshold, the anomaly would be triggered.
- Suspected Sessions Ratio—The ratio between the suspected-sessions rate and the total session-rate. A high ratio indicates a high amount of “unresponsive” sessions, which indicates a malicious activity.
Figure 3-3 Configuring Detection Thresholds
Configuring Actions
Each anomaly subcategory also includes an option to define the action to be taken upon detection. It is not possible to configure, for each anomaly subcategory, logging to an on-device log file and to the Collection Manager database through SCE Raw Data Records (RDRs). To enable and disable RDRs for malicious traffic, from the Configuration menu, select RDR Settings (Figure 3-4).
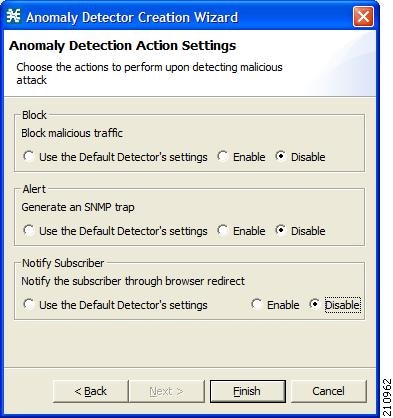
There are three independent and not mutually exclusive actions that are configurable per item:
- Alert—Generate an SNMP trap (see Pcube proprietary MIB for details) indicating the beginning and end of such an attack.
- Notify Subscriber—Notify a subscriber of the malicious activity by redirecting the browsing sessions to a captive portal. To configure a subscriber notification, from the Configuration menu select Subscriber Notifications, then select Network Attack Notification. See the Cisco Service Control Application for Broadband User Guide for subscriber notification options.
- Block—Block the relevant session. Blocking is performed based on the specification of the malicious traffic that triggered the anomaly. For instance, if the anomaly detected is a port agnostic TCP scan from the subscriber side, all TCP sessions originating from the subscriber side is blocked. Blocking continues until the anomaly disappears. SCE removes the blocking intermittently and verifies whether the anomaly persists. If the subscriber notification is enabled for the anomaly, SCE does not block the port relevant for browsing (by default, TCP port 80).
Figure 3-4 Anomaly Detection Action Settings
Default Detector
For each category of malicious traffic, a default detector exists. You cannot remove this default detector. This default detector is preconfigured with factory defaults for thresholds and actions.
Additional Detectors
For each category of malicious traffic (Scan/Sweep, DoS, DDoS), additional detectors can be defined under the default detector (see Figure 3-5). You can define a maximum of 100 detectors in the three categories combined.
Such a detector applies to an IP Address list, a UDP port list, a TCP port list, or a combination of the three. The detector should contain different thresholds and different actions to be applied for anomalies that match the list.
For example, it is possible to have a DDoS detector, which corresponds to an IP address with no specific port, or to have another detector which monitors specific port attacks (for example, DNS or SMTP detectors). Another example is detectors that are targeted at a specific worm, and therefore, include a specific list of ports.
You can apply additional detectors to one or more of the subcategories of the anomaly. For example, If you create a DDoS detector for a specific IP list, and choose to apply it only for specific port attacks from the subscriber side. The new detector need not cover all “potential” subcategories of DDoS.
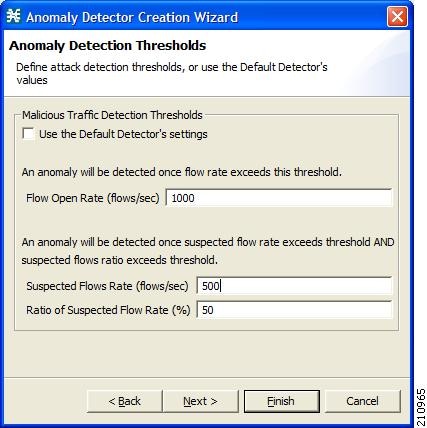
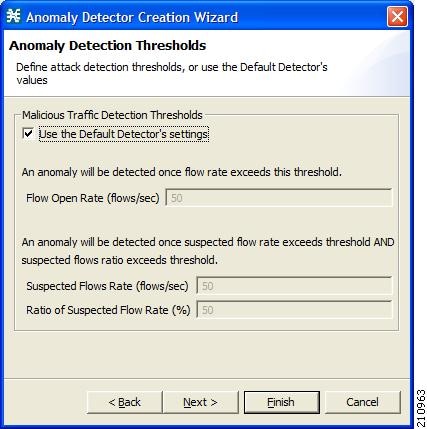
When creating a new anomaly subcategory, you must define the actions to take; but, you can choose to use custom detection thresholds, or to inherit detection thresholds from the default detector.
Figure 3-5 Anomaly Detector Wizard
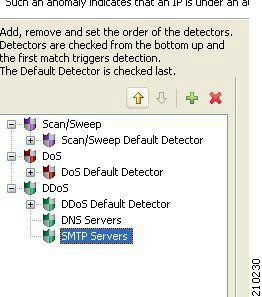
An anomaly can be triggered by exactly one detector. The order of detection is from the bottom of the list and up. The first detector that “matches” the anomaly threshold, together with the IP/Port list specification, sets the decision on the actions to take.
Use the up and down arrows above the anomaly tree window to arrange the detector in each category into the desired order (see Figure 3-6).
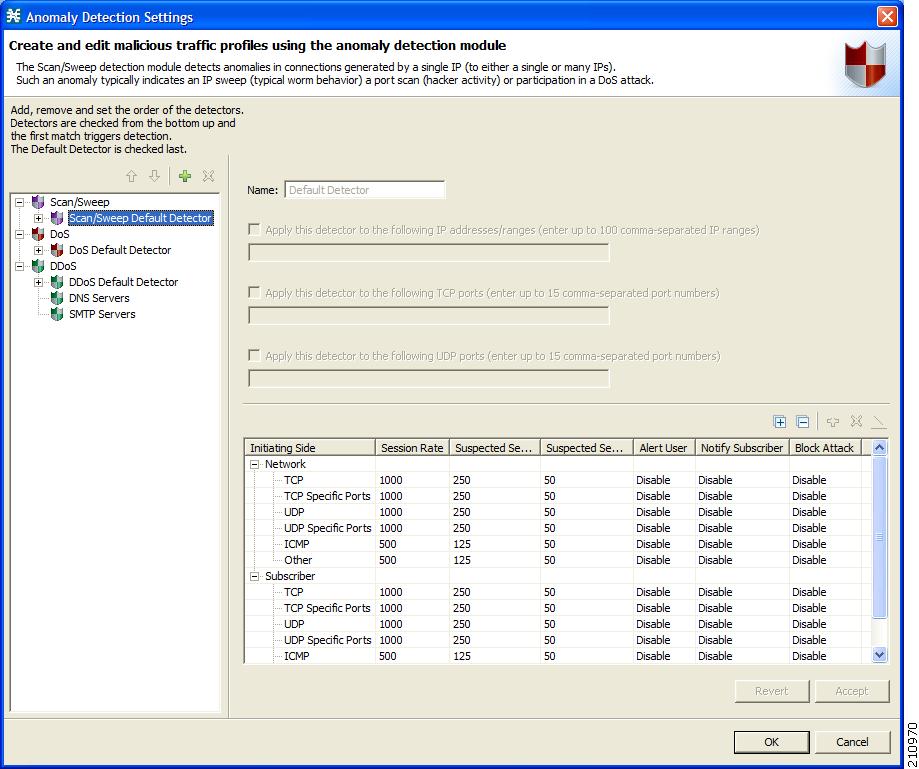
Scan/Sweep Detector
The scan/sweep detector detects anomalies in connections generated by a host (see Figure 3-7). These anomalies include total-connection-rate, suspected-connections-rate, and suspected-connections-ratio.
A high ratio of suspected connections generated by a host, beyond some minimal rate, typically indicates the presence of a worm that tries to propagate by sweeping the network for vulnerable hosts. The presence of a worm is even more obvious when an anomaly is detected on a specific port over which the vulnerability exists—this would typically trigger the TCP/UDP-specific anomalies.
In addition, port scans and attacks performed by a host are also included in this category. Port scans are typically characterized by a high ratio of suspected connections, while host attacks can be either normal or suspected connections. Both types of malicious traffic could be detected by the non-port-specific anomaly detectors.
The first level of hierarchy within the detector contains two subcategories—Subscriber and Network. The Subscriber subcategory refers to scans, sweeps, and attacks that were detected from IP addresses that are on the subscriber port side. The Network subcategory refers to scans, sweeps, and attacks that were detected from IP addresses that are on the network port side.
These subcategories allow an operator to act on Scan/Sweep/Attack anomalies that originate from either the subscriber or network side.(see Figure 3-7).
Under each subcategory, six further granular subcategories exist:
- TCP—Refers to anomalies in the aggregate connection rate generated by a host over all TCP destination ports. For example, the aggregate rate of connections generated by a host to ports 23, 25, 80, 110, and any other TCP port is applicable for matching this rule.
- TCP Specific—Refers to anomalies in the connection rate generated by a host to any specific TCP destination port. For example, the rate of connections generated by a host to port 80 is applicable for matching this rule, as well as the rate of connections generated by a host to any other individual TCP port.
- UDP—Refers to anomalies in the aggregate connection rate generated by a host to all UDP destination ports. For example, the aggregate rate of connections generated by a host to ports 53, 445, and any other UDP port is applicable for matching this rule.
- UDP Specific—Refers to anomalies in the connection rate generated by a host to any specific UDP destination port. For example, the rate of connections generated by a host to port 53 is applicable for matching this rule, as well as the rate of connections generated by a host to any other individual UDP port.
- ICMP—Refers to anomalies in the connection rate related to a host using Internet Control Message Protocol (ICMP).
- Other—Refers to anomalies in the connection rate related to a host using non-TCP/UDP/ICMP protocols
Figure 3-7 Scan/Sweep Default Detector
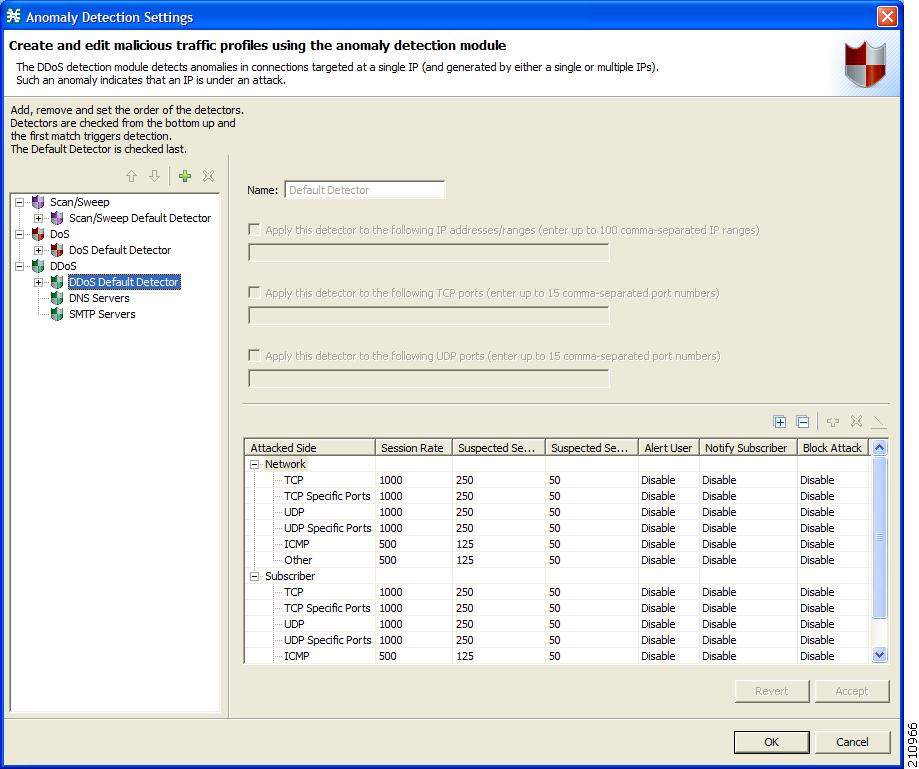
DDoS Detector
The DDoS detector detects anomalies in connections for which a host is a destination (Figure 3-8). These anomalies include total-connection-rate, suspected-connections-rate, and suspected-connections-ratio.
A high rate of connections to an IP address indicates that the IP address is being attacked.
A better indicator that an IP is being attacked is when there is a high suspected-sessions rate, in addition to a high suspected-sessions ratio.
The DDoS detector module detects DoS and DDoS attacks without differentiating between them because the module does not track the IP addresses involved in generating the connection.
The first level of hierarchy within the detector contains two subcategories: Subscriber and Network. The Subscriber subcategory refers to attacks that were detected on IP addresses that are on the subscriber port side. The Network subcategory refers to attacks that were detected on IP addresses that are on the Network port side.
These subcategories allow an operator to act on anomalies that are towards either the subscriber or network side. (see Figure 3-8).
An operator might consider protecting subscribers from suspected attacks, while not doing this for network side activity, in order to not affect legitimate activity by subscribers who are falsely detected as participating in an attack.
Under each subcategory, six further granular subcategories exist:
- TCP—Refers to anomalies in the aggregate connection rate to a host over all TCP destination ports. For example, the aggregate rate of connections to ports 23, 25, 80, 110, and any TCP port is applicable for matching this rule.
- TCP Specific—Refers to anomalies in the connection rate to a host over any specific TCP destination port. For example, the rate of connections to a host on port 80 is applicable for matching this rule, as well as the rate of connections to a host on any other individual TCP port.
- UDP—Refers to anomalies in the connection rate to a host over all UDP destination ports. For example, the aggregate rate of connections to ports 53, 445, and any UDP port is applicable for matching this rule.
- UDP Specific—Refers to anomalies in the connection rate to a host over any specific UDP destination port. For example, the rate of connections to a host on port 53 is applicable for matching this rule, as well as the rate of connections to a host over any other individual UDP port.
- ICMP—Refers to anomalies in the connection rate related to a host using Internet Control Message Protocol (ICMP).
- Other—Refers to anomalies in the connection rate related to a host using non-TCP/UDP/ICMP protocols
Figure 3-8 DDoS Default Detector
DoS Detector
The DDoS detector detects anomalies in connections between a pair of hosts. These anomalies include total-connection-rate, suspected-connections-rate, and suspected-connections-ratio..
A high rate of connections between a pair of hosts may be an indicator that the source host is attacking the destination host.
A better indicator that one host is attacking the other is when there is a high suspected-sessions rate, with a high suspected-connections ratio.
This module monitors the rate of connections between a pair of hosts. This can include DoS and DDoS attacks without differentiating between them because there can be multiple hosts attacking the destination host, which the module may not explicitly detect.
The first level of hierarchy within the detector contains two subcategories—Subscriber and Network. The Subscriber subcategory refers to attacks that were detected from IP addresses that are on the subscriber port side. The Network subcategory refers to attacks that were detected from IP addresses that are on the Network port side.
These subcategories allow an operator to act on anomalies that are coming from either the subscriber or network side (see Figure 3-9).
An operator might consider protecting subscribers from suspected attacks directed at them, but not doing this for network side activity, in order to not affect legitimate activity by subscribers who are falsely detected as participating in an attack.
Under each subcategory, four further granular subcategories exist:
- TCP—Refers to anomalies in the aggregate connection rate between a pair of hosts over all TCP destination ports. The aggregate rate of connections between a pair of hosts on ports 23, 25, 80, 110, and all other TCP ports is applicable for matching this rule.
- TCP Specific—Refers to anomalies in the connection rate between a pair of hosts over any specific TCP destination port. For example, the rate of connections between a pair of hosts on port 80 is applicable for matching this rule, as well as the rate of connections between a pair of hosts on any other individual TCP port.
- UDP—Refers to anomalies in the aggregate connection rate between a pair of hosts over all UDP destination ports. For example, the aggregate rate of connections between a pair of hosts on ports 53, 445, and all other UDP ports is applicable for matching this rule.
- UDP Specific—Refers to anomalies in the connection rate between a pair of hosts over any specific UDP destination port. For example, the rate of connections between a pair of hosts on port 53 is applicable for matching this rule, as well as the rate of connections between a pair of hosts over any other individual UDP port.
The ICMP category and the Other category do not exist for DoS detection because connections between a pair of hosts using these protocols cannot be distinguished from one another.
Figure 3-9 DoS Default Detector
Monitoring Malicious Traffic
Information about traffic anomalies detected using the scan/sweep and the DDoS modules is sent over RDRs and is stored in the Collection Manager database. This information can be used to find network trends, detect new threats, and track malicious hosts or subscribers.
Because the anomaly detection is based on session rate threshold breaches, the actual information stored in the database can vary, depending on the detection thresholds set.
For example, it is possible that scan/sweep reports generated for a system with thresholds set at 100 sessions per second would look notably different (much more loaded with events) than reports generated for a system with thresholds set at 1000 sessions per second (assuming traffic patterns are identical for both systems).
There are a number of reports dealing with malicious traffic.
Global or “trending” reports include:
Individual subscriber or host reports include:
- Top Scanning or Attacking Hosts
- Top Scanning or Attacking Subscribers
- Top DoS Attacked Hosts
- Top DoS Attacked Subscribers
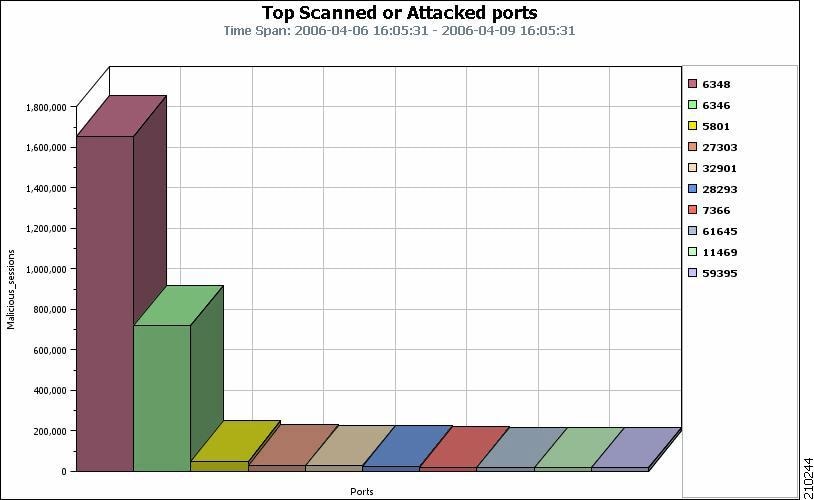
Top Scanned or Attacked Ports
The Top Scanned or Attacked ports report is based on the records of sweep/attack activity detected by the SCE platform on a specific port (Figure 3-10).
The report presents the top ports over which such activity was detected. This provides a good indication of the current “vulnerable” ports being searched by worms, bots, and hackers.
The introduction of a new network worm is typically characterized by a rise in the number of sweeps on a specific port. Ongoing monitoring of the network by using this report would allow an operator to detect an outbreak of a new network threat based on a rise in the amount of malicious activity over some port.
Figure 3-10 Top Scanned or Attacked Ports Report
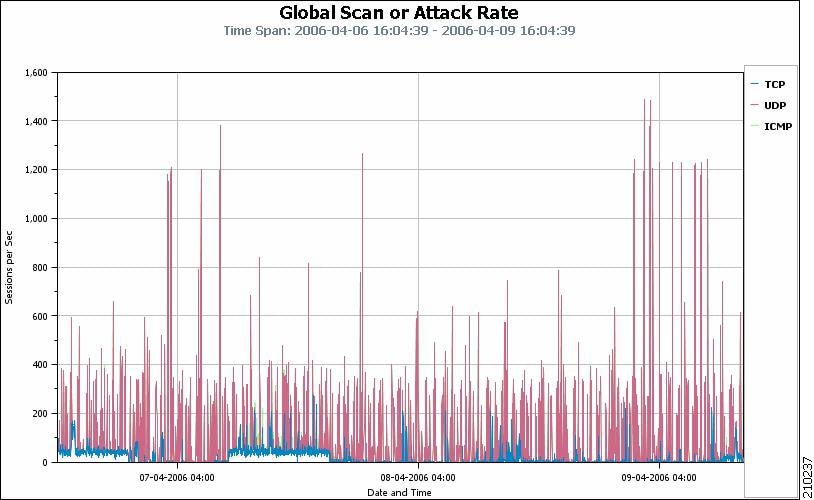
Global Scan or Attack Rate
The Global Scan or Attack Rate report is based on the records of sweep/attack activity detected by the SCE platform, but not limited to a specific port (see Figure 3-11).
The report presents the global scan/attack rate over time, broken down by protocol. You can filter the report by the scan direction, that is, from the subscriber or from the network.
An outbreak of a network worm is typically reflected in a surge of scan activity, which this report can help detect.
Figure 3-11 Global Scan or Attack Rate Report
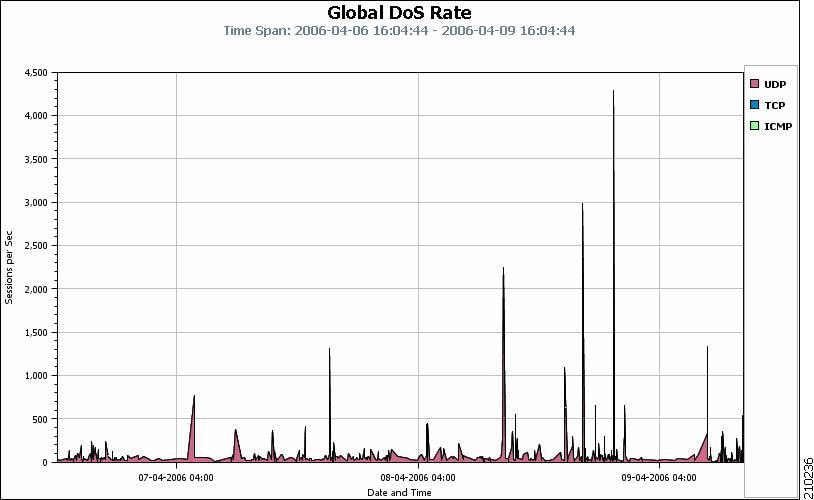
Global DoS Rate
The Global DoS Rate report is based on the records of DDoS activity detected by the SCE platform, but not limited to a specific port (see Figure 3-12).
This report presents the global DoS rate over time broken down by protocol. You can filter the report by the attack direction, that is, to the subscriber or to the network.
Figure 3-12 Global DoS Rate Report
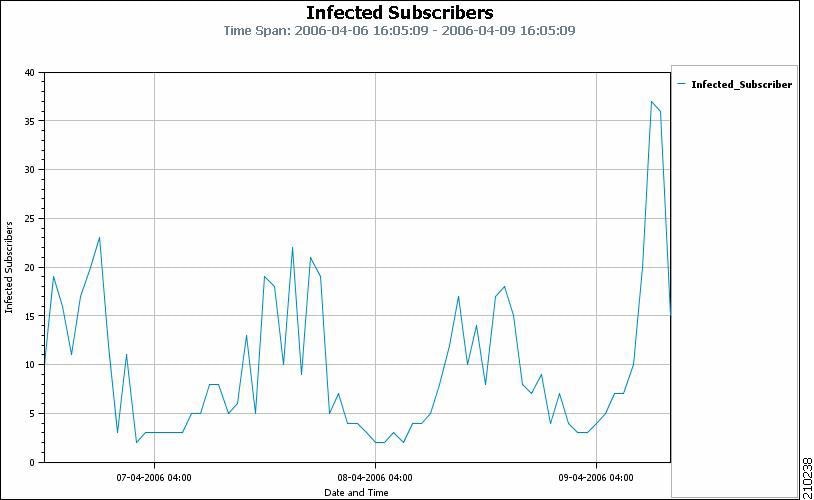
Infected Subscribers
The Infected Subscribers report is based on the records of scan/attack activity detected by the SCE platform, but not limited to a specific port (see Figure 3-13).
The report estimates the number of infected subscribers over time (hourly time frames). This number represents the number of subscribers that were identified as generating malicious traffic during the hour in question. “Infected” reflects an assumption that some malicious agent on the subscriber host has generated the traffic.
The introduction of a new worm would typically trigger a considerable increase in the number of infected subscribers; therefore, this report is a good method of monitoring this activity.
Figure 3-13 Infected Subscribers Report
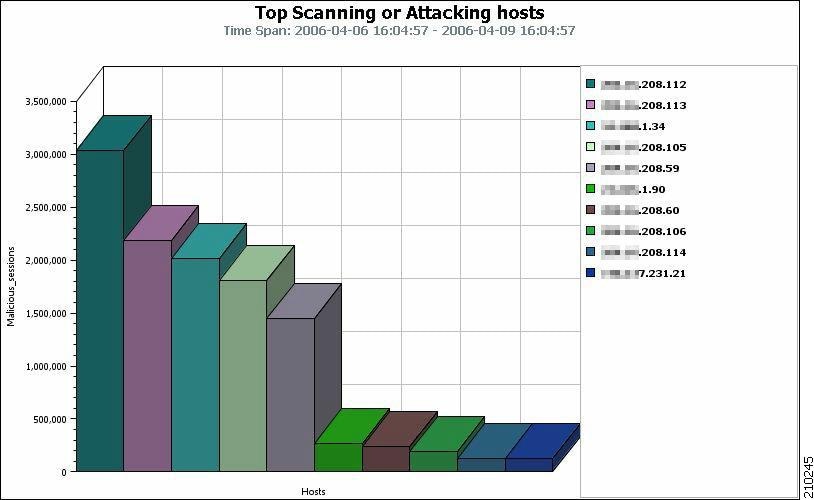
Top Scanning or Attacking Hosts
The Top Scanning or Attacking hosts report is based on the records of scan/attack activity detected by the SCE platform, but not limited to a specific port (Figure 3-14).
The report presents the top n scanning or attacking hosts during the time frame specified. You can filter the report by subscriber or network, and by protocol.
Figure 3-14 Top Scanning or Attacking Hosts Report
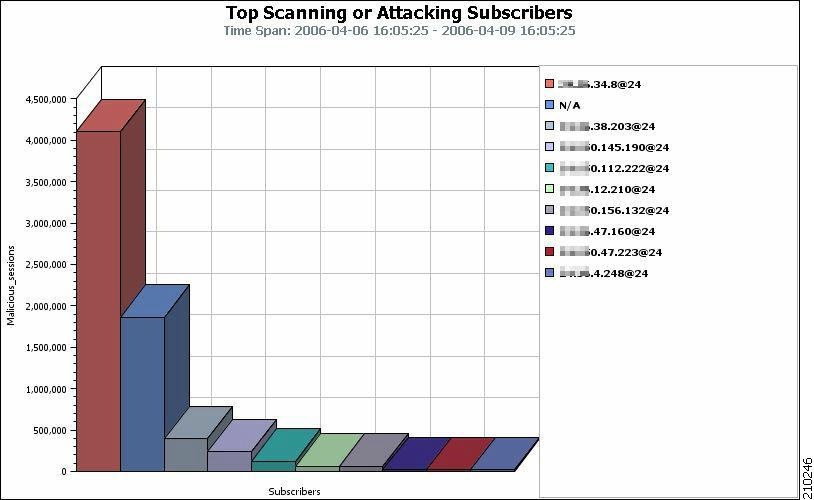
Top Scanning or Attacking Subscribers
The Top Scanning or Attacking Subscribers report is based on the records of scan/attack activity detected by the SCE platform, but not limited to a specific port (Figure 3-15).
This report presents the top n scanning or attacking subscribers during the time frame specified. You can filter the report by protocol.
The N/A subscriber that typically exists in such a report is an aggregate of scan/attack traffic that could not be ascribed to a “named” subscriber—typically due to spoofing of the source IP address.
Figure 3-15 Top Scanning or Attacking Subscribers Report
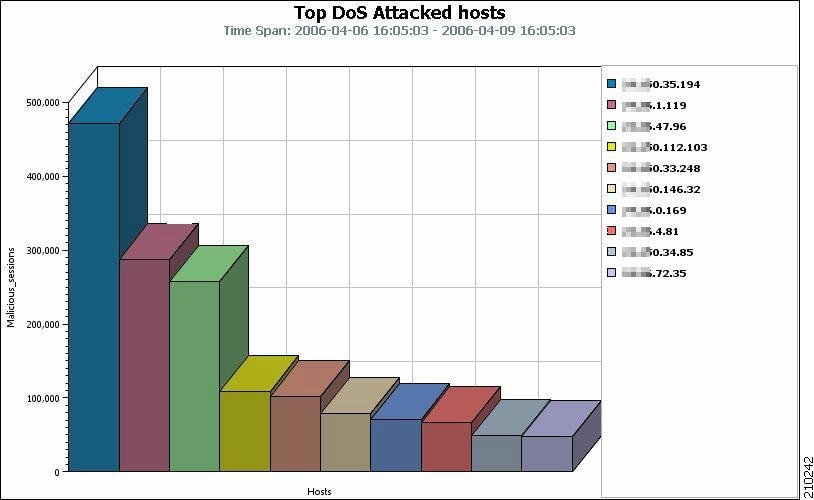
Top DoS Attacked Hosts
The Top DoS Attacked hosts report is based on the records of DDoS activity detected by the SCE platform, but not limited to a specific port (Figure 3-16).
This report presents the top n attacked hosts during the time frame specified. You can filter the report by subscriber or network, and by protocol.
Figure 3-16 Top DoS Attacked Hosts Report
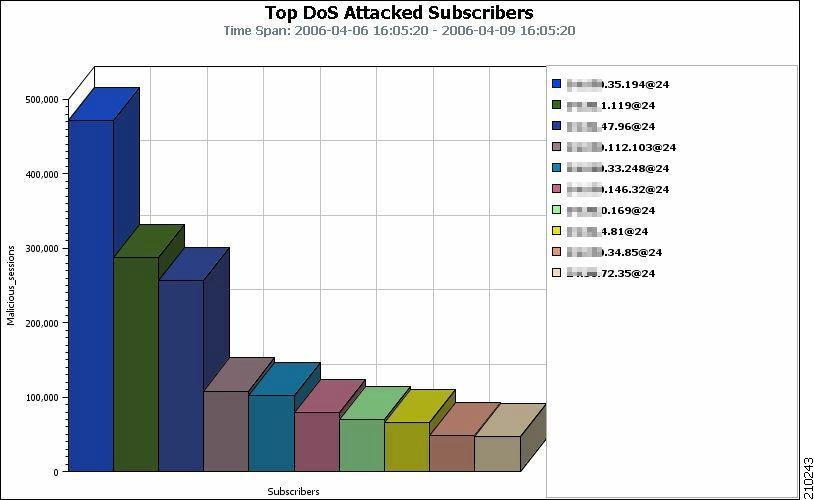
Top DoS Attacked Subscribers
The Top DoS Attacked Subscribers report is based on the records of DDoS activity detected by the SCE platform, but not limited to a specific port (Figure 3-17).
This report presents the number of attacked subscribers over time (hourly time frames). This number represents the number of subscribers that were identified as being attacked during the hour in question. You can filter the report by protocol also.
Figure 3-17 Top DoS Attacked Subscribers Report
 Feedback