- About this Guide
- Cisco Service Control Overview
- System Overview
- Traffic Processing Overview
- Getting Started
- Using the Network Navigator
- Using the Service Configuration Editor
- Using the Service Configuration Editor: Traffic Classification
- Using the Service Configuration Editor: Traffic Accounting and Reporting
- Using the Service Configuration Editor: Traffic Control
- Using the Service Configuration Editor: Additional Options
- Using the Subscriber Manager GUI Tool
- Using the Anonymous Group Manager Tool
- Using the Signature Editor
- Additional Management Tools and Interfaces
Cisco Service Control Application for Broadband User Guide, Release 4.0.x
Bias-Free Language
The documentation set for this product strives to use bias-free language. For the purposes of this documentation set, bias-free is defined as language that does not imply discrimination based on age, disability, gender, racial identity, ethnic identity, sexual orientation, socioeconomic status, and intersectionality. Exceptions may be present in the documentation due to language that is hardcoded in the user interfaces of the product software, language used based on RFP documentation, or language that is used by a referenced third-party product. Learn more about how Cisco is using Inclusive Language.
- Updated:
- February 23, 2012
Chapter: Using the Service Configuration Editor: Additional Options
- Introduction
- The Service Security Dashboard
- How to Enable VAS Traffic Forwarding
- How to Enable VAS Traffic Mirroring
- How to Rename VAS Server Groups
- How to Configure VAS Traffic-Mirroring
- How to View VAS Traffic-Forwarding Tables
- How to Delete VAS Traffic-Forwarding Tables
- How to Add VAS Traffic-Forwarding Tables
- Managing VAS Table Parameters
Using the Service Configuration Editor: Additional Options
Introduction
This chapter explains how to use additional, advanced functionality available in the Service Configuration Editor.
This chapter consists of these sections:
•![]() The Service Security Dashboard
The Service Security Dashboard
•![]() Managing Subscriber Notifications
Managing Subscriber Notifications
The Service Security Dashboard
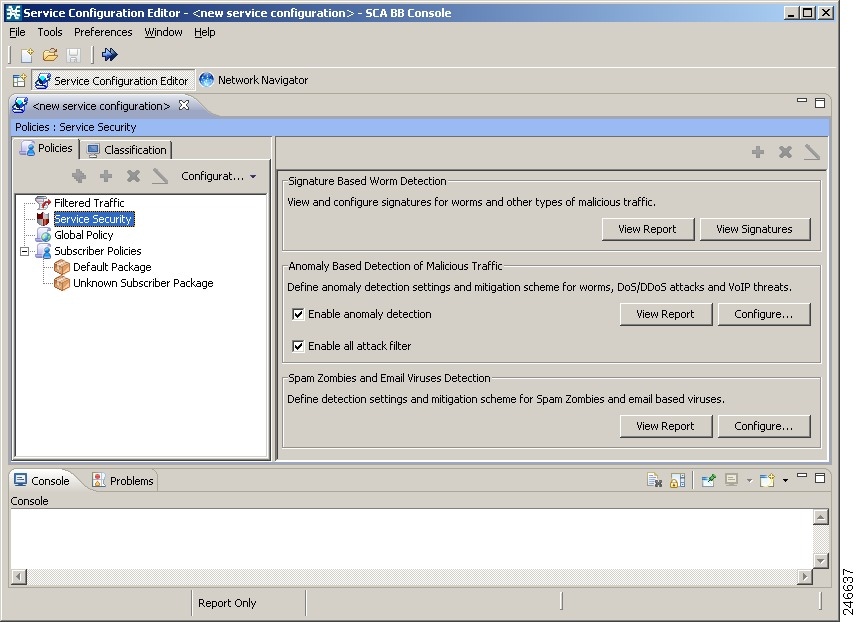
The Service Security Dashboard allows you to view and control all Cisco SCA BB security functionality.
The Dashboard is a gateway to a set of features that help you protect your network from security threats such as worms, DDoS attacks, and spam zombies. It allows configuration of the detection mechanisms (for example, attack thresholds) and of the actions to be taken when an attack is detected.
The Dashboard also allows you to access malicious traffic reports in the Reporter tool.

Workaround:
Disable anomaly-based detection of malicious traffic. (Clear the Enable anomaly detection check box.)
•![]() How to View the Service Security Dashboard
How to View the Service Security Dashboard
•![]() Viewing Malicious Traffic Reports
Viewing Malicious Traffic Reports
How to View the Service Security Dashboard
Step 1 ![]() In the Network Traffic tab, select Service Security.
In the Network Traffic tab, select Service Security.
Step 2 ![]() The Service Security Dashboard is displayed in the right pane (Figure 10-1).
The Service Security Dashboard is displayed in the right pane (Figure 10-1).
Figure 10-1 Service Security Dashboard
Managing Worm Detection
Cisco SCA BB uses three mechanisms for detecting worms:
•![]() Signature-based detection—The stateful Layer 7 capabilities of the Cisco SCE platform can detect malicious activity that is not easily detectable by other mechanisms. You can add signatures for new worms.
Signature-based detection—The stateful Layer 7 capabilities of the Cisco SCE platform can detect malicious activity that is not easily detectable by other mechanisms. You can add signatures for new worms.
•![]() Anomaly-based detection—Overall traffic analysis can detect anomalies that might indicate worm activity. See "Managing Anomaly Detection" section.
Anomaly-based detection—Overall traffic analysis can detect anomalies that might indicate worm activity. See "Managing Anomaly Detection" section.
•![]() Mass-mailing based detection—E-mail traffic analysis can detect anomalies that might indicate e-mail-based worms. See "How to Configure Spam Detection Settings" section.
Mass-mailing based detection—E-mail traffic analysis can detect anomalies that might indicate e-mail-based worms. See "How to Configure Spam Detection Settings" section.
How to View Supported Worm Signatures
Step 1 ![]() In the Service Security Dashboard, click View Signatures.
In the Service Security Dashboard, click View Signatures.
The Signatures Settings dialog box appears, with Worm Signatures selected in the Signature Type drop-down list.
All supported worm signatures are listed.
Step 2 ![]() Click Close.
Click Close.
The Signatures Settings dialog box closes.
How to Add New Worm Signatures to a Service Configuration
Either import the latest DSS or SPQI file provided by Cisco or create a DSS file containing any worm signatures that you wish to add to the service configuration.
Related Information
For more information, see "Managing Protocol Signatures" section.
Managing Anomaly Detection
The most comprehensive threat detection method is anomaly detection.
•![]() How to View Anomaly Detection Settings
How to View Anomaly Detection Settings
•![]() How to Delete Anomaly Detectors
How to Delete Anomaly Detectors
Anomaly Detection
The basic principle of anomaly detection is monitoring successful (correctly established for TCP, bidirectional for other protocols) and unsuccessful (not properly established for TCP, unidirectional for other protocols) connection rates both to and from any IP address viewed by the system, and triggering an anomaly detection condition based of one of the following criteria:
•![]() The total connection rate exceeds a predefined threshold.
The total connection rate exceeds a predefined threshold.
•![]() The suspicious connection rate exceeds a predefined threshold and the ratio of suspicious to unsuspicious connections exceeds a predefined threshold.
The suspicious connection rate exceeds a predefined threshold and the ratio of suspicious to unsuspicious connections exceeds a predefined threshold.
The ratio metric is a robust indicator of malicious activity, and together with a rate qualifier it serves as a reliable identifier for malicious activity.
Anomaly detection is divided into three categories based on the directional nature of the detected anomaly condition. The concepts used for the three categories are identical, but the nature of the detected malicious activity is different for each category.
•![]() Scan/Sweep detector—Detects malicious activity based on an anomaly in connection rates from an IP address.
Scan/Sweep detector—Detects malicious activity based on an anomaly in connection rates from an IP address.
•![]() DoS detector—Detects an anomaly in the connection rate between a pair of IP addresses: one of them is attacking the other. This can be either an isolated attack or part of a larger scale DDoS attack.
DoS detector—Detects an anomaly in the connection rate between a pair of IP addresses: one of them is attacking the other. This can be either an isolated attack or part of a larger scale DDoS attack.
•![]() DDoS detector—Detects an anomaly in the connection rate coming to an IP address, which means that it is being attacked. The attack can be by either a single IP address (DoS) or multiple IP addresses.
DDoS detector—Detects an anomaly in the connection rate coming to an IP address, which means that it is being attacked. The attack can be by either a single IP address (DoS) or multiple IP addresses.

Note ![]() When the IP address common to all flows of an attack is on the network side, the Cisco SCE may require more flows (than the configured threshold) to detect the attack. For example, on Cisco SCE 2000, if the configured threshold is 100 flows per second, these type of attacks are detected only if there are more than 300 flows per second.
When the IP address common to all flows of an attack is on the network side, the Cisco SCE may require more flows (than the configured threshold) to detect the attack. For example, on Cisco SCE 2000, if the configured threshold is 100 flows per second, these type of attacks are detected only if there are more than 300 flows per second.
For all kinds of anomaly detection conditions, maximum flexibility is provided by the ability to define detection thresholds and the trigger actions to be taken for each:
•![]() Flow direction
Flow direction
•![]() Flow protocol
Flow protocol
•![]() (Optional) Port uniqueness for TCP and UDP
(Optional) Port uniqueness for TCP and UDP
Note ![]() The GUI configuration described here replaces the CLI command set for configuring the Attack Filtering Module of the Cisco SCE platform, which was available in previous releases.
The GUI configuration described here replaces the CLI command set for configuring the Attack Filtering Module of the Cisco SCE platform, which was available in previous releases.
Anomaly Detection Parameters
For each anomaly detector category (Scan/Sweep, DoS, DDoS) there is one default detector. You can add additional detectors of each category. Detectors in each category are checked in order; the first match (according to the threshold settings of the detector) triggers detection. You set the order in which detectors are checked; the default detector is checked last.
Anomaly detectors can contain up to 12 anomaly types associated with malicious traffic:
•![]() Network initiated—Malicious traffic initiated from the network side:
Network initiated—Malicious traffic initiated from the network side:
–![]() TCP—Aggregate TCP traffic on all ports
TCP—Aggregate TCP traffic on all ports
–![]() TCP Specific Ports—TCP traffic on any single port
TCP Specific Ports—TCP traffic on any single port
–![]() UDP—Aggregate UDP traffic on all ports
UDP—Aggregate UDP traffic on all ports
–![]() UDP Specific Ports—UDP traffic on any single port
UDP Specific Ports—UDP traffic on any single port
–![]() ICMP—Aggregate ICMP traffic on all ports
ICMP—Aggregate ICMP traffic on all ports
–![]() Other—Aggregate traffic using other protocol types on all ports
Other—Aggregate traffic using other protocol types on all ports
•![]() Subscriber initiated—Malicious traffic initiated from the subscriber side:
Subscriber initiated—Malicious traffic initiated from the subscriber side:
–![]() TCP
TCP
–![]() TCP Specific Ports
TCP Specific Ports
–![]() UDP
UDP
–![]() UDP Specific Ports
UDP Specific Ports
–![]() ICMP
ICMP
–![]() Other
Other
Note ![]() ICMP and Other anomaly types are not available for DoS attack detectors.
ICMP and Other anomaly types are not available for DoS attack detectors.
Each anomaly type on a detector has the following attributes associated with it:
•![]() Detection thresholds—There are two thresholds, crossing either of them means that an attack is defined to be in progress:
Detection thresholds—There are two thresholds, crossing either of them means that an attack is defined to be in progress:
–![]() Session Rate threshold—The number of sessions (per second) over specified ports for a single IP address that trigger the anomaly detection condition.
Session Rate threshold—The number of sessions (per second) over specified ports for a single IP address that trigger the anomaly detection condition.
–![]() Suspected sessions threshold—Suspected sessions are sessions that are not properly established (for TCP), or that are unidirectional sessions (for other protocols). Exceeding both the Suspected Session Rate and the Suspected Session Ratio triggers the anomaly detection condition. (A relatively high session rate with a low response rate typically indicates malicious activity.)
Suspected sessions threshold—Suspected sessions are sessions that are not properly established (for TCP), or that are unidirectional sessions (for other protocols). Exceeding both the Suspected Session Rate and the Suspected Session Ratio triggers the anomaly detection condition. (A relatively high session rate with a low response rate typically indicates malicious activity.)
Suspected Session Rate—The number of suspected sessions (per second) over specified ports for a single IP address.
Suspected Session Ratio—The ratio (as a percentage) between the suspected session rate and the total session rate. A high ratio indicates that many sessions received no response, an indication of malicious activity.
•![]() Actions—Zero or more of the following actions may be taken when an anomaly detection condition is triggered (by default, no action is enabled):
Actions—Zero or more of the following actions may be taken when an anomaly detection condition is triggered (by default, no action is enabled):
Note ![]() Logging of the anomaly to an on-device log file and generation of RDRs is not configurable per anomaly type.
Logging of the anomaly to an on-device log file and generation of RDRs is not configurable per anomaly type.
–![]() Alert User—Generate an SNMP trap indicating the beginning and end of an anomaly. For details on SNMP traps, see the "SCA BB Proprietary MIB Reference" chapter of Cisco Service Control Application for Broadband Reference Guide for information about the Cisco proprietary MIB.
Alert User—Generate an SNMP trap indicating the beginning and end of an anomaly. For details on SNMP traps, see the "SCA BB Proprietary MIB Reference" chapter of Cisco Service Control Application for Broadband Reference Guide for information about the Cisco proprietary MIB.
–![]() Notify Subscriber—Notify the relevant subscriber of the malicious activity by redirecting the browsing sessions to a captive portal. To configure network attack subscriber notification, see "Managing Subscriber Notifications" section.
Notify Subscriber—Notify the relevant subscriber of the malicious activity by redirecting the browsing sessions to a captive portal. To configure network attack subscriber notification, see "Managing Subscriber Notifications" section.
–![]() Block Attack—Block the relevant sessions. Blocking is performed based on the specification of the malicious traffic that triggered the anomaly detection condition. If subscriber notification is enabled for the anomaly type, blocking is not applied to the port relevant for browsing (by default, this is TCP port 80; see "Managing Advanced Service Configuration Options" section).
Block Attack—Block the relevant sessions. Blocking is performed based on the specification of the malicious traffic that triggered the anomaly detection condition. If subscriber notification is enabled for the anomaly type, blocking is not applied to the port relevant for browsing (by default, this is TCP port 80; see "Managing Advanced Service Configuration Options" section).
User-defined detectors can also have one or more of the following attributes:
•![]() IP address list—Limit detection to the listed IP address ranges. This applies to the source IP when detecting IP sweeps and port scans. It applies to the destination IP when detecting DoS and DDoS attacks.
IP address list—Limit detection to the listed IP address ranges. This applies to the source IP when detecting IP sweeps and port scans. It applies to the destination IP when detecting DoS and DDoS attacks.
•![]() TCP port list—Limit detection to the listed destination TCP ports. This list is applied to TCP Specific Ports anomaly types only.
TCP port list—Limit detection to the listed destination TCP ports. This list is applied to TCP Specific Ports anomaly types only.
•![]() UDP port list—Limit detection to the listed destination UDP ports. This list is applied to UDP Specific Ports anomaly types only.
UDP port list—Limit detection to the listed destination UDP ports. This list is applied to UDP Specific Ports anomaly types only.
How to View Anomaly Detection Settings
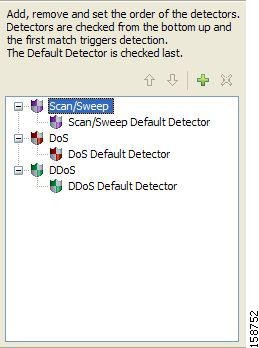
You can view a list of all anomaly detectors. The anomaly detectors are displayed in a tree, grouped according to detector category (Scan/Sweep, DoS, or DDoS).
For each anomaly detector, you can view its associated parameters and see a list of all anomaly types included in the detector, together with their parameters.
Step 1 ![]() In the Service Security Dashboard, in the Anomaly Based Detection of Malicious Traffic pane, click Configure.
In the Service Security Dashboard, in the Anomaly Based Detection of Malicious Traffic pane, click Configure.
The Anomaly Detection Settings dialog box appears.
The detector tree is displayed in the left area of the dialog box; the right area is empty (Figure 10-2).
Figure 10-2 Detector Tree
Step 2 ![]() In the detector tree, select a detector.
In the detector tree, select a detector.
The detector parameters are displayed in the upper right area of the dialog box (Figure 10-3).
Figure 10-3 Detector Parameters
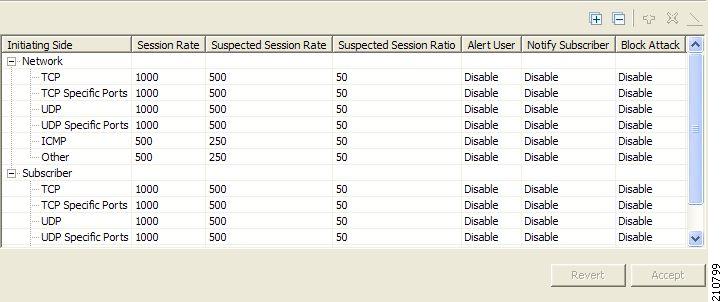
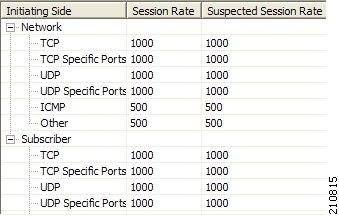
The anomaly types defined for a detector are listed in the lower right area of the dialog box, together with the value of each parameter. The following screen capture shows the default parameter values for the Scan/Sweep default detector (Figure 10-4).
Figure 10-4 Detector Defined Anomaly Types
If unidirectional classification is enabled, the Suspected Session Rate is set equal to the Session Rate, which effectively disables anomaly detection by the suspected session trigger (Figure 10-5).
Figure 10-5 Session Rate to Suspected Session Rate Comparison
Step 3 ![]() Click OK.
Click OK.
The Anomaly Detection Settings dialog box closes.
How to Add Anomaly Detectors
You can add new anomaly detectors. A service configuration can contain up to 100 anomaly detectors.
You define IP address ranges and TCP and UDP ports for the new detector, and one anomaly type.
After you have defined the detector, you can add other anomaly types (see "Editing Anomaly Detectors" section).
Step 1 ![]() In the Service Security Dashboard, in the Anomaly Based Detection of Malicious Traffic pane, click Configure.
In the Service Security Dashboard, in the Anomaly Based Detection of Malicious Traffic pane, click Configure.
The Anomaly Detection Settings dialog box appears.
Step 2 ![]() In the detector tree, select a detector category.
In the detector tree, select a detector category.
Step 3 ![]() Click the Add (
Click the Add ( ) icon.
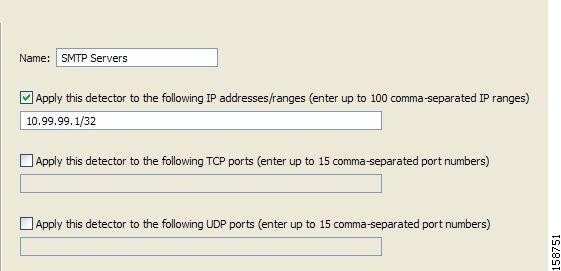
The Anomaly Detector Creation wizard appears (Figure 10-6), open to the Malicious Traffic Detector page.
Figure 10-6 Anomaly Detector Creation Wizard - Malicious Traffic Detector
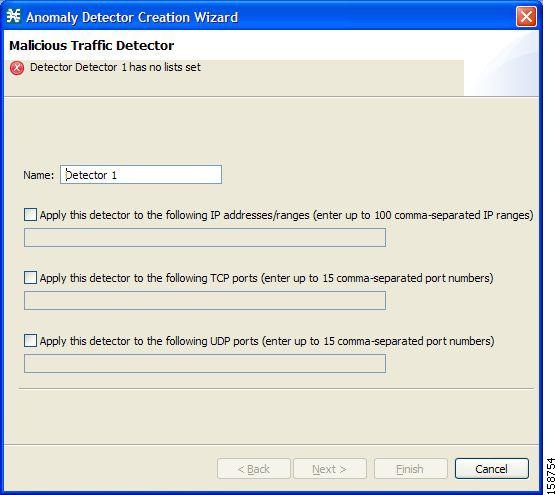
Step 4 ![]() In the Name field, enter a meaningful name for the detector.
In the Name field, enter a meaningful name for the detector.
Step 5 ![]() Check one or more of the check boxes to limit the scope of the detector.
Check one or more of the check boxes to limit the scope of the detector.
The relevant fields are enabled.
Step 6 ![]() Enter lists of IP addresses or ports in the relevant fields.
Enter lists of IP addresses or ports in the relevant fields.
Step 7 ![]() Click Next.
Click Next.
The Malicious Traffic Characteristics for a WORM attack page of the Anomaly Detector Creation wizard opens (Figure 10-7).
Figure 10-7 Malicious Traffic Characteristics for a Worm Attack
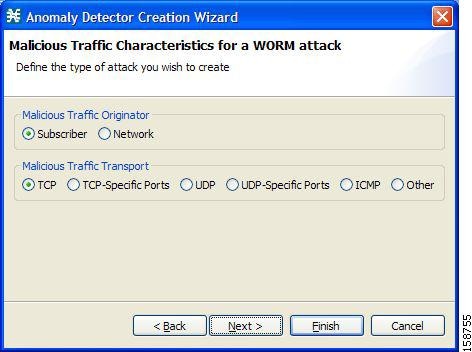
Step 8 ![]() Depending on the detector type that you are defining, select the originating side or the target side.
Depending on the detector type that you are defining, select the originating side or the target side.
•![]() If you are defining a Scan/Sweep detector or a DoS detector, select the originating side for the anomaly type you are defining.
If you are defining a Scan/Sweep detector or a DoS detector, select the originating side for the anomaly type you are defining.
•![]() If you are defining a DDoS detector, select the target side for the anomaly type you are defining.
If you are defining a DDoS detector, select the target side for the anomaly type you are defining.
Step 9 ![]() Select a transport type for the anomaly type that you are defining.
Select a transport type for the anomaly type that you are defining.
Step 10 ![]() Click Next.
Click Next.
The Anomaly Detection Thresholds page of the Anomaly Detector Creation wizard opens (Figure 10-8).
Figure 10-8 Anomaly Detection Thresholds
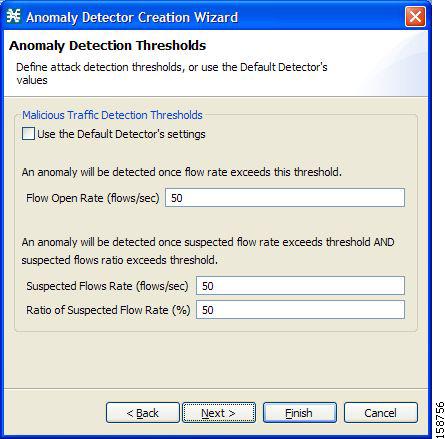
Step 11 ![]() Set the detector settings for this anomaly type.
Set the detector settings for this anomaly type.
Do one of the following:
•![]() To use the setting for the default detector, check the Use the Default Detector's settings check box.
To use the setting for the default detector, check the Use the Default Detector's settings check box.
•![]() Enter values in the Flow Open Rate, Suspected Flows Rate, and Ratio of Suspected Flow Rate fields.
Enter values in the Flow Open Rate, Suspected Flows Rate, and Ratio of Suspected Flow Rate fields.
Step 12 ![]() Click Next.
Click Next.
The Anomaly Detection Action Settings page of the Anomaly Detector Creation wizard opens (Figure 10-9).
Figure 10-9 Anomaly Detection Action Settings
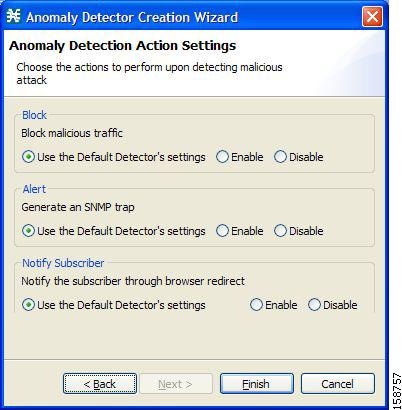
Step 13 ![]() Select Block, Alert, and Notify Subscriber actions.
Select Block, Alert, and Notify Subscriber actions.
Step 14 ![]() Click Finish.
Click Finish.
The Anomaly Detector Creation wizard closes.
The new detector is added to the detector tree.
What to Do Next
You can now add additional anomaly types to the detector. (See "Editing Anomaly Detectors" section.)
Editing Anomaly Detectors
You can perform the following actions on a user-defined anomaly detector:
•![]() Edit detector parameters.
Edit detector parameters.
•![]() Edit anomaly types.
Edit anomaly types.
•![]() Add anomaly types.
Add anomaly types.
•![]() Delete anomaly types.
Delete anomaly types.
•![]() Change the order of the detectors in the detector tree.
Change the order of the detectors in the detector tree.
For each detector category, detectors are checked, bottom-up, in the order that they are listed in the detector tree; the default detector is checked last.
You can edit the anomaly types of the three default detectors.
How to Edit Detector Parameters
Step 1 ![]() In the Service Security Dashboard, in the Anomaly Based Detection of Malicious Traffic pane, click Configure.
In the Service Security Dashboard, in the Anomaly Based Detection of Malicious Traffic pane, click Configure.
The Anomaly Detection Settings dialog box appears.
Step 2 ![]() In the detector tree, select a detector.
In the detector tree, select a detector.
The detector parameters are displayed in the upper right area of the dialog box.
Step 3 ![]() In the Name field, enter a new name for the detector.
In the Name field, enter a new name for the detector.
Step 4 ![]() Check or uncheck the IP address range and ports check boxes.
Check or uncheck the IP address range and ports check boxes.
Step 5 ![]() Enter or modify lists of IP addresses or ports in the relevant fields.
Enter or modify lists of IP addresses or ports in the relevant fields.
Step 6 ![]() Click OK.
Click OK.
The Anomaly Detection Settings dialog box closes.
Your changes are saved.
How to Edit Anomaly Types
Step 1 ![]() In the Service Security Dashboard, in the Anomaly Based Detection of Malicious Traffic pane, click Configure.
In the Service Security Dashboard, in the Anomaly Based Detection of Malicious Traffic pane, click Configure.
The Anomaly Detection Settings dialog box appears.
Step 2 ![]() In the detector tree, select a detector.
In the detector tree, select a detector.
Information about the anomaly types is displayed in the lower right area of the dialog box.
Step 3 ![]() Double-click an anomaly type.
Double-click an anomaly type.
The Anomaly Detector Creation wizard appears, open to the Anomaly Detection Thresholds page (see "How to Add an Anomaly Type" section).
Step 4 ![]() Set the detector settings for this anomaly type.
Set the detector settings for this anomaly type.
Do one of the following:
•![]() To use the setting of the default detector, check the Use the Default Detector's settings check box.
To use the setting of the default detector, check the Use the Default Detector's settings check box.
•![]() Change the values in the Flow Open Rate, Suspected Flows Rate, and Ratio of Suspected Flow Rate fields.
Change the values in the Flow Open Rate, Suspected Flows Rate, and Ratio of Suspected Flow Rate fields.
Step 5 ![]() Click Next.
Click Next.
The Anomaly Detection Action Settings page of the Anomaly Detector Creation wizard opens.
Step 6 ![]() Change Block, Alert, and Notify Subscriber actions.
Change Block, Alert, and Notify Subscriber actions.
Step 7 ![]() Click Finish.
Click Finish.
The Anomaly Detector Creation wizard closes.
The anomaly type is updated with your changes.
Step 8 ![]() Repeat Steps 3 to 7 (or Steps 2 to 7) for other anomaly types.
Repeat Steps 3 to 7 (or Steps 2 to 7) for other anomaly types.
Step 9 ![]() Click OK.
Click OK.
The Anomaly Detection Settings dialog box closes.
How to Add an Anomaly Type
Step 1 ![]() In the Service Security Dashboard, in the Anomaly Based Detection of Malicious Traffic pane, click Configure.
In the Service Security Dashboard, in the Anomaly Based Detection of Malicious Traffic pane, click Configure.
The Anomaly Detection Settings dialog box appears.
Step 2 ![]() In the detector tree, select a detector.
In the detector tree, select a detector.
The anomaly types are listed in the lower right area of the dialog box.
Step 3 ![]() Click the Create New Detector Item Under Detector Items Feature () icon.
Click the Create New Detector Item Under Detector Items Feature () icon.
The Anomaly Detector Creation wizard appears, open to the Malicious Traffic Characteristics for a WORM attack page (see "How to Add Anomaly Detectors" section).
Step 4 ![]() Select an origin for the anomaly type you are defining.
Select an origin for the anomaly type you are defining.
Step 5 ![]() Select a transport type for the anomaly type you are defining.
Select a transport type for the anomaly type you are defining.
Step 6 ![]() Click Next.
Click Next.
The Anomaly Detection Thresholds page of the Anomaly Detector Creation wizard opens.
Step 7 ![]() Set the detector settings for this anomaly type.
Set the detector settings for this anomaly type.
Do one of the following:
•![]() To use the settings of the default detector, check the Use the Default Detector's settings check box.
To use the settings of the default detector, check the Use the Default Detector's settings check box.
•![]() Enter values in the Flow Open Rate, Suspected Flows Rate, and Ratio of Suspected Flow Rate fields.
Enter values in the Flow Open Rate, Suspected Flows Rate, and Ratio of Suspected Flow Rate fields.
Step 8 ![]() Click Next.
Click Next.
The Anomaly Detection Action Settings page of the Anomaly Detector Creation wizard opens.
Step 9 ![]() Select Block, Alert, and Notify Subscriber actions.
Select Block, Alert, and Notify Subscriber actions.
Step 10 ![]() Click Finish.
Click Finish.
The Anomaly Detector Creation wizard closes.
The new anomaly type is added to the anomaly type list.
Step 11 ![]() Repeat Steps 3 to 10 (or Steps 2 to 10) for other anomaly types.
Repeat Steps 3 to 10 (or Steps 2 to 10) for other anomaly types.
Step 12 ![]() Click OK.
Click OK.
The Anomaly Detection Settings dialog box closes.
How to Delete an Anomaly Type
Step 1 ![]() In the Service Security Dashboard, in the Anomaly Based Detection of Malicious Traffic pane, click Configure.
In the Service Security Dashboard, in the Anomaly Based Detection of Malicious Traffic pane, click Configure.
The Anomaly Detection Settings dialog box appears.
Step 2 ![]() In the detector tree, select a detector.
In the detector tree, select a detector.
The anomaly types are listed in the lower right area of the dialog box.
Step 3 ![]() In the anomaly type list, select an anomaly type.
In the anomaly type list, select an anomaly type.
Step 4 ![]() Click the Delete (
Click the Delete ( ) icon.
The selected anomaly type is deleted from the anomaly type list.
Step 5 ![]() Repeat Steps 3 and 4 (or Steps 2 to 4) for other anomaly types.
Repeat Steps 3 and 4 (or Steps 2 to 4) for other anomaly types.
Step 6 ![]() Click OK.
Click OK.
The Anomaly Detection Settings dialog box closes.
How to Change the Order in which Detectors are Checked
Step 1 ![]() In the Service Security Dashboard, in the Anomaly Based Detection of Malicious Traffic pane, click Configure.
In the Service Security Dashboard, in the Anomaly Based Detection of Malicious Traffic pane, click Configure.
The Anomaly Detection Settings dialog box appears.
Step 2 ![]() In the detector tree, select a detector.
In the detector tree, select a detector.
The move up arrow, the move down arrow, or both are enabled, depending on the detectors location in the tree (Figure 10-10).
Figure 10-10 Detector Tree
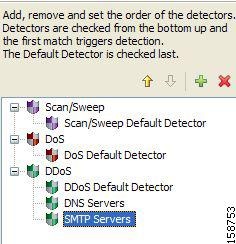
Step 3 ![]() Using these navigation arrows, move the detector to its desired location.
Using these navigation arrows, move the detector to its desired location.
Step 4 ![]() Repeat Steps 2 and 3 for other detectors.
Repeat Steps 2 and 3 for other detectors.
Step 5 ![]() Click OK.
Click OK.
The Anomaly Detection Settings dialog box closes.
Your changes are saved.
How to Delete Anomaly Detectors
You can delete any or all user-defined detectors.
You cannot delete the three default detectors.
Step 1 ![]() In the Service Security Dashboard, in the Anomaly Based Detection of Malicious Traffic pane, click Configure.
In the Service Security Dashboard, in the Anomaly Based Detection of Malicious Traffic pane, click Configure.
The Anomaly Detection Settings dialog box appears.
Step 2 ![]() In the detector tree, select one or more user-defined detectors.
In the detector tree, select one or more user-defined detectors.
Step 3 ![]() Click the Delete () icon.
Click the Delete () icon.
A Confirm Delete message appears (Figure 10-11).
Figure 10-11 Confirm Delete
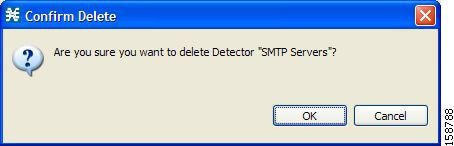
Step 4 ![]() Click OK.
Click OK.
The selected detectors are deleted and are no longer displayed in the detector tree.
Step 5 ![]() Click OK.
Click OK.
The Anomaly Detection Settings dialog box closes.
Managing Spam Detection
The anomalous e-mail detection method monitors SMTP session rates for individual subscribers. A high rate of SMTP sessions from an individual subscriber is usually an indicator of malicious activity that involves sending e-mail (either mail-based viruses or spam-zombie activity).
This method works only if the system is configured in subscriber-aware or anonymous subscriber mode. This allows the Cisco SCE to accurately account the number of SMTP sessions generated per subscriber.
The detection method is based on the following:
•![]() Typical broadband subscribers generate few SMTP sessions (at most a single session each time they send an e-mail message).
Typical broadband subscribers generate few SMTP sessions (at most a single session each time they send an e-mail message).
•![]() Typical broadband subscribers normally use the SMTP server of the ISP (as configured in their mail client) as their only mail relay, and do not communicate with off-net SMTP servers.
Typical broadband subscribers normally use the SMTP server of the ISP (as configured in their mail client) as their only mail relay, and do not communicate with off-net SMTP servers.
•![]() Spam zombies create many SMTP sessions, mainly to off-net servers (the mail servers of the destined recipient of the messages).
Spam zombies create many SMTP sessions, mainly to off-net servers (the mail servers of the destined recipient of the messages).
When configuring spam detection, you select an appropriate service to monitor. By default, this is the built-in SMTP service.
How to Configure Spam Detection Settings
Step 1 ![]() In the Service Security Dashboard, in the Spam Zombies and Email Viruses Detection pane, click Configure.
In the Service Security Dashboard, in the Spam Zombies and Email Viruses Detection pane, click Configure.
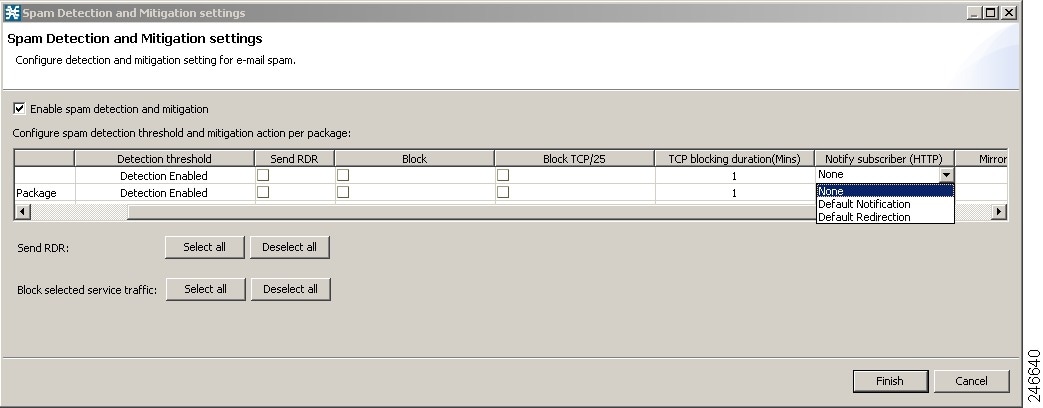
The Spam Detection and Mitigation settings dialog box appears (Figure 10-12).
Figure 10-12 Spam Detection and Mitigation Settings
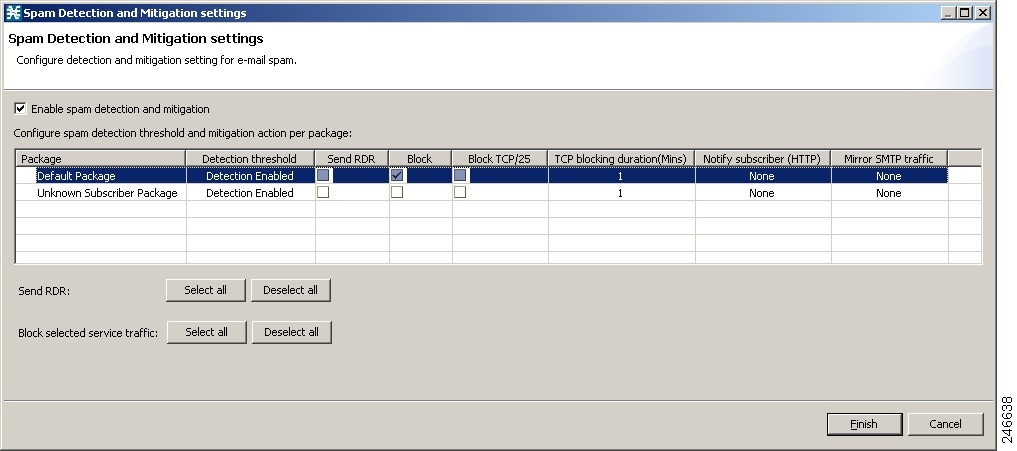
Step 2 ![]() (Optional) To disable spam detection, uncheck the Enable Spam detection and mitigation check box. All other fields are disabled. If you are disabling spam detection, continue at Step 6.
(Optional) To disable spam detection, uncheck the Enable Spam detection and mitigation check box. All other fields are disabled. If you are disabling spam detection, continue at Step 6.
Step 3 ![]() For each package, do the following:
For each package, do the following:
a. ![]() Define the quota to be used for indicating anomalous e-mail activity. We recommend that the values for these fields should be based on some baseline monitoring of subscriber activity.
Define the quota to be used for indicating anomalous e-mail activity. We recommend that the values for these fields should be based on some baseline monitoring of subscriber activity.
–![]() Click in the Detection threshold column. A More (
Click in the Detection threshold column. A More ( ) button appears.
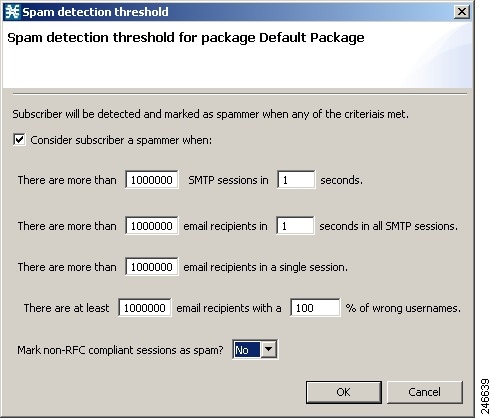
–![]() Click the More button. The Spam Detection Threshold window appears (Figure 10-13).
Click the More button. The Spam Detection Threshold window appears (Figure 10-13).
–![]() Define when to consider the subscriber as a spammer.
Define when to consider the subscriber as a spammer.
–![]() Define whether to mark non-RFC compliant sessions as spam.
Define whether to mark non-RFC compliant sessions as spam.
–![]() Click OK.
Click OK.
Figure 10-13 Spam Detection Threshold
b. ![]() Define one or more actions to be taken upon detecting mass-mailing activity. Available actions are:
Define one or more actions to be taken upon detecting mass-mailing activity. Available actions are:
–![]() Send RDR—Sends a Raw Data Record (RDR) to the Collection Manager (CM). A second RDR is sent when the status of the subscriber as a spammer is removed. The Collection Manager collects these RDRs in CSV files for logging purposes. Alternatively, you can implement your own RDR collectors to receive these RDRs and respond in real-time.
Send RDR—Sends a Raw Data Record (RDR) to the Collection Manager (CM). A second RDR is sent when the status of the subscriber as a spammer is removed. The Collection Manager collects these RDRs in CSV files for logging purposes. Alternatively, you can implement your own RDR collectors to receive these RDRs and respond in real-time.
–![]() Block—Blocks SMTP as a classified service.
Block—Blocks SMTP as a classified service.
–![]() Block TCP/25—Blocks only the TCP port 25.
Block TCP/25—Blocks only the TCP port 25.
–![]() TCP blocking duration (Mins)—Defines the duration for which the TCP port 25 should be blocked.
TCP blocking duration (Mins)—Defines the duration for which the TCP port 25 should be blocked.
–![]() Notify Subscriber (HTTP)—Redirects the subscriber browsing sessions to a captive portal presenting a message from the operator. This is done using "subscriber notification". Options are None, Default Notification, Default Redirection.
Notify Subscriber (HTTP)—Redirects the subscriber browsing sessions to a captive portal presenting a message from the operator. This is done using "subscriber notification". Options are None, Default Notification, Default Redirection.
–![]() Mirror SMTP traffic—Diverts spam SMTP traffic to an inline spam detection service.
Mirror SMTP traffic—Diverts spam SMTP traffic to an inline spam detection service.
Note ![]() For the send RDR action, one RDR is sent when the subscriber is marked as a spammer and a second RDR is sent once the subscriber is no longer considered a spammer. However, when using the block and mirror actions, the action begins when the subscriber is marked as a spammer and is maintained until the subscriber is no longer considered a spammer.
For the send RDR action, one RDR is sent when the subscriber is marked as a spammer and a second RDR is sent once the subscriber is no longer considered a spammer. However, when using the block and mirror actions, the action begins when the subscriber is marked as a spammer and is maintained until the subscriber is no longer considered a spammer.
Note ![]() Block SMTP Traffic and Mirror SMTP traffic cannot both be selected. If you select one, the other is disabled.
Block SMTP Traffic and Mirror SMTP traffic cannot both be selected. If you select one, the other is disabled.
Step 4 ![]() If you selected Notify Subscriber (HTTP), choose or enter a notify subscriber.
If you selected Notify Subscriber (HTTP), choose or enter a notify subscriber.
Step 5 ![]() If you selected Mirror SMTP traffic, choose a server group.
If you selected Mirror SMTP traffic, choose a server group.
Step 6 ![]() Click Finish.
Click Finish.
The Spam Detection and Mitigation settings dialog box closes.
How to Configure Outgoing Spam Mitigation Settings per Package from Subscriber Policies
To configure the outgoing spam mitigation settings per package from subscriber policies, complete these steps:
Step 1 ![]() In the Service Configuration Editor Policies tab, select a Package from the Subscriber Policies.
In the Service Configuration Editor Policies tab, select a Package from the Subscriber Policies.
Step 2 ![]() Right-click on the Package and select Edit Package. The Package Settings window appears.
Right-click on the Package and select Edit Package. The Package Settings window appears.
Step 3 ![]() Click Spam Settings tab to view the Spam Detection Settings and Spam Action Settings.
Click Spam Settings tab to view the Spam Detection Settings and Spam Action Settings.
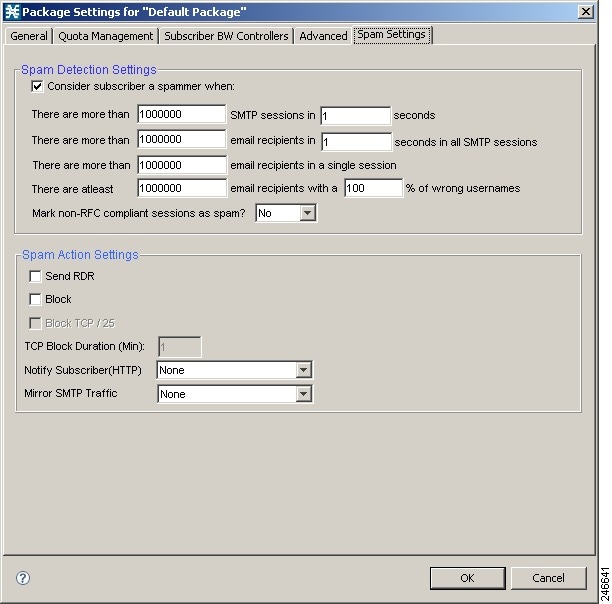
Step 4 ![]() Select the Consider Subscriber a spammer when: check box to enable the spam detection.
Select the Consider Subscriber a spammer when: check box to enable the spam detection.
Step 5 ![]() Define when to consider the subscriber a spammer and the actions to be taken.
Define when to consider the subscriber a spammer and the actions to be taken.
Step 6 ![]() Click OK.
Click OK.
For more details on spam mitigation, see the Cisco Service Control Service Security: Outgoing Spam Mitigation Solution Guide.
Viewing Malicious Traffic Reports
Information about detected traffic anomalies is stored in the Collection Manager database. You can use this information for network trending, detection of new threats, and tracking of malicious hosts or subscribers.
•![]() How to View a Service Security Report
How to View a Service Security Report
Malicious Traffic Reports
A number of reports dealing with malicious traffic can be displayed in the SCA Reporter tool:
•![]() Global reports:
Global reports:
–![]() Global Scan or Attack Rate
Global Scan or Attack Rate
–![]() Global DoS Rate
Global DoS Rate
–![]() Infected Subscribers
Infected Subscribers
–![]() Infected Subscribers versus Active Subscribers
Infected Subscribers versus Active Subscribers
–![]() DoS Attacked Subscribers
DoS Attacked Subscribers
–![]() Top Scanned or Attacked ports
Top Scanned or Attacked ports
•![]() Individual subscriber or hosts reports:
Individual subscriber or hosts reports:
–![]() Top Scanning or Attacking hosts
Top Scanning or Attacking hosts
–![]() Top DoS Attacked hosts
Top DoS Attacked hosts
–![]() Top DoS Attacked Subscribers
Top DoS Attacked Subscribers
–![]() Top Scanning or Attacking Subscribers
Top Scanning or Attacking Subscribers
How to View a Service Security Report
Step 1 ![]() In the Service Security Dashboard, in the relevant pane, click View Report.
In the Service Security Dashboard, in the relevant pane, click View Report.
A Choose a report dialog box appears, displaying a tree of relevant reports.
Step 2 ![]() Select a report from the report tree.
Select a report from the report tree.
Step 3 ![]() Click OK.
Click OK.
The Choose a report dialog box closes.
The Reporter tool opens in the Console, and displays the requested report.
Step 4 ![]() For information about manipulating and saving the report, see the "Working with Reports" chapter of Cisco Service Control Application Reporter User Guide.
For information about manipulating and saving the report, see the "Working with Reports" chapter of Cisco Service Control Application Reporter User Guide.
Filtering the Traffic Flows
Filter rules are part of service configurations. They allow you to instruct the Cisco SCE platform, based on a flow's Layer 3 and Layer 4 properties, to:
•![]() Bypass—Ignore the flow and transmit it unchanged.
Bypass—Ignore the flow and transmit it unchanged.
•![]() Quick forward—Duplicate the flow and send one copy directly to the transmit queue to ensure minimal delay. The second copy goes through the normal packet path.
Quick forward—Duplicate the flow and send one copy directly to the transmit queue to ensure minimal delay. The second copy goes through the normal packet path.
When a traffic flow enters the Cisco SCE platform, the platform checks whether a filter rule applies to this flow.
If a filter rule applies to this traffic flow, the Cisco SCE platform passes the traffic flow to its transmit queues. No RDR generation or service configuration enforcement is performed; these flows do not appear in any records generated for analysis purposes and are not controlled by any rule belonging to the active service configuration.
It is recommended that you add filter rules for OSS protocols (such as DHCP) and routing protocols (such as BGP) that might traverse the Cisco SCE platform. These protocols usually should not be affected by policy enforcement, and their low volume makes them insignificant for reporting.
A number of predefined filter rules are included in every new service configuration.
Note ![]() By default, some, but not all, of the predefined filter rules are active.
By default, some, but not all, of the predefined filter rules are active.
Flows of certain protocols can also be filtered according to the Layer 7 characteristics of the flow (see "Managing Advanced Service Configuration Options" section). Like other filtered flows, Layer 7 filtered flows are not controlled, but can be classified and reported. The flows of the protocols that can be filtered are typically short and their overall volume is negligible. So filtering these protocols has little effect on network bandwidth and on the accuracy of the Cisco SCA BB reports.
•![]() Information About Traffic Filtering
Information About Traffic Filtering
•![]() How to View Filter Rules for a Package
How to View Filter Rules for a Package
•![]() How to Add Filter Rules for IPv6 Configuration
How to Add Filter Rules for IPv6 Configuration
•![]() How to Activate and Deactivate Filter Rules
How to Activate and Deactivate Filter Rules
Information About Traffic Filtering
For certain types of traffic, service providers may need to reduce the latency and jitter introduced by the Cisco SCE platform or even to bypass the Cisco SCE platform to avoid traffic control as well. Typically, such decisions are made for a portion of the traffic, to reduce latency for delay sensitive applications, such as voice, and to bypass mission-critical traffic, such as routing protocols. The Cisco SCA BB Filtered Traffic mechanism is used to address this need.
Note ![]() To reduce latency, Cisco SCE platform automatically handles most voice traffic. For details, see "Automatic Quick Forwarding of Media Flows" section.
To reduce latency, Cisco SCE platform automatically handles most voice traffic. For details, see "Automatic Quick Forwarding of Media Flows" section.
•![]() The Cisco SCA BB Filtered Traffic Mechanism
The Cisco SCA BB Filtered Traffic Mechanism
•![]() Filter Rules and Service Rules
Filter Rules and Service Rules
•![]() Automatic Quick Forwarding of Media Flows
Automatic Quick Forwarding of Media Flows
The Cisco SCA BB Filtered Traffic Mechanism
The Cisco SCA BB Filtered Traffic mechanism reduces latency or completely bypasses portions of the traffic by defining filter rules that match relevant flows and assign the correct action to them. A filter rule matches a packet according to its Layer 3 and Layer 4 properties, such as IP address, port number, and DSCP ToS, as well as the Cisco SCE platform interface (subscriber or network) from which the packet arrived. For packets that match a filter rule, the following actions can be applied:
•![]() Bypass the current packet (to reduce latency and avoid traffic control).
Bypass the current packet (to reduce latency and avoid traffic control).
When this action is applied, the current packet is directly transmitted from the Cisco SCE platform without going through any service configuration processing or reporting. You must map the bypassed packet to a Class of Service (CoS) to assign it to one of the transmit queues of the Cisco SCE platform.
Possible values for CoS are BE, AF1, AF2, AF3, AF4, and EF; where EF implies high processing priority and the other classes imply normal processing priority.
•![]() Quick forward the flow (to reduce latency).
Quick forward the flow (to reduce latency).
When this action is applied, the current packet and all subsequent packets belonging to the same flow are duplicated and sent through two different paths: the original packet goes directly to the transmit queue, and thus has only a minimal delay, while a copy of the packet goes through the normal service configuration processing path for classification and reporting, and is then discarded.
•![]() Assign the flow to the high priority processing input queue (to reduce latency).
Assign the flow to the high priority processing input queue (to reduce latency).
Note ![]() Not all platforms support this option.
Not all platforms support this option.
When this action is applied, the current packet and all subsequent packets belonging to the same flow enter the high priority processing input queue. They go through the normal service configuration processing path ahead of other packets that arrive simultaneously. You should map the flow to the EF CoS to assign it to the high processing priority transmit queue of the Cisco SCE platform.
Note ![]() In an MPLS environment, the Cisco SCE platform does not map the DSCP bits to the EXP bits of the MPLS header.
In an MPLS environment, the Cisco SCE platform does not map the DSCP bits to the EXP bits of the MPLS header.
A filter rule can perform DSCP ToS marking (by changing the DSCP ToS field of the packet) of the matched traffic with any of the above actions.
Note ![]() DSCP ToS marking and the assignment to CoS only take place when the operational mode of the system is Full Functionality (see "System Operational Mode" section).
DSCP ToS marking and the assignment to CoS only take place when the operational mode of the system is Full Functionality (see "System Operational Mode" section).
The Cisco SCE processes the traffic based on the Class of Service (CoS). Possible values for CoS are BE, AF1, AF2, AF3, AF4, and EF; where EF implies high processing priority and the other classes imply normal processing priority.
In SCE 8000, if there are 4 output queues—EF, AFn,AF1, and BE, this is how the queues are prioritized:
•![]() EF—Gets the highest priority and strictly gets priority over all other queues.
EF—Gets the highest priority and strictly gets priority over all other queues.
•![]() AF1 and AFn (AF2, AF3, AF4)—Gets the weighted priority on top of AF1. For each n packets of AFn, one packet is sent for AF1. The value of n can be configured from the FPGA. The default value is 3.
AF1 and AFn (AF2, AF3, AF4)—Gets the weighted priority on top of AF1. For each n packets of AFn, one packet is sent for AF1. The value of n can be configured from the FPGA. The default value is 3.
•![]() BE—Gets lowest priority. BE packets are transmitted only if packets for transmission are not available in other queues.
BE—Gets lowest priority. BE packets are transmitted only if packets for transmission are not available in other queues.
The Cisco SCE transmits only the received packet and do not generate the traffic internally; other than rarely transmit inject for reset or redirect. So, there can never be a long time in which lower priority queues are starved.
When there are only buckets—EF and the rest. In CoS other than EF (AF1,AF2,AF3,AF4,BE), the order of priority would be AF1 > AF2 > and so on. However, the bandwidth is allocated in the order EF > AFn > AF1 > BE. Queues AF2, AF3, and AF4 would have the same weight.
Filter Rule Actions
The Bypass and Quick forward actions apply to different scopes of traffic:
•![]() The Bypass action only bypasses the current packet; every subsequent packet of the same flow goes through the Filtered Traffic mechanism. This means, for example, that when traffic is to be bypassed based on its destination port number, two rules should be created to match packets from both sides of a bidirectional flow.
The Bypass action only bypasses the current packet; every subsequent packet of the same flow goes through the Filtered Traffic mechanism. This means, for example, that when traffic is to be bypassed based on its destination port number, two rules should be created to match packets from both sides of a bidirectional flow.
For example, to bypass all traffic to destination port 23, two filter rules are needed, one for packets arriving from the subscriber side addressed to network side port 23, and another for packets arriving from the network side addressed to subscriber side port 23.
•![]() The Quick forward action is applied to the entire flow; once identified, all subsequent packets do not go through the filter rule mechanism, instead going through normal service configuration processing.
The Quick forward action is applied to the entire flow; once identified, all subsequent packets do not go through the filter rule mechanism, instead going through normal service configuration processing.
A packet may match more than one filter rule. If both Bypass and Quick forward are matched, the packet/flow is bypassed with minimum delay. Furthermore, if only Bypass is matched, the packet/flow is also be bypassed with minimum delay.
Filter Rules and Service Rules
Filter rule actions to reduce latency allow the flow to be controlled by the Cisco SCE platform. This means that the flow can be blocked or given limited bandwidth if it matches a service rule. For example, if a filter rule is applied to reduce latency, but a service configuration rule is applied to block the same traffic, the traffic is blocked.
The Bypass action is designed to avoid service configuration processing; bypassed traffic is not affected by service rules.
Automatic Quick Forwarding of Media Flows
The Cisco SCE platform reduces the latency of delay-sensitive voice and video media flows by applying the quick-forwarding action to SIP, MGCP, H323, Skinny, and RTSP media flows during classification. That is, when a media flow is classified as being of one of these types, it is subjected to quick forwarding immediately. The Cisco SCE platform does this automatically, regardless of filter rule configuration. These media flows might still be blocked or given limited bandwidth if they match a service rule.
Filtering L2TP Traffic
If you know the version of the L2TP tunnel that is being used, configure the relevant filters. If you do not know the version, enable filter for both type of tunnels (L2TPv2 and L2TPv3).
Note ![]() The L2TPv3 data encapsulation is done directly over IP with protocol ID 115. Cisco SCA BB provides a filter for this type of traffic and you can enable it from Cisco SCA BB.
The L2TPv3 data encapsulation is done directly over IP with protocol ID 115. Cisco SCA BB provides a filter for this type of traffic and you can enable it from Cisco SCA BB.
However, L2TPv2 protocol data encapsulation is done over UDP protocol at Layer 4 with default destination port 1701. Cisco SCA BB does not provide any filter for this type of traffic. To filter L2TPv2 traffic, create a new filter with the transport type as UDP and destination UDP port value as 1701.
How to View Filter Rules for a Package
You can view a list of the filter rules included in a service configuration.
The listing for each filter rule includes the name, the status, and a brief description (generated by the system) of the rule.
To see more information about a filter rule, open the Edit Filter Rule dialog box (see "How to Edit Filter Rules" section).
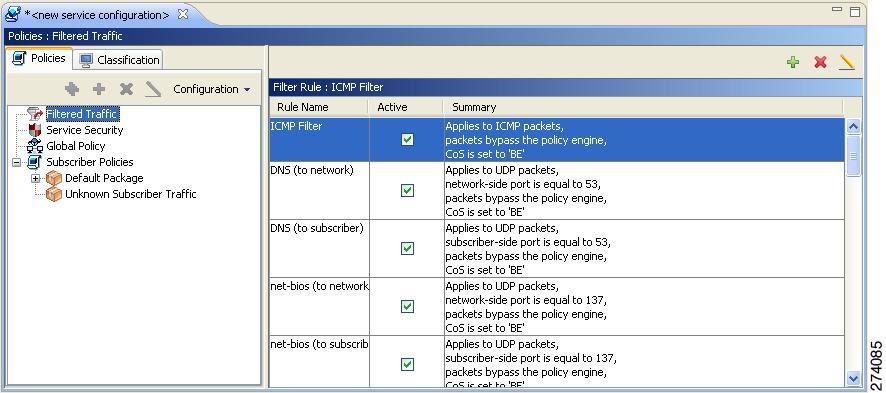
Step 1 ![]() In the Policies tab, select the Filtered Traffic node.
In the Policies tab, select the Filtered Traffic node.
A list of all filter rules is displayed in the right (Rule) pane (Figure 10-14).
Figure 10-14 Filter Rules
How to Add Filter Rules
The Add Filter Rule wizard guides you through the process of adding a filter rule.
Note ![]() You can use a maximum of 39 IPv4 and IPv6 rules combined on the Cisco SCE 8000 devices. The Cisco SCA BB applies one internal rule automatically.
You can use a maximum of 39 IPv4 and IPv6 rules combined on the Cisco SCE 8000 devices. The Cisco SCA BB applies one internal rule automatically.
Step 1 ![]() In the Policies tab of Service Configuration Editor window, select the Filtered Traffic node.
In the Policies tab of Service Configuration Editor window, select the Filtered Traffic node.
Step 2 ![]() Click (Add Rule) in the right (Rule) pane.
Click (Add Rule) in the right (Rule) pane.
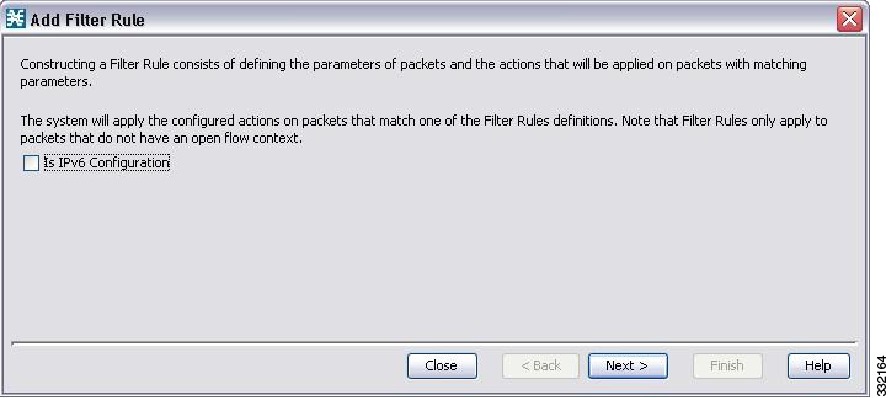
The Add Filter Rule wizard appears (Figure 10-15).
Figure 10-15 Add Filter Rule
Step 3 ![]() Click Next.
Click Next.
The Transport Type and Direction screen of the Add Filter Rule wizard appears (Figure 10-16).
Figure 10-16 Transport Type and Direction
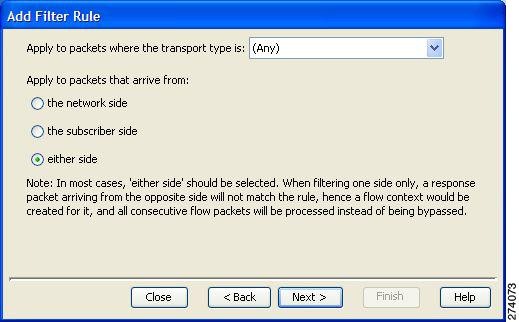
Step 4 ![]() Select the transport type and initiating side and click Next.
Select the transport type and initiating side and click Next.
The Subscriber-Side IP Address screen of the Add Filter Rule wizard appears (Figure 10-17).
Figure 10-17 Subscriber-Side IP Address
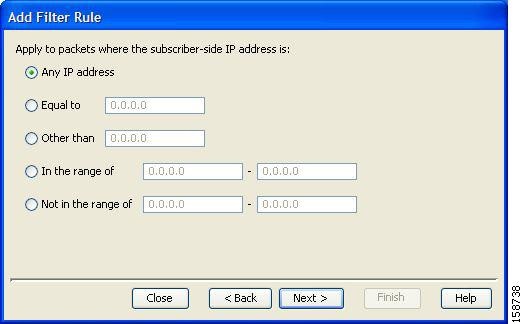
Step 5 ![]() Define the subscriber-side IP address and click Next.
Define the subscriber-side IP address and click Next.
The Network-Side IP Address screen of the Add Filter Rule wizard appears (Figure 10-18).
Figure 10-18 Network-Side IP Address
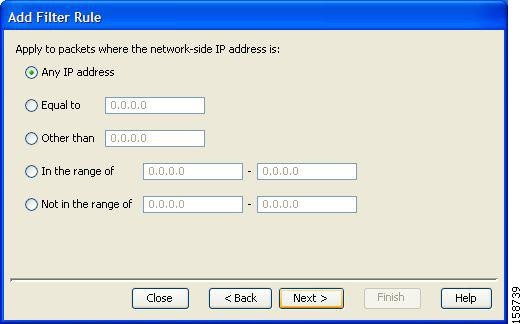
Step 6 ![]() Define the network-side IP address and click Next.
Define the network-side IP address and click Next.
If the transport type selected in Step 4 was not TCP or UDP, the ToS screen of the Add Filter Rule wizard
appears. Go to Step 9.
If the transport type selected in Step 4 was TCP or UDP, the Subscriber-Side Port screen of the Add Filter Rule wizard appears (Figure 10-19).
Figure 10-19 Subscriber-Side Port

Step 7 ![]() Define the subscriber-side port and click Next.
Define the subscriber-side port and click Next.
The Network-Side Port screen of the Add Filter Rule wizard appears (Figure 10-20).
Figure 10-20 Network-Side Port
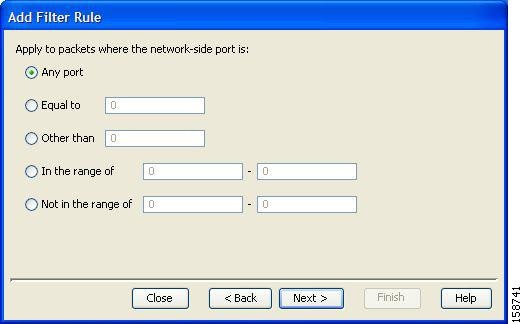
Step 8 ![]() Define the network-side port and click Next.
Define the network-side port and click Next.
The Type of Service (ToS) screen of the Add Filter Rule wizard appears (Figure 10-21).
Figure 10-21 ToS
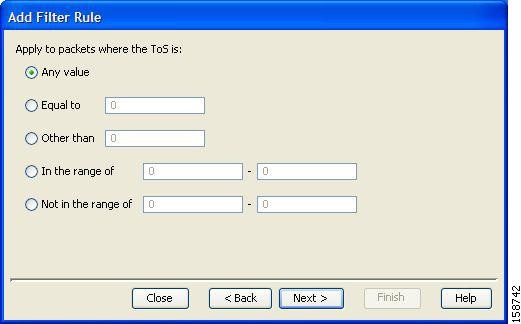
Step 9 ![]() Define the ToS and click Next.
Define the ToS and click Next.
Note ![]() The acceptable values for ToS are 0 to 63.
The acceptable values for ToS are 0 to 63.
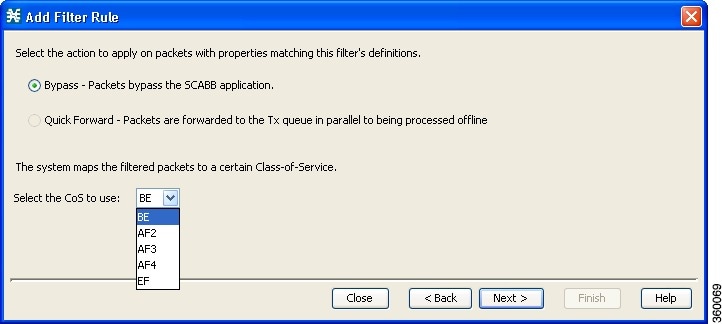
The Action and Class-of-Service screen of the Add Filter Rule wizard appears (Figure 10-22).
Figure 10-22 Action and Class-of-Service
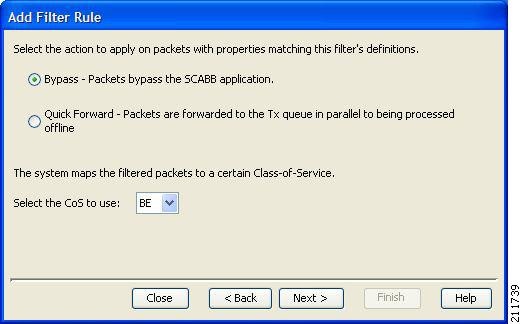
Step 10 ![]() Select the radio button for the required action.
Select the radio button for the required action.
•![]() Bypass —Packets that match this filter rule are not passed to Cisco SCA BB.
Bypass —Packets that match this filter rule are not passed to Cisco SCA BB.
•![]() Quick Forward —The Cisco SCE platform ensures low latency for packets that match this filter rule (use for delay sensitive flows). Packets are duplicated and passed to Cisco SCA BB for processing.
Quick Forward —The Cisco SCE platform ensures low latency for packets that match this filter rule (use for delay sensitive flows). Packets are duplicated and passed to Cisco SCA BB for processing.
Step 11 ![]() Select a Class-of-Service value, and click Next.
Select a Class-of-Service value, and click Next.
The ToS Marking screen of the Add Filter Rule wizard appears (Figure 10-23).
Figure 10-23 ToS Marking
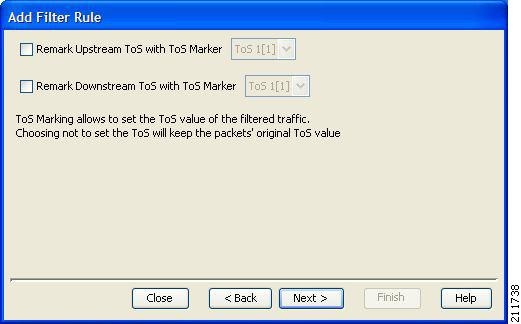
Step 12 ![]() (Optional) To change the DSCP ToS marker of packets in the filtered traffic, check the Remark Upstream ToS with ToS Marker and Remark Downstream ToS with ToS Marker check boxes, as required, select the required ToS marker from the drop-down list, and click Next.
(Optional) To change the DSCP ToS marker of packets in the filtered traffic, check the Remark Upstream ToS with ToS Marker and Remark Downstream ToS with ToS Marker check boxes, as required, select the required ToS marker from the drop-down list, and click Next.
•![]() Disabling directional DSCP ToS marking in the ToS Marking Settings dialog box (see "How to Manage DSCP ToS Marker Values" section) overrides DSCP ToS marking in that direction by a filter (that is, the DSCP ToS value are not changed). In this case, the Problems View displays a Warning.
Disabling directional DSCP ToS marking in the ToS Marking Settings dialog box (see "How to Manage DSCP ToS Marker Values" section) overrides DSCP ToS marking in that direction by a filter (that is, the DSCP ToS value are not changed). In this case, the Problems View displays a Warning.
•![]() If you filter for a flow in one direction in Step 4 but select ToS marking in the other direction in this Step, the filter rule is created, but no DSCP ToS remarking occurs. In this case, the Problems View displays a Warning.
If you filter for a flow in one direction in Step 4 but select ToS marking in the other direction in this Step, the filter rule is created, but no DSCP ToS remarking occurs. In this case, the Problems View displays a Warning.
•![]() If you select Quick Forward in the previous Step, Cisco SCA BB receives the original package and processes it. That is, the application see the original DSCP ToS value regardless of the ToS marking action selected in the filter rule.
If you select Quick Forward in the previous Step, Cisco SCA BB receives the original package and processes it. That is, the application see the original DSCP ToS value regardless of the ToS marking action selected in the filter rule.
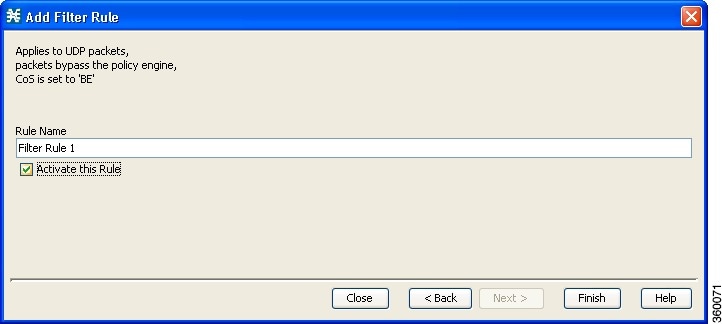
The Finish page of the Add Filter Rule wizard opens (Figure 10-24).
Figure 10-24 Finish
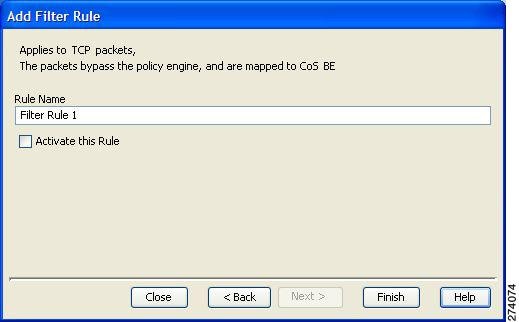
Step 13 ![]() In the Rule Name field, enter a unique name for the new filter rule.
In the Rule Name field, enter a unique name for the new filter rule.
Note ![]() You can use the default name for the filter rule. It is recommended that you enter a meaningful name.
You can use the default name for the filter rule. It is recommended that you enter a meaningful name.
Step 14 ![]() (Optional) To activate the filter rule, check the Activate this rule check box. Traffic is filtered according to the rule only when it is activated.
(Optional) To activate the filter rule, check the Activate this rule check box. Traffic is filtered according to the rule only when it is activated.
Step 15 ![]() Click Finish.
Click Finish.
The Add Filter Rule wizard closes. The filter rule is added and is displayed in the Filter Rule table.
How to Add Filter Rules for IPv6 Configuration
The Add Filter Rule wizard guides you through the process of adding a filter rule for IPv6 configuration.
Step 1 ![]() In the Policies tab of Service Configuration Editor window, select the Filtered Traffic node.
In the Policies tab of Service Configuration Editor window, select the Filtered Traffic node.
Step 2 ![]() Click (Add Rule) in the right (Rule) pane.
Click (Add Rule) in the right (Rule) pane.
The Add Filter Rule wizard appears (Figure 10-25).
Figure 10-25 Add Filter Rule Wizard
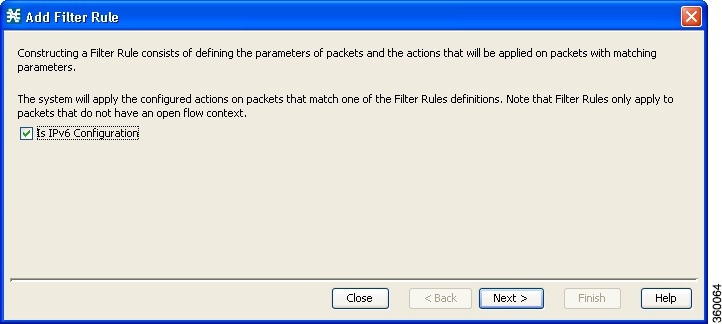
Step 3 ![]() Select the Is IPv6 Configuration check box and click Next.
Select the Is IPv6 Configuration check box and click Next.
The Transport Type and Direction screen of the Add Filter Rule wizard appears (Figure 10-26).
Figure 10-26 Transport Type and Direction
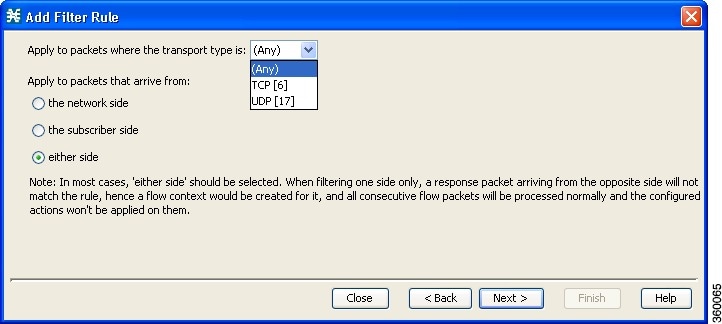
Step 4 ![]() Select the transport type and the initiating side and click Next.
Select the transport type and the initiating side and click Next.
The Subscriber-Side IP Address screen of the Add Filter Rule wizard appears (Figure 10-27).
Note ![]() The transport type drop-down will contain only the Transmission Control Protocol (TCP) and User Datagram Protocol (UDP) values.
The transport type drop-down will contain only the Transmission Control Protocol (TCP) and User Datagram Protocol (UDP) values.
Figure 10-27 Subscriber-Side IP Address
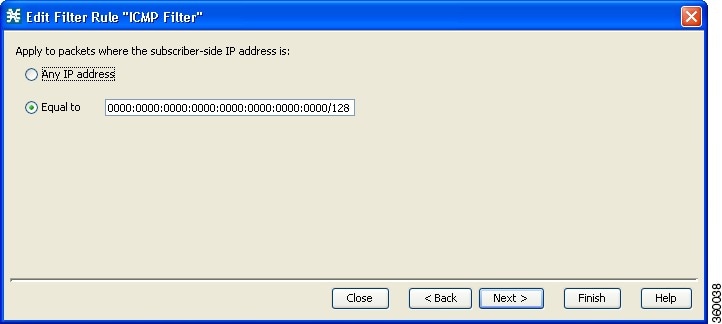
Step 5 ![]() Define the subscriber-side IP address and click Next.
Define the subscriber-side IP address and click Next.
The Network-Side IP Address screen of the Add Filter Rule wizard appears (Figure 10-28).
Figure 10-28 Network-Side IP Address
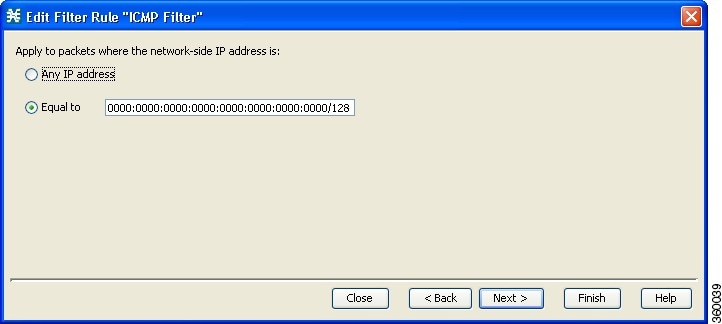
Step 6 ![]() Define the network-side IP address and click Next.
Define the network-side IP address and click Next.
Note ![]() Effective with Cisco SCE Release 4.0.0, you can use 128-bit masks for the subscriber side IP addresses and the network side IP addresses.
Effective with Cisco SCE Release 4.0.0, you can use 128-bit masks for the subscriber side IP addresses and the network side IP addresses.
If the transport type selected in Step 4 was not TCP or UDP, the ToS screen of the Add Filter Rule wizard appears. Go to Step 9.
If the transport type selected in Step 4 was TCP or UDP, the Subscriber-Side Port screen of the Add Filter Rule wizard appears (Figure 10-29).
Figure 10-29 Subscriber-Side Port
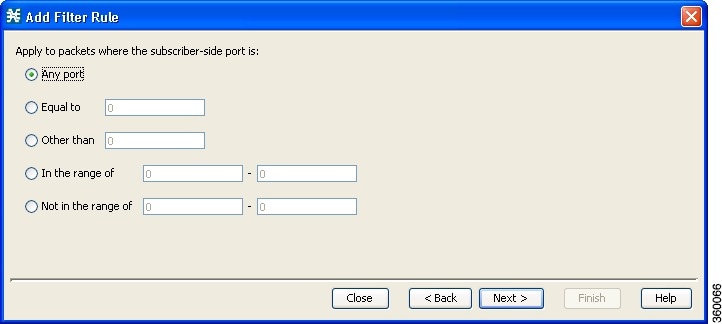
Step 7 ![]() Define the subscriber-side port and click Next.
Define the subscriber-side port and click Next.
The Network-Side Port screen of the Add Filter Rule wizard appears (Figure 10-30).
Figure 10-30 Network-Side Port

Step 8 ![]() Define the network-side port and click Next.
Define the network-side port and click Next.
The ToS screen of the Add Filter Rule wizard appears (Figure 10-31).
Figure 10-31 ToS

Step 9 ![]() Define the ToS and click Next.
Define the ToS and click Next.
Note ![]() The acceptable values for ToS are 0 to 63.
The acceptable values for ToS are 0 to 63.
The Action and Class-of-Service screen of the Add Filter Rule wizard appears (Figure 10-32).
Figure 10-32 Action and Class-of-Service
Step 10 ![]() Select the following radio button for the corresponding action:
Select the following radio button for the corresponding action:
Bypass —Packets that match this filter rule are not passed to Cisco SCA BB.
Note ![]() By default, the Quick Forward radio button is disabled.
By default, the Quick Forward radio button is disabled.
Step 11 ![]() Select a Class-of-Service value, and click Next.
Select a Class-of-Service value, and click Next.
The ToS Marking screen of the Add Filter Rule wizard appears (Figure 10-33).
Figure 10-33 ToS Marking
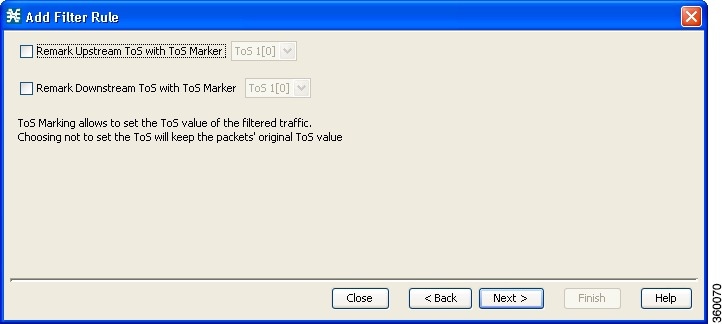
Step 12 ![]() (Optional) To change the DSCP ToS marker of packets in the filtered traffic, check the Remark Upstream ToS with ToS Marker and Remark Downstream ToS with ToS Marker check boxes, select the required ToS marker from the drop-down list, and click Next.
(Optional) To change the DSCP ToS marker of packets in the filtered traffic, check the Remark Upstream ToS with ToS Marker and Remark Downstream ToS with ToS Marker check boxes, select the required ToS marker from the drop-down list, and click Next.
•![]() Disabling the directional DSCP ToS marking in the ToS Marking Settings dialog box (see "How to Manage DSCP ToS Marker Values" section) overrides the DSCP ToS marking in that direction by a filter (that is, the DSCP ToS value is not changed). In this scenario, the Problems View displays a warning message.
Disabling the directional DSCP ToS marking in the ToS Marking Settings dialog box (see "How to Manage DSCP ToS Marker Values" section) overrides the DSCP ToS marking in that direction by a filter (that is, the DSCP ToS value is not changed). In this scenario, the Problems View displays a warning message.
•![]() If you apply a filter for a flow in one direction in Step 4, but select ToS marking in the other direction in this step, the filter rule is created, but no DSCP ToS remarking occurs. In this scenario, the Problems View displays a warning message.
If you apply a filter for a flow in one direction in Step 4, but select ToS marking in the other direction in this step, the filter rule is created, but no DSCP ToS remarking occurs. In this scenario, the Problems View displays a warning message.
The Finish screen of the Add Filter Rule wizard appears (Figure 10-34).
Figure 10-34 Finish
Step 13 ![]() In the Rule Name field, enter a unique name for the new filter rule.
In the Rule Name field, enter a unique name for the new filter rule.
Note ![]() You can use the default name for the filter rule. We recommend that you enter a meaningful name.
You can use the default name for the filter rule. We recommend that you enter a meaningful name.
Step 14 ![]() (Optional) To activate the filter rule, check the Activate this rule check box. Traffic is filtered according to the rule only when it is activated.
(Optional) To activate the filter rule, check the Activate this rule check box. Traffic is filtered according to the rule only when it is activated.
Step 15 ![]() Click Finish.
Click Finish.
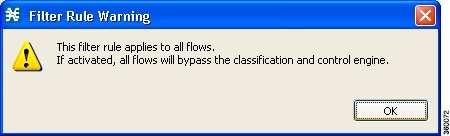
The Add Filter Rule wizard closes. The Filter Rule Warning message is displayed, as shown in Figure 10-35. The filter rule that has been added is displayed in the Filter Rule table.
Figure 10-35 Filter Rule Warning Message
How to Edit Filter Rules
You can view and edit the parameters of a filter rule.
Step 1 ![]() In the Policies tab of Service Configuration Editor window, select the Filtered Traffic node.
In the Policies tab of Service Configuration Editor window, select the Filtered Traffic node.
A list of all filter rules is displayed in the right (Rule) pane.
Step 2 ![]() Select a rule in the Filter Rule table.
Select a rule in the Filter Rule table.
Step 3 ![]() Click the Edit Rule (
Click the Edit Rule ( ) icon.
The Introduction page of the Edit Filter Rule wizard appears.
The Edit Filter Rule wizard is the same as the Add Filter Rule wizard.
Step 4 ![]() Follow the instructions in the section How to Add Filter Rules, Steps 4 to 14.
Follow the instructions in the section How to Add Filter Rules, Steps 4 to 14.
Step 5 ![]() Click Finish.
Click Finish.
The filter rule is changed and the corresponding changes are displayed in the Filter Rule table.
How to Delete Filter Rules
You can delete filter rules. This is useful, for example, when you want the system to resume handling the IP addresses and their attributes according to the individual rules that were previously defined for each subscriber IP address.
Step 1 ![]() In the Policies tab, select the Filtered Traffic node.
In the Policies tab, select the Filtered Traffic node.
A list of all filter rules is displayed in the right (Rule) pane.
Step 2 ![]() Select a rule in the Filter Rule table.
Select a rule in the Filter Rule table.
Step 3 ![]() Click the Delete Rule () icon.
Click the Delete Rule () icon.
A Filter Rule Warning message is displayed (Figure 10-36).
Figure 10-36 Filter Rule Warning
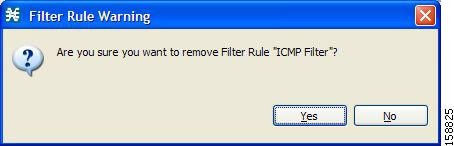
Step 4 ![]() Click Yes.
Click Yes.
The filter rule is deleted and is no longer displayed in the Filter Rule table.
How to Activate and Deactivate Filter Rules
You can activate or deactivate filter rules at any time. Deactivating a filter rule has the same effect as deleting it, but the parameters are retained in the service configuration, and you can reactivate the filter rule at a later date.
Step 1 ![]() In the Policies tab, select the Filtered Traffic node.
In the Policies tab, select the Filtered Traffic node.
A list of all filter rules is displayed in the right (Rule) pane.
Step 2 ![]() Select a rule in the Filter Rule table.
Select a rule in the Filter Rule table.
Step 3 ![]() To activate the rule, check the Active check box.
To activate the rule, check the Active check box.
Step 4 ![]() To deactivate the rule, uncheck the Active check box.
To deactivate the rule, uncheck the Active check box.
Step 5 ![]() Repeat Steps 3 and 4 for other rules.
Repeat Steps 3 and 4 for other rules.
Managing Subscriber Notifications
The subscriber notification feature pushes web-based messages to a subscriber by redirecting the subscriber HTTP traffic to relevant web pages. These web pages contain information relevant to the subscriber, such as notifications of quota depletion. HTTP redirection starts when the subscriber notification is activated and ceases when the notification is dismissed.
Note ![]() Subscriber notification is not supported when unidirectional classification is enabled.
Subscriber notification is not supported when unidirectional classification is enabled.
Each set of subscriber redirection parameters comprises a notification redirect profile. The Cisco SCA BB supports a maximum of 128 redirect profiles, including notification and redirect profiles. There are 3 default redirect profiles that cannot be deleted: Default Notification, Network Attack Notification, and Default Redirection. You configure which notification redirect profile to use when defining rules.
•![]() Subscriber Notification Parameters
Subscriber Notification Parameters
•![]() How to Add a Notification Redirect Profile
How to Add a Notification Redirect Profile
•![]() How to Add a Set of Redirection URLs
How to Add a Set of Redirection URLs
Subscriber Notification Parameters
Each redirect profile of type notification contains the following subscriber notification parameters:
Note ![]() The Activation trigger configuration options are only available for redirect profile of type redirect.
The Activation trigger configuration options are only available for redirect profile of type redirect.
•![]() Name—Each profile must have a unique name.
Name—Each profile must have a unique name.
Note ![]() You cannot change the name of the Default Notification or the Network Attack Notification.
You cannot change the name of the Default Notification or the Network Attack Notification.
•![]() Redirect profile type—Each profile must be one of two types:
Redirect profile type—Each profile must be one of two types:
–![]() Notification
Notification
–![]() Redirect
Redirect
•![]() Set of Redirection URLs—A configurable set of destination URLs, to which the HTTP flows of the subscriber are redirected after redirection is activated. This web page usually contains the message that needs to be conveyed to the subscriber. The redirection set can optionally include one, or several parameters appended to the destination URL including the redirect reason and subscriber ID.
Set of Redirection URLs—A configurable set of destination URLs, to which the HTTP flows of the subscriber are redirected after redirection is activated. This web page usually contains the message that needs to be conveyed to the subscriber. The redirection set can optionally include one, or several parameters appended to the destination URL including the redirect reason and subscriber ID.
The destination web server can use these parameters to carry a more purposeful message to the subscriber.
•![]() Activation frequency—Indicates when to activate the notification redirect. The activation frequency is one of the following:
Activation frequency—Indicates when to activate the notification redirect. The activation frequency is one of the following:
Note ![]() The Periodically option is only available for redirect profile of type redirect.
The Periodically option is only available for redirect profile of type redirect.
•![]() Only once—The subscriber is redirected to the notification only the first time the conditions are met.
Only once—The subscriber is redirected to the notification only the first time the conditions are met.
For example, if a quota was exceeded, the subscriber browses to the destination URL that informs them of this fact, only once (even though the subscriber remains in a breach state).
•![]() Always—The subscriber is redirected to the notification every time the conditions are met.
Always—The subscriber is redirected to the notification every time the conditions are met.
For example, if a quota was exceeded, the subscriber is continuously redirected to the notification until the subscriber completes the procedure to refresh their quota.
•![]() Until the subscriber browses to—Every time the conditions are met, the subscriber is redirected to the notification, until the subscriber proceeds from the destination URL to a different, final URL.
Until the subscriber browses to—Every time the conditions are met, the subscriber is redirected to the notification, until the subscriber proceeds from the destination URL to a different, final URL.
For example, if a quota was exceeded, the web page at the destination URL may ask the subscriber to press an Acknowledge button after reading the message. The acknowledge URL would be defined as the dismissal URL and would deactivate further notifications.
The dismissal URL is composed of the URL hostname and the URL path, separated by a colon, in the following format:
[*]<hostname>:<path>[*]
–![]() <hostname> may optionally be preceded by a wildcard (*), to match all hostnames with the same suffix.
<hostname> may optionally be preceded by a wildcard (*), to match all hostnames with the same suffix.
–![]() The path element must always start with "/".
The path element must always start with "/".
–![]() <path> may be followed by a wildcard (*), to match all paths with a common prefix.
<path> may be followed by a wildcard (*), to match all paths with a common prefix.
For example, the entry *.some-isp.net:/redirect/* matches all the following URLs:
· www.some-isp.net/redirect/index.html
· support.some-isp.net/redirect/info/warning.asp
· noquota.some-isp.net/redirect/acknowledge.aspx?ie=UTF-8
•![]() List of Allowed URLs—A list of URLs that are not blocked and redirected even though redirection is activated.
List of Allowed URLs—A list of URLs that are not blocked and redirected even though redirection is activated.
After redirection is activated, all HTTP flows, except flows to the destination URL and to the dismissal URL, are blocked and redirected to the destination URL. However, subscribers can be permitted to access an additional set of URLs. This is useful, for example, to give subscribers access to additional support information.
Allowed URLs have the same format as the dismissal URL.
These parameters are defined when you add a new notification redirect profile (see "How to Add a Set of Redirection URLs" section). You can modify them at any time.
Network Attack Notification
Subscriber notification informs a subscriber in real-time about current attacks involving IP addresses mapped to that subscriber. (Enabling these notifications is described in "The Service Security Dashboard" section.) Cisco SCA BB notifies the subscriber about the attack by redirecting HTTP flows originating from the subscriber to a server that supplies information about the attack.
One subscriber notification, Network Attack Notification, is dedicated to providing these notifications; it cannot be deleted. A Network Attack Notification is not dismissed at the end of an attack; subscribers must respond to it.
To allow redirection when blocking traffic, the system is configured to leave open one specified TCP port (by default, port 80). See "Managing Advanced Service Configuration Options" section.
•![]() Network Attack Notification Parameters
Network Attack Notification Parameters
•![]() Example of URL with Description Tail
Example of URL with Description Tail
Network Attack Notification Parameters
When a network attack is detected, HTTP flows of the subscriber are redirected to a configurable destination URL. This web page should display the warning that needs to be conveyed to the subscriber.
Optionally, the destination URL can include a query part containing notification parameters. The destination web server can use these parameters to create a more specific warning to the subscriber.
The query part of the URL has the following format:
?ip=<ip>&side=<side>&dir=<dir>&prot=<protocol>&no=<open-flows>&nd=<suspected-flows>&to=<op
en-flows-threshold>&td=<suspected-flows-threshold>&ac=<action>&nh=>handled-flows>
The meaning of each field in the tail is described in Table 10-1:
Example of URL with Description Tail
http://www.some-isp.net/warning?ip=80.178.113.222&side=s&proto=TCP&no=34&nd=4&to=34&td=10&
ac=B&nh=100
How to Add a Notification Redirect Profile
Note ![]() Creating a notification redirect profile does not activate the subscriber notification feature. After the notification redirect profile is defined, it must be activated for a particular package
Creating a notification redirect profile does not activate the subscriber notification feature. After the notification redirect profile is defined, it must be activated for a particular package
Step 1 ![]() From the Policies tab in the left pane, choose Configuration > Policies > Subscriber Redirection.
From the Policies tab in the left pane, choose Configuration > Policies > Subscriber Redirection.
The Redirect Actions Settings dialog box appears (Figure 10-37).
Figure 10-37 Redirect Action Settings - General Tab
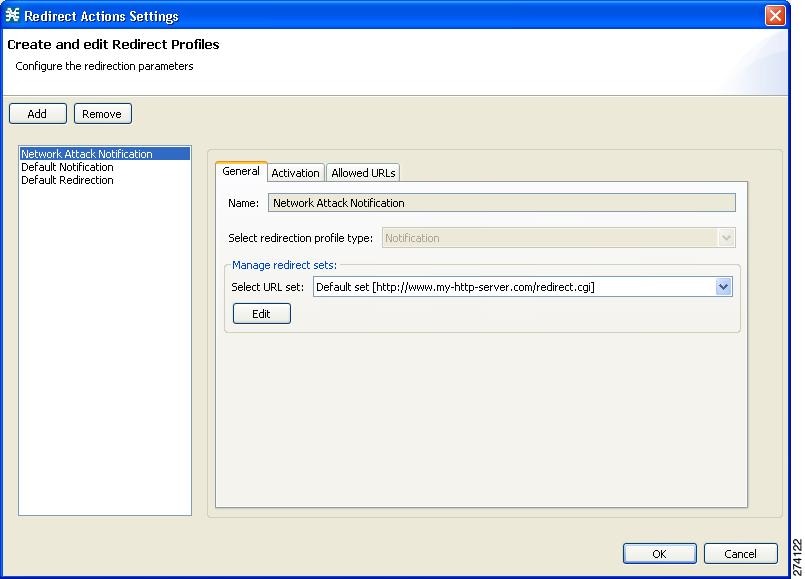
Step 2 ![]() Click Add.
Click Add.
A new redirection profile containing the default redirection URL set is added to the redirection profile list.
Step 3 ![]() In the Name field, enter a unique name for the new notification redirect profile.
In the Name field, enter a unique name for the new notification redirect profile.
Note ![]() You can use the default name for the notification redirect profile. It is recommended that you enter a meaningful name
You can use the default name for the notification redirect profile. It is recommended that you enter a meaningful name
Step 4 ![]() In the Select redirection profile type field, select Notification.
In the Select redirection profile type field, select Notification.
Do not skip this step or a redirect profile is created instead of a notification redirect profile.
Step 5 ![]() Choose a URL set.
Choose a URL set.
Step 6 ![]() Click the Activation tab.
Click the Activation tab.
The Activation tab opens (Figure 10-38).
Figure 10-38 Activation Tab
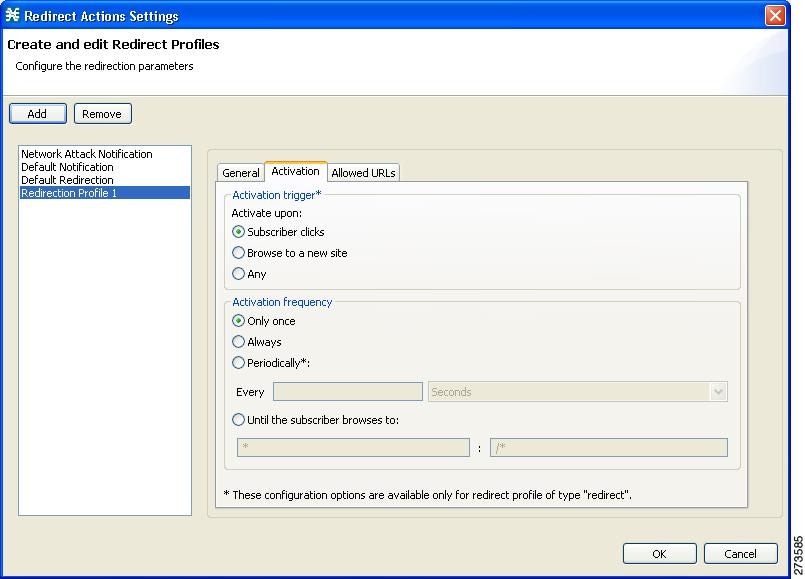
Step 7 ![]() Configure the frequency in which the redirection is triggered. Choose one of the Activation frequency radio buttons:
Configure the frequency in which the redirection is triggered. Choose one of the Activation frequency radio buttons:
•![]() Only once
Only once
•![]() Always
Always
•![]() Periodically
Periodically
•![]() Until the subscriber browses to:
Until the subscriber browses to:
Step 8 ![]() If you chose the Until the subscriber browses to: radio button, enter the dismissal URL host-suffix and path-prefix in the fields provided.
If you chose the Until the subscriber browses to: radio button, enter the dismissal URL host-suffix and path-prefix in the fields provided.
Note ![]() We recommend that you avoid configuring the same host for redirection URL and redirection dismissal URL.
We recommend that you avoid configuring the same host for redirection URL and redirection dismissal URL.
The redirection is done based on the first GET request in a flow. If the same host is configured, with the changes in the URL path, the GET request corresponding the dismissal URL may use the same flow that was created for the redirect URL. This is the expected behavior with the default configuration.
You can change the default configuration by increasing the number of HTTP GET detections in the flow. To modify the number of HTTP GET detections from the Cisco SCA BB, use the Advanced Service Configuration Options. Note that increasing the number of HTTP GET detections may impact the performance of the Cisco SCE.
Step 9 ![]() Click the Allowed URLs tab.
Click the Allowed URLs tab.
The Allowed URLs tab opens (Figure 10-39).
Figure 10-39 Allowed URLs Tab
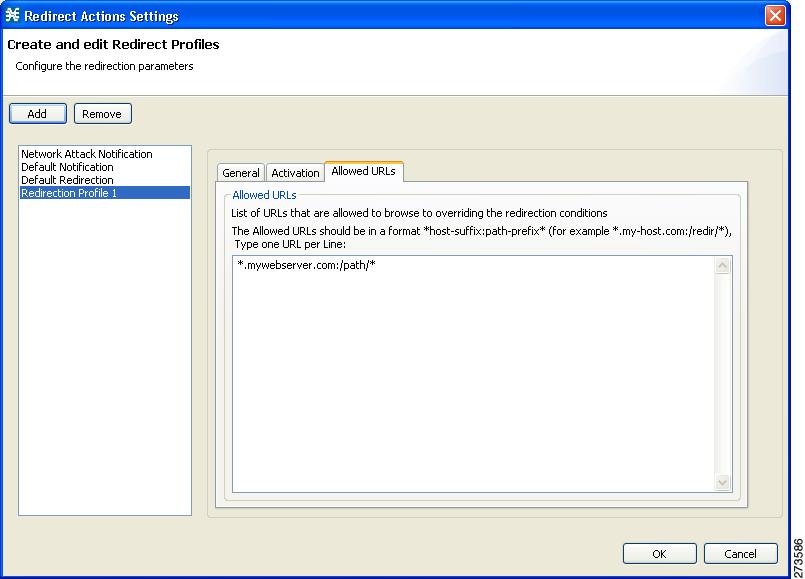
Step 10 ![]() (Optional) Enter any allowed URLs, one per line.
(Optional) Enter any allowed URLs, one per line.
Step 11 ![]() Click OK.
Click OK.
The Redirect Actions Settings dialog box closes.
The notification redirect profile is added to the profile list.
Managing Subscriber Redirection
The rules for a package may deny access to selected protocols. When a subscriber to the package tries to access a blocked protocol, the traffic flow can be redirected to a server where a posted web page explains the reason for the redirection (for example, a "Silver" subscriber trying to access a service available only to "Gold" subscribers). This web page can offer subscribers the opportunity to upgrade their packages. You configure which redirection profile to use when defining rules.
Note ![]() Redirection is not supported when unidirectional classification is enabled.
Redirection is not supported when unidirectional classification is enabled.
Each redirect profile consists of a set of redirect parameters. The Cisco SCA BB supports a maximum of 128 redirect profiles, including notification redirect and redirect profiles.
Subscriber Redirect Parameters
Each redirect profile of type redirect contains the following parameters:
•![]() Name—Each profile must have a unique name.
Name—Each profile must have a unique name.
Note ![]() You cannot change the name of the Default Redirection Profile.
You cannot change the name of the Default Redirection Profile.
•![]() Redirect profile type—Each profile must be one of two types:
Redirect profile type—Each profile must be one of two types:
–![]() Notification
Notification
–![]() Redirect
Redirect
•![]() Set of Redirection URLs—A configurable set of destination URLs, to which the subscriber's HTTP flows are redirected after redirection is activated. The redirection set can optionally include one, or several parameters appended to the destination URL including the redirect reason or subscriber ID.
Set of Redirection URLs—A configurable set of destination URLs, to which the subscriber's HTTP flows are redirected after redirection is activated. The redirection set can optionally include one, or several parameters appended to the destination URL including the redirect reason or subscriber ID.
•![]() Activation trigger—The action that initiates the redirect. The activation trigger is one of the following:
Activation trigger—The action that initiates the redirect. The activation trigger is one of the following:
–![]() Subscriber clicks—When the redirect is activated through a subscriber clicking a link.
Subscriber clicks—When the redirect is activated through a subscriber clicking a link.
–![]() Browse to a new site—When the redirect is activated through browsing.
Browse to a new site—When the redirect is activated through browsing.
–![]() Any—When the redirect is activated either via a link or browsing.
Any—When the redirect is activated either via a link or browsing.
•![]() Activation frequency—Indicates when to activate the redirect. The activation frequency is one of the following:
Activation frequency—Indicates when to activate the redirect. The activation frequency is one of the following:
–![]() Only once—The subscriber is redirected only the first time the conditions are met. Enable the GT_GLB_RedirectOnHomePage tunable to redirect from a home page.
Only once—The subscriber is redirected only the first time the conditions are met. Enable the GT_GLB_RedirectOnHomePage tunable to redirect from a home page.
–![]() Always—The subscriber is redirected every time the conditions are met.
Always—The subscriber is redirected every time the conditions are met.
–![]() Periodically—The redirection is based on a periodic counter and the counter is reset after the redirection is complete.
Periodically—The redirection is based on a periodic counter and the counter is reset after the redirection is complete.
–![]() Triggering events
Triggering events
–![]() KBytes
KBytes
–![]() Until the subscriber browses to—Every time the conditions are met, the subscriber is redirected, until the subscriber proceeds from the destination URL to a different, final URL.
Until the subscriber browses to—Every time the conditions are met, the subscriber is redirected, until the subscriber proceeds from the destination URL to a different, final URL.
The dismissal URL is composed of the URL hostname and the URL path, separated by a colon, in the following format:
[*]<hostname>:<path>[*]
–![]() <hostname> may optionally be preceded by a wildcard (*), to match all hostnames with the same suffix.
<hostname> may optionally be preceded by a wildcard (*), to match all hostnames with the same suffix.
–![]() The path element must always start with "/".
The path element must always start with "/".
–![]() <path> may be followed by a wildcard (*), to match all paths with a common prefix.
<path> may be followed by a wildcard (*), to match all paths with a common prefix.
For example, the entry *.some-isp.net:/redirect/* matches all the following URLs:
· www.some-isp.net/redirect/index.html
· support.some-isp.net/redirect/info/warning.asp
· noquota.some-isp.net/redirect/acknowledge.aspx?ie=UTF-8
•![]() List of Allowed URLs—A list of URLs that are not blocked and redirected even though redirection is activated.
List of Allowed URLs—A list of URLs that are not blocked and redirected even though redirection is activated.
After redirection is activated, all HTTP flows, except flows to the destination URL and to the dismissal URL, are blocked and redirected to the destination URL. However, subscribers can be permitted to access an additional set of URLs. This is useful, for example, to give subscribers access to additional support information.
Allowed URLs have the same format as the dismissal URL. But, for Allowed URLs, you must specify the HTTP port and the port must be 80. If the URL contains any port other than 80, the URL is considered as a normal URL and is redirected.
These parameters are defined when you add a new notification redirect profile. You can modify them at any time.
How to Add a Redirect Profile
A redirect profile contains a set of redirection URLs as well as conditions in which to use the redirect feature, such as the action that triggers the redirect, or the frequency in which the redirect occurs.
Step 1 ![]() From the Policies tab in the left pane, choose Configuration > Policies > Subscriber Redirection.
From the Policies tab in the left pane, choose Configuration > Policies > Subscriber Redirection.
The Redirect Actions Settings dialog box appears (Figure 10-40).
Figure 10-40 Redirect Actions Settings - General Tab
Step 2 ![]() Click Add.
Click Add.
A new redirect profile containing the default redirection URL set is added to the redirect profile list.
Step 3 ![]() In the Name field, enter a unique name for the new redirect profile.
In the Name field, enter a unique name for the new redirect profile.
Note ![]() You can use the default name for the redirect profile, but it is recommended that you enter a meaningful name.
You can use the default name for the redirect profile, but it is recommended that you enter a meaningful name.
Step 4 ![]() Choose a URL set.
Choose a URL set.
Step 5 ![]() Click the Activation tab.
Click the Activation tab.
The Activation tab opens (Figure 10-41).
Figure 10-41 Activation Tab
Step 6 ![]() Configure the activity that triggers the redirection. Choose one of the Activation trigger radio buttons:
Configure the activity that triggers the redirection. Choose one of the Activation trigger radio buttons:
•![]() Subscriber clicks
Subscriber clicks
•![]() Browse to a new site
Browse to a new site
•![]() Any
Any
Step 7 ![]() Configure the frequency in which the redirection is triggered. Select one of the Activation frequency radio buttons:
Configure the frequency in which the redirection is triggered. Select one of the Activation frequency radio buttons:
•![]() Only once
Only once
•![]() Always
Always
•![]() Periodically
Periodically
•![]() Until the subscriber browses to
Until the subscriber browses to
Step 8 ![]() If you selected the Periodically radio button, enter a number and an increment in the Every fields, to specify the frequency in which the redirection occurs.
If you selected the Periodically radio button, enter a number and an increment in the Every fields, to specify the frequency in which the redirection occurs.
Step 9 ![]() If you selected the Until the subscriber browses to: radio button, enter the dismissal URL in the fields provided.
If you selected the Until the subscriber browses to: radio button, enter the dismissal URL in the fields provided.
Step 10 ![]() Click the Allowed URLs tab.
Click the Allowed URLs tab.
The Allowed URLs tab opens (Figure 10-42).

Tip ![]() Enter all configured redirection URLs to the Allowed URLs list to prevent a redirection loop.
Enter all configured redirection URLs to the Allowed URLs list to prevent a redirection loop.
Figure 10-42 Allowed URLs Tab
Step 11 ![]() (Optional) Enter a URL, or multiple URLs (with HTTP port 80), that can be browsed, overriding the redirect conditions.
(Optional) Enter a URL, or multiple URLs (with HTTP port 80), that can be browsed, overriding the redirect conditions.
Note ![]() All URLs with HTTP port other than 80 is redirected.
All URLs with HTTP port other than 80 is redirected.
Step 12 ![]() Click OK.
Click OK.
The Redirect Actions Settings dialog box closes.
The Redirection profile is added to the redirection profile list.
How to Delete a Redirection Profile
You cannot delete the Default Redirection Profile.
Step 1 ![]() From the Policies tab in the left pane, choose Configuration > Policies > Subscriber Redirection.
From the Policies tab in the left pane, choose Configuration > Policies > Subscriber Redirection.
The Redirect Actions Settings dialog box appears.
Step 2 ![]() Click the name of the profile.
Click the name of the profile.
Step 3 ![]() Click Remove.
Click Remove.
Step 4 ![]() Click OK.
Click OK.
The Redirect Actions Settings dialog box closes.
The Redirection settings are saved.
How to Add a Set of Redirection URLs
The Console Redirection feature supports only three protocols:
•![]() HTTP Browsing
HTTP Browsing
•![]() HTTP Streaming
HTTP Streaming
•![]() RTSP Streaming
RTSP Streaming
Each redirection set contains one redirection option for each of these three protocols. The system provides a default redirection set, which cannot be deleted. You can add up to 127 additional sets.
Each redirection URL includes the URL specified name, the Subscriber ID, and the Service ID in the following format:
<URL>?n=<subscriber-ID>&s=<service-ID>
Optionally, the URL can contain one or multiple parameters appended to it.
Step 1 ![]() From the Policies tab of the left pane, choose Configuration > Policies > Subscriber Redirection.
From the Policies tab of the left pane, choose Configuration > Policies > Subscriber Redirection.
The Redirect Actions Settings dialog box appears.
Step 2 ![]() In the General tab, click Edit.
In the General tab, click Edit.
The Redirect Set Settings dialog box appears (Figure 10-43).
Figure 10-43 Redirect Set Settings
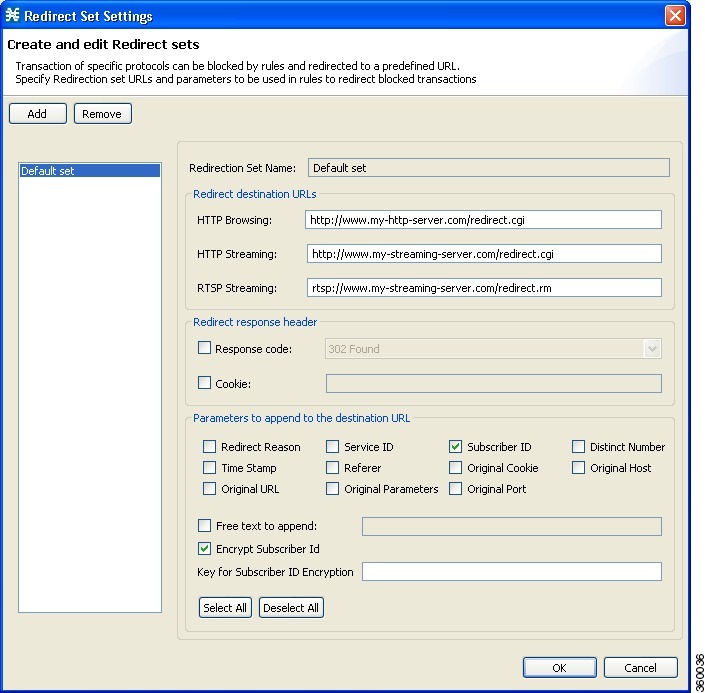
Step 3 ![]() Click Add.
Click Add.
A new redirection set containing the default redirection URLs is added.
Step 4 ![]() In the Redirection Set Name field, enter unique name for the new redirection set.
In the Redirection Set Name field, enter unique name for the new redirection set.
Note ![]() You can use the default name for the redirection set, but it is recommended that you provide a meaningful name.
You can use the default name for the redirection set, but it is recommended that you provide a meaningful name.
Step 5 ![]() Enter new values in the Redirection destination URLs section of the new redirection set.
Enter new values in the Redirection destination URLs section of the new redirection set.

Timesaver ![]() Enter all configured redirection URLs to the Allowed URLs list to prevent a redirection loop.
Enter all configured redirection URLs to the Allowed URLs list to prevent a redirection loop.
Step 6 ![]() (Optional) To include a response code, check the Response code check box, and choose a response code from the drop-down list. see Table 10-2 for a listing and description of the redirection parameters.
(Optional) To include a response code, check the Response code check box, and choose a response code from the drop-down list. see Table 10-2 for a listing and description of the redirection parameters.
Step 7 ![]() (Optional) To include a cookie, check the Cookie check box, and enter a value. see Table 10-2 for a listing and description of the redirection parameters.
(Optional) To include a cookie, check the Cookie check box, and enter a value. see Table 10-2 for a listing and description of the redirection parameters.
Step 8 ![]() (Optional) Check the check boxes of any parameters you wish to append to the destination URL see Table 10-2 for a listing and description of the redirection parameters.
(Optional) Check the check boxes of any parameters you wish to append to the destination URL see Table 10-2 for a listing and description of the redirection parameters.
The Subscriber ID in the redirected URL can be encrypted by checking the Encrypt Subscriber ID check box. After you check the Encrypt Subscriber ID check box, enter your encryption key in the Key for the Subscriber ID Encryption field. The key must contain 32 hexadecimal characters. Subscriber ID encryption is applicable only for Cisco SCE 8000 GBE and 10 GBE platforms.
If you check the Free text to append check box, enter text into the text box to append to the URL. see Table 10-2 for a listing and description of the redirection parameters. The examples in Table 10-2 is based on the following URL redirection:
http://<URL>?n=N/A&reason=2&s=119&id=0:10&ts=1327285422&str=this is free text to append content&referer=&cookie=&host=<URL>&url=/p-cube.htm¶ms=
Note ![]() "<" and ">" do not appear in redirect URL.
"<" and ">" do not appear in redirect URL.
Maximum length of destination URL including parameters is 500 characters.
Cookie and Referer parameters are allowed only for HTTP traffic.
Step 9 ![]() Click OK.
Click OK.
Your settings are saved and the Redirect Set Settings dialog box closes.
Note ![]() Keep the total number of characters appended to the redirect URL below 1200. To keep it below 1200, we recommend that you enable only the required parameters under the Parameters to append to the destination URL pane.
Keep the total number of characters appended to the redirect URL below 1200. To keep it below 1200, we recommend that you enable only the required parameters under the Parameters to append to the destination URL pane.
How to Delete a Set of Redirection URLs
Step 1 ![]() From the Policies tab of the left pane, choose Configuration > Policies > Subscriber Redirection.
From the Policies tab of the left pane, choose Configuration > Policies > Subscriber Redirection.
The Redirect Actions Settings dialog box appears.
Step 2 ![]() In the General tab, click Edit.
In the General tab, click Edit.
The Redirect Set Settings dialog box appears.
Step 3 ![]() Click the name of the redirection set.
Click the name of the redirection set.
Step 4 ![]() Click Remove.
Click Remove.
Step 5 ![]() Click OK.
Click OK.
The Redirect Set Settings dialog box closes.
The Redirection settings are saved.
Managing the System Settings
The Console allows you to determine various system parameters that control:
•![]() The operational state of the system
The operational state of the system
•![]() Enabling and disabling asymmetric routing classification mode
Enabling and disabling asymmetric routing classification mode
•![]() Advanced service configuration options
Advanced service configuration options
Setting the System Modes
From the Console, you can select:
•![]() The operational mode of the system
The operational mode of the system
•![]() Asymmetric routing classification mode
Asymmetric routing classification mode
Information About the System Modes
•![]() Asymmetric Routing Classification Mode
Asymmetric Routing Classification Mode
System Operational Mode
The operational mode of the system defines how the system handles network traffic.
Note ![]() Each rule has its own operational mode (state). If this differs from the system mode, the "lower" of the two modes is used. For example, if a rule is enabled, but the system mode is report-only, the rule generates only RDRs.
Each rule has its own operational mode (state). If this differs from the system mode, the "lower" of the two modes is used. For example, if a rule is enabled, but the system mode is report-only, the rule generates only RDRs.
The three operational modes are:
•![]() Full Functionality—The system enforces active rules on the network traffic and performs reporting functions (that is, generates RDRs).
Full Functionality—The system enforces active rules on the network traffic and performs reporting functions (that is, generates RDRs).
•![]() Report Only—The system generates RDRs only. No active rule enforcement is performed on the network traffic.
Report Only—The system generates RDRs only. No active rule enforcement is performed on the network traffic.
•![]() Transparent—The system does not generate RDRs and does not enforce active rules on the network traffic.
Transparent—The system does not generate RDRs and does not enforce active rules on the network traffic.
Asymmetric Routing Classification Mode
Enabling unidirectional classification significantly improves classification accuracy when the Cisco SCE platform is deployed in an environment with a high rate of unidirectional flows.
•![]() Switching to Asymmetric Routing Classification Mode
Switching to Asymmetric Routing Classification Mode
•![]() Switching from Asymmetric Routing Classification Mode
Switching from Asymmetric Routing Classification Mode
Unsupported Features
The following Cisco SCA BB features are not supported when unidirectional classification is enabled:
•![]() Flavors
Flavors
•![]() External quota provisioning
External quota provisioning
•![]() Subscriber notification
Subscriber notification
•![]() Redirection
Redirection
•![]() Flow Signaling RDRs
Flow Signaling RDRs
•![]() Content filtering
Content filtering
•![]() VAS traffic forwarding
VAS traffic forwarding
When unidirectional classification is enabled, the service configuration editor indicates (in the Problems View) if the service configuration is consistent with the features that are supported in this mode.
The following features, which are not part of the service configuration, are also affected when unidirectional classification is enabled:
•![]() Subscriber-Aware Mode (a mode in which subscriber information is dynamically bound to the IP address currently in use by the subscriber) is not supported.
Subscriber-Aware Mode (a mode in which subscriber information is dynamically bound to the IP address currently in use by the subscriber) is not supported.
•![]() Enhanced flow open mode must be enabled.
Enhanced flow open mode must be enabled.
The system gives no indication if the state of the above features is consistent with the state of the routing classification mode.
Protocol Classification
When unidirectional classification is enabled, protocol classification is performed in the normal way except for unidirectional UDP flows. Because it is impossible to know the server side of a unidirectional UDP flow, Cisco SCA BB tries to classify the protocol using the destination port of the first packet; if no exact match is found, Cisco SCA BB tries to classify the protocol using the source port.
Switching to Asymmetric Routing Classification Mode
If you create a service configuration in symmetric mode and switch to asymmetric routing classification mode:
•![]() Flavors are not used for classification.
Flavors are not used for classification.
•![]() Periodic quota management mode is used.
Periodic quota management mode is used.
•![]() Data is not lost when you switch to asymmetric routing classification mode, but you cannot apply the service configuration to a Cisco SCE platform until all unsupported features are removed from the service configuration.
Data is not lost when you switch to asymmetric routing classification mode, but you cannot apply the service configuration to a Cisco SCE platform until all unsupported features are removed from the service configuration.
Switching from Asymmetric Routing Classification Mode
If you create a service configuration in asymmetric routing classification mode:
•![]() The Suspected Session Rate is set equal to the Session Rate for all anomaly detectors.
The Suspected Session Rate is set equal to the Session Rate for all anomaly detectors.
•![]() No flavors are created in the default service configuration, and no service elements have specified flavors.
No flavors are created in the default service configuration, and no service elements have specified flavors.
•![]() The quota management mode is periodic, with a daily aggregation period.
The quota management mode is periodic, with a daily aggregation period.
•![]() Asymmetric routing classification mode limitations remain if you switch to symmetric mode. To change them, you must edit the service configuration.
Asymmetric routing classification mode limitations remain if you switch to symmetric mode. To change them, you must edit the service configuration.
How to Set the Operational and Topological Modes of the System
Step 1 ![]() From the Policies tab of the left pane, choose Configuration > Policies > System Settings.
From the Policies tab of the left pane, choose Configuration > Policies > System Settings.
The System Settings dialog box appears (Figure 10-44).
Figure 10-44 System Settings
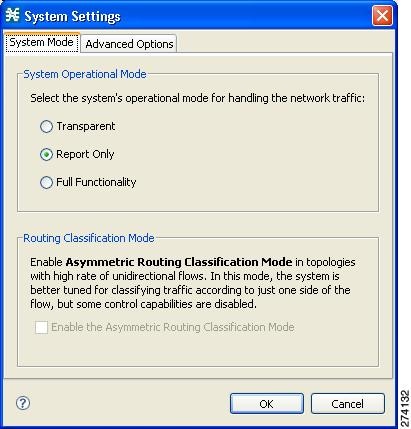
Step 2 ![]() Select one of the System Operational Mode radio buttons:
Select one of the System Operational Mode radio buttons:
•![]() Transparent
Transparent
•![]() Report Only
Report Only
•![]() Full Functionality
Full Functionality
Step 3 ![]() To change the routing classification mode, check or uncheck the Enable the Asymmetric Routing Classification Mode check box.
To change the routing classification mode, check or uncheck the Enable the Asymmetric Routing Classification Mode check box.
Step 4 ![]() Click OK.
Click OK.
The System Settings dialog box closes.
The new System Mode setting is saved.
Managing Advanced Service Configuration Options
Advanced service configuration options control the more sophisticated and less frequently changed attributes of the system. It is recommended that you do not change these options.
•![]() The Advanced Service Configuration Properties
The Advanced Service Configuration Properties
•![]() How to Edit Advanced Service Configuration Options
How to Edit Advanced Service Configuration Options
The Advanced Service Configuration Properties
Table 10-3 lists the advanced service configuration properties:
How to Edit Advanced Service Configuration Options
Step 1 ![]() From the Policies tab of the left pane, choose Configuration > Policies > System Settings.
From the Policies tab of the left pane, choose Configuration > Policies > System Settings.
The System Settings dialog box appears.
Step 2 ![]() Click the Advanced Options tab.
Click the Advanced Options tab.
The Advanced Options tab opens (Figure 10-45).
Figure 10-45 Advanced Options Tab
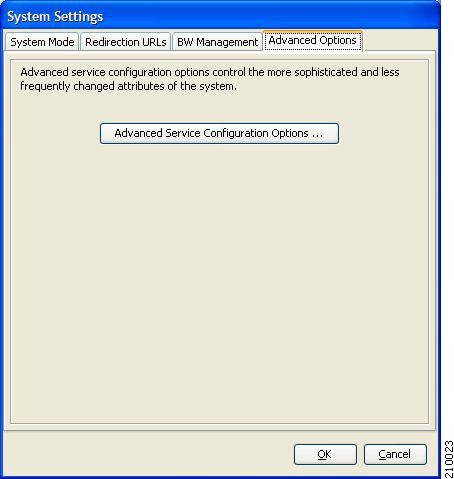
Step 3 ![]() Click Advanced Service Configuration Options.
Click Advanced Service Configuration Options.
The Advanced Service Configuration Options dialog box opens (Figure 10-46).
Figure 10-46 Advanced Service Configuration Options
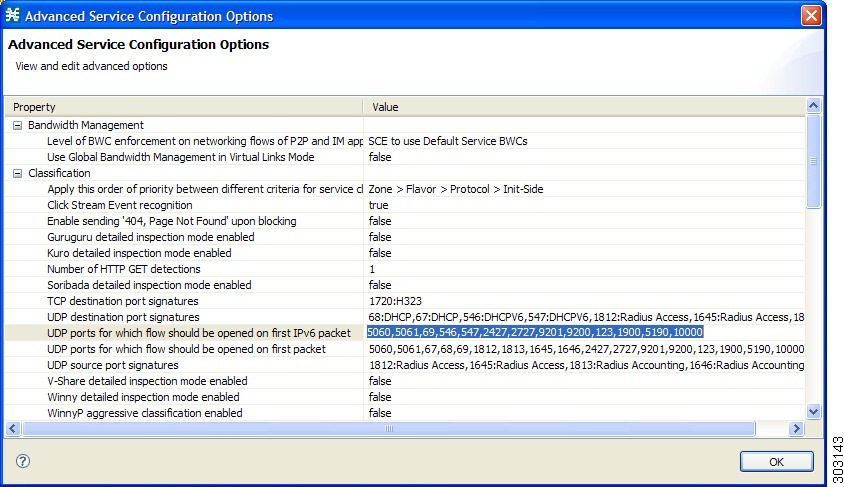
Step 4 ![]() Make your changes to the configuration options.
Make your changes to the configuration options.
Step 5 ![]() Click OK.
Click OK.
The Advanced Service Configuration Options dialog box closes.
The changes to the advanced options are saved.
Step 6 ![]() Click OK.
Click OK.
The System Settings dialog box closes.
Managing VAS Settings
Value Added Service (VAS) settings includes the following features:
•![]() Traffic mirroring—Traffic mirroring allows using the Cisco SCE to mirror a portion of the traffic based on its application and subscriber awareness. Traffic to be mirrored continues forwarding as is, and copies of the packets are sent to the corresponding VAS VLAN, thereby minimizing traffic.
Traffic mirroring—Traffic mirroring allows using the Cisco SCE to mirror a portion of the traffic based on its application and subscriber awareness. Traffic to be mirrored continues forwarding as is, and copies of the packets are sent to the corresponding VAS VLAN, thereby minimizing traffic.
•![]() Traffic forwarding—Traffic forwarding servers allows you to use an external expert system (VAS server) for additional traffic processing, such as intrusion detection and content filtering to subscribers. After processing, flows are sent back to the Cisco SCE platform, which then sends them to their original destinations.
Traffic forwarding—Traffic forwarding servers allows you to use an external expert system (VAS server) for additional traffic processing, such as intrusion detection and content filtering to subscribers. After processing, flows are sent back to the Cisco SCE platform, which then sends them to their original destinations.
The flows to be forwarded are selected based on the subscriber package and the flow type (IP protocol type and destination port number).
VAS mirroring has the following limitations:
•![]() The Cisco SCE 2000 and Cisco SCE 8000 both support traffic mirroring.
The Cisco SCE 2000 and Cisco SCE 8000 both support traffic mirroring.
•![]() Traffic mirroring is supported on any Cisco SCE platform that has at least 2 ports.
Traffic mirroring is supported on any Cisco SCE platform that has at least 2 ports.
•![]() A Cisco SCE 8000 can contain 64 distinct VLANs.
A Cisco SCE 8000 can contain 64 distinct VLANs.
•![]() A Cisco SCE 2000 supports 8 distinct VLANs.
A Cisco SCE 2000 supports 8 distinct VLANs.
VAS forwarding has the following limitations:
•![]() Only the Cisco SCE 2000 4xGBE and Cisco SCE 8000 platforms support VAS traffic forwarding.
Only the Cisco SCE 2000 4xGBE and Cisco SCE 8000 platforms support VAS traffic forwarding.
•![]() A single Cisco SCE platform can support up to eight VAS servers.
A single Cisco SCE platform can support up to eight VAS servers.
•![]() A service configuration can contain up to 64 traffic-forwarding tables.
A service configuration can contain up to 64 traffic-forwarding tables.
•![]() A traffic-forwarding table can contain up to 64 table parameters.
A traffic-forwarding table can contain up to 64 table parameters.
•![]() VAS traffic forwarding is not supported when unidirectional classification is enabled.
VAS traffic forwarding is not supported when unidirectional classification is enabled.
Note ![]() Because of the complexity of the VAS settings features, VAS flows are not subject to global bandwidth control.
Because of the complexity of the VAS settings features, VAS flows are not subject to global bandwidth control.
To use VAS traffic forwarding:
–![]() You must configure VAS services on the Cisco SCE platform. Additional information is available in the "Value Added Services (VAS) Traffic Forwarding" chapter of the Cisco SCE2000, SCE1000Software Configuration Guide and "Intelligent Traffic Mirroring" chapter of the Cisco SCE8000 GBE Software Configuration Guide and Cisco SCE8000 10GBE Software Configuration Guide.
You must configure VAS services on the Cisco SCE platform. Additional information is available in the "Value Added Services (VAS) Traffic Forwarding" chapter of the Cisco SCE2000, SCE1000Software Configuration Guide and "Intelligent Traffic Mirroring" chapter of the Cisco SCE8000 GBE Software Configuration Guide and Cisco SCE8000 10GBE Software Configuration Guide.
–![]() You must also assign the VAS traffic-forwarding tables to packages in the Advanced tab of the Edit Packages dialog. VAS traffic-forwarding is based on per-package configuration of where to forward what traffic. To set a VAS traffic-forwarding table for a package, see the "How to Set Advanced Package Options" section.
You must also assign the VAS traffic-forwarding tables to packages in the Advanced tab of the Edit Packages dialog. VAS traffic-forwarding is based on per-package configuration of where to forward what traffic. To set a VAS traffic-forwarding table for a package, see the "How to Set Advanced Package Options" section.
•![]() How to Enable VAS Traffic Forwarding
How to Enable VAS Traffic Forwarding
•![]() How to Rename VAS Server Groups
How to Rename VAS Server Groups
•![]() How to View VAS Traffic-Forwarding Tables
How to View VAS Traffic-Forwarding Tables
•![]() How to Delete VAS Traffic-Forwarding Tables
How to Delete VAS Traffic-Forwarding Tables
•![]() How to Add VAS Traffic-Forwarding Tables
How to Add VAS Traffic-Forwarding Tables
•![]() Managing VAS Table Parameters
Managing VAS Table Parameters
How to Enable VAS Traffic Forwarding
By default, VAS traffic forwarding is disabled. You can enable it at any time.
Note ![]() VAS traffic forwarding is not supported when unidirectional classification is enabled.
VAS traffic forwarding is not supported when unidirectional classification is enabled.
Step 1 ![]() From the Policies tab of the left pane, choose Configuration > Policies > VAS Settings.
From the Policies tab of the left pane, choose Configuration > Policies > VAS Settings.
The VAS Settings dialog box appears (Figure 10-47).
Figure 10-47 VAS Settings - Enable Traffic Forwarding
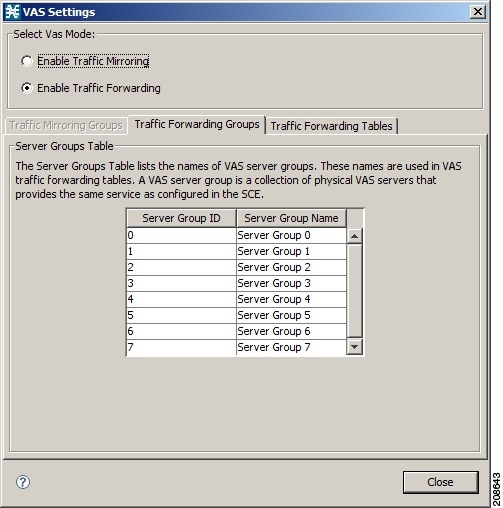
Step 2 ![]() Click the Enable Traffic Forwarding radio button.
Click the Enable Traffic Forwarding radio button.
Note ![]() VAS traffic forwarding is not supported in asymmetric routing classification mode. If you try to check the Enable Traffic Forwarding radio button when asymmetric routing classification mode is enabled, a VAS Error message appears.
VAS traffic forwarding is not supported in asymmetric routing classification mode. If you try to check the Enable Traffic Forwarding radio button when asymmetric routing classification mode is enabled, a VAS Error message appears.
Click OK, and continue at Step 4.
A VAS warning message appears.
Step 3 ![]() Click OK.
Click OK.
Step 4 ![]() Click Close.
Click Close.
The VAS Settings dialog box closes.
How to Enable VAS Traffic Mirroring
Traffic Mirroring in enabled and configured in the VAS Setting dialog box. However, you configure which server group to use when defining rules.
Step 1 ![]() From the Policies tab of the left pane, choose Configuration > Policies > VAS Settings.
From the Policies tab of the left pane, choose Configuration > Policies > VAS Settings.
The VAS Settings dialog box appears (Figure 10-48).
Figure 10-48 VAS Settings - Enable Traffic Mirroring
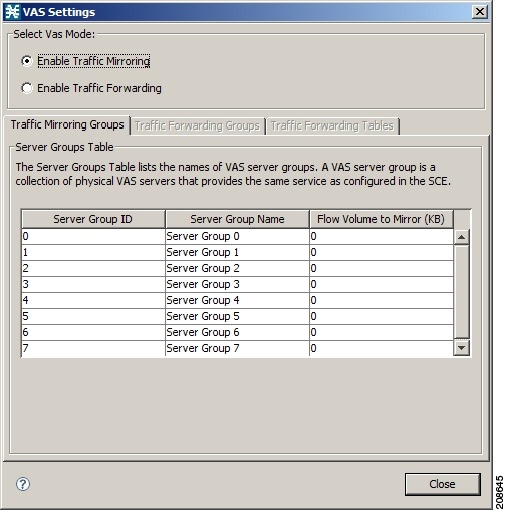
Step 2 ![]() Choose the Enable Traffic Mirroring radio button.
Choose the Enable Traffic Mirroring radio button.
A VAS warning message appears.
Step 3 ![]() Click OK.
Click OK.
Step 4 ![]() Click Close.
Click Close.
The VAS Settings dialog box closes.
How to Rename VAS Server Groups
A Cisco SCE platform can forward flows to up to eight different VAS server groups. By default, the eight server groups are named "Server Group n", where n takes a value from 0 to 7. Give the server groups meaningful names; the names you give appears in the drop-down list in the Control and Breach Handling tabs of the Add Rule to Package dialog box (see "How to Set Advanced Package Options" section) and in the Server Group field of the table parameters added to each traffic-forwarding table (see "Managing VAS Table Parameters" section).
Step 1 ![]() From the Policies tab of the left pane, choose Configuration > Policies > VAS Settings.
From the Policies tab of the left pane, choose Configuration > Policies > VAS Settings.
The VAS Settings dialog box appears (Figure 10-49).
Step 2 ![]() In the table in the Server Groups Table area, double-click in a cell containing a server group name.
In the table in the Server Groups Table area, double-click in a cell containing a server group name.
Step 3 ![]() Enter a meaningful name in the cell.
Enter a meaningful name in the cell.
Step 4 ![]() Repeat Step 2 and Step 3 for other server groups you wish to rename.
Repeat Step 2 and Step 3 for other server groups you wish to rename.
Figure 10-49 Traffic Forwarding Groups Tab
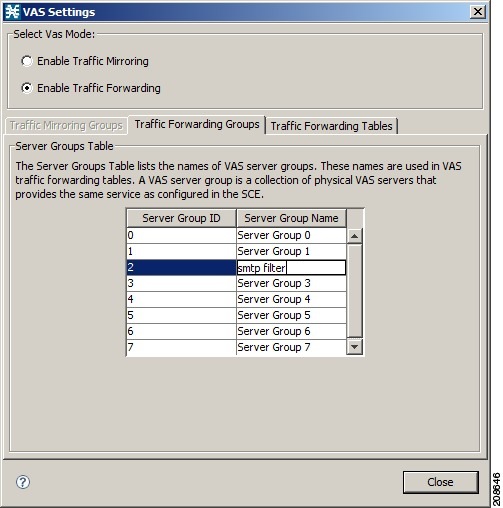
Step 5 ![]() Click Close.
Click Close.
The VAS Settings dialog box closes.
How to Configure VAS Traffic-Mirroring
Step 1 ![]() From the Policies tab of the left pane, choose Configuration > Policies > VAS Settings.
From the Policies tab of the left pane, choose Configuration > Policies > VAS Settings.
The VAS Settings dialog box appears (Figure 10-50).
Figure 10-50 Traffic Mirroring Groups Tab
Step 2 ![]() Click the Enable Traffic Forwarding radio button.
Click the Enable Traffic Forwarding radio button.
Step 3 ![]() For each server group, in the Flow Volume to Mirror (KB) column, enter the maximum amount of volume to mirror, in KB.
For each server group, in the Flow Volume to Mirror (KB) column, enter the maximum amount of volume to mirror, in KB.
Step 4 ![]() Click Close.
Click Close.
The VAS Settings dialog box closes.
How to View VAS Traffic-Forwarding Tables
Cisco SCA BB decides whether a flow passing through a Cisco SCE platform should be forwarded to a VAS server group based on a traffic-forwarding table. Each entry (table parameter) in a traffic-forwarding table defines to which VAS server group the specified flows should be forwarded.
Step 1 ![]() From the Policies tab of the left pane, choose Configuration > Policies > VAS Settings.
From the Policies tab of the left pane, choose Configuration > Policies > VAS Settings.
The VAS Settings dialog box appears.
Step 2 ![]() Click the Enable Traffic Forwarding radio button.
Click the Enable Traffic Forwarding radio button.
Step 3 ![]() Click the Traffic Forwarding Tables tab.
Click the Traffic Forwarding Tables tab.
The Traffic Forwarding Tables tab opens.
A list of all traffic-forwarding tables is displayed in the Traffic Forwarding Tables area.
Step 4 ![]() Click a table in the list of traffic-forwarding tables to display its table parameters.
Click a table in the list of traffic-forwarding tables to display its table parameters.
A list of all table parameters defined for this traffic-forwarding table opens in the Table Parameters tab (Figure 10-51).
Figure 10-51 Traffic Forwarding Tables Tab
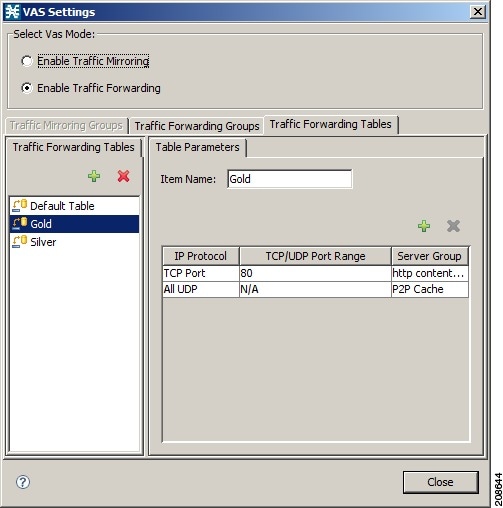
Step 5 ![]() Click Close.
Click Close.
The VAS Settings dialog box closes.
How to Delete VAS Traffic-Forwarding Tables
You can delete all user-created traffic-forwarding tables. The default traffic-forwarding table cannot be deleted.
Note ![]() A traffic-forwarding table cannot be deleted while it is associated with a package.
A traffic-forwarding table cannot be deleted while it is associated with a package.
Step 1 ![]() From the Policies tab of the left pane, choose Configuration > Policies > VAS Settings.
From the Policies tab of the left pane, choose Configuration > Policies > VAS Settings.
The VAS Settings dialog box appears.
Step 2 ![]() Click the Enable Traffic Forwarding radio button.
Click the Enable Traffic Forwarding radio button.
Step 3 ![]() Click the Traffic Forwarding Tables tab.
Click the Traffic Forwarding Tables tab.
The Traffic Forwarding Tables tab opens.
Step 4 ![]() From the list of traffic-forwarding tables in the Traffic Forwarding Tables area, select a table.
From the list of traffic-forwarding tables in the Traffic Forwarding Tables area, select a table.
Step 5 ![]() Click the Delete () icon.
Click the Delete () icon.
A VAS Warning message appears (Figure 10-52).
Figure 10-52 VAS Warning
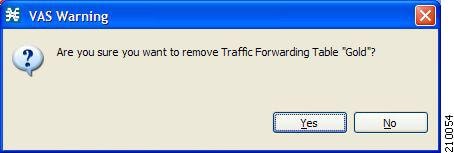
Step 6 ![]() Click Yes.
Click Yes.
The selected table is deleted and is no longer displayed in the list of traffic-forwarding tables.
Step 7 ![]() Click Close.
Click Close.
The VAS Settings dialog box closes.
How to Add VAS Traffic-Forwarding Tables
A default traffic-forwarding table is included in the service configuration. You can add up to 63 more traffic-forwarding tables, and then assign different traffic-forwarding tables to different packages.
Step 1 ![]() From the Policies tab in the left pane, choose Configuration > Policies > VAS Settings.
From the Policies tab in the left pane, choose Configuration > Policies > VAS Settings.
The VAS Settings dialog box appears.
Step 2 ![]() Click the Enable Traffic Forwarding radio button.
Click the Enable Traffic Forwarding radio button.
Step 3 ![]() Click the Traffic Forwarding Tables tab.
Click the Traffic Forwarding Tables tab.
The Traffic Forwarding Tables tab opens (Figure 10-53).
Figure 10-53 VAS Settings - Add VAS Traffic-Forwarding Tables
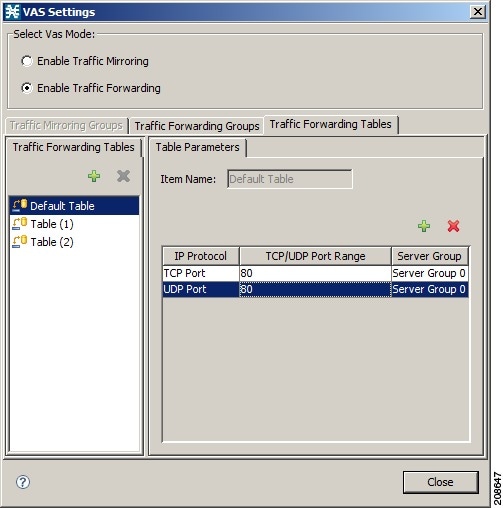
Step 4 ![]() In the Traffic Forwarding Tables area, click the Add () icon.
In the Traffic Forwarding Tables area, click the Add () icon.
A new table named Table (n), where n is a value from 1 through 63, is added to the list of traffic-forwarding tables in the Traffic Forwarding Tables area.
The table name is also displayed in the Item Name box in the Table Parameters tab.
Step 5 ![]() In the Item Name field, enter a unique and relevant name for the traffic-forwarding table.
In the Item Name field, enter a unique and relevant name for the traffic-forwarding table.
You can now add table parameters to the new traffic-forwarding table, see "How to Add VAS Table Parameters" section.
Managing VAS Table Parameters
A table parameter is an IP protocol type, an associated TCP/UDP port (where applicable), and a VAS server group or a range of IP addresses.
A traffic-forwarding table is a collection of related table parameters.
A traffic-forwarding table can contain up to 64 table parameters.
•![]() How to Add VAS Table Parameters
How to Add VAS Table Parameters
•![]() How to Edit VAS Table Parameters
How to Edit VAS Table Parameters
•![]() How to Delete VAS Table Parameters
How to Delete VAS Table Parameters
How to Add VAS Table Parameters
You can add up to 64 table parameters to a traffic-forwarding table.
Step 1 ![]() From the Policies tab in the left pane, choose Configuration > Policies > VAS Settings.
From the Policies tab in the left pane, choose Configuration > Policies > VAS Settings.
The VAS Settings dialog box appears.
Step 2 ![]() Click the Enable Traffic Forwarding radio button.
Click the Enable Traffic Forwarding radio button.
Step 3 ![]() Click the Traffic Forwarding Tables tab.
Click the Traffic Forwarding Tables tab.
The Traffic Forwarding Tables tab opens.
Step 4 ![]() From the list of traffic-forwarding tables in the Traffic Forwarding Tables area, select a table.
From the list of traffic-forwarding tables in the Traffic Forwarding Tables area, select a table.
Step 5 ![]() In the Traffic Parameters tab, click the Add () icon.
In the Traffic Parameters tab, click the Add () icon.
A new table parameter is added to the list of table parameters in the Table Parameters tab.
Note ![]() Each new table parameter has the default values as listed in Table 10-4.
Each new table parameter has the default values as listed in Table 10-4.
|
|
|
IP Protocol |
TCP Port |
TCP/UDP Port Range |
80 |
Server Group |
Server Group 0 |
You can now edit the new table parameter, as described in the following section.
Step 6 ![]() Click Close.
Click Close.
The VAS Settings dialog box closes.
How to Edit VAS Table Parameters
Step 1 ![]() From the Policies tab in the left pane, choose Configuration > Policies > VAS Settings.
From the Policies tab in the left pane, choose Configuration > Policies > VAS Settings.
The VAS Settings dialog box appears.
Step 2 ![]() Click the Enable Traffic Forwarding radio button.
Click the Enable Traffic Forwarding radio button.
Step 3 ![]() Click the Traffic Forwarding Tables tab.
Click the Traffic Forwarding Tables tab.
The Traffic Forwarding Tables tab opens.
Step 4 ![]() From the list of traffic-forwarding tables in the Traffic Forwarding Tables area, select a table.
From the list of traffic-forwarding tables in the Traffic Forwarding Tables area, select a table.
Step 5 ![]() In the table in the Table Parameters tab select a protocol, port, and server group.
In the table in the Table Parameters tab select a protocol, port, and server group.
a. ![]() Click in a cell in the IP Protocol column, and, from the drop-down list that opens, select an IP protocol type (Figure 10-54).
Click in a cell in the IP Protocol column, and, from the drop-down list that opens, select an IP protocol type (Figure 10-54).
Figure 10-54 Table Parameters Tab
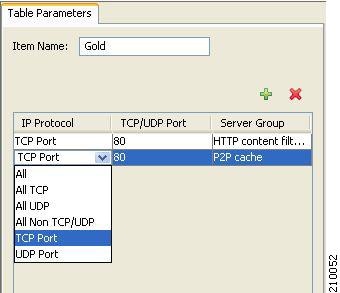
If you select All, All TCP, All UDP, or All Non TCP/UDP, "N/A" appears in the TCP/UDP Port cell when you move to another cell in the table.
b. ![]() If you selected TCP Port or UDP Port, double-click in the cell in the TCP/UDP Port Range column, and enter the port number or a range of ports.
If you selected TCP Port or UDP Port, double-click in the cell in the TCP/UDP Port Range column, and enter the port number or a range of ports.
c. ![]() Click in the cell in the Server Group column, and, from the drop-down list that opens, select a server group (Figure 10-55).
Click in the cell in the Server Group column, and, from the drop-down list that opens, select a server group (Figure 10-55).
Figure 10-55 Tables Parameters Tab
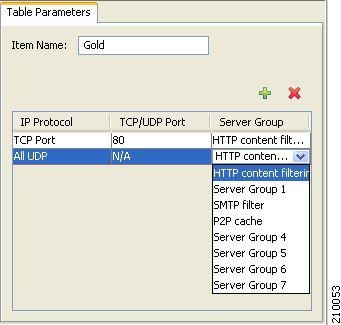
Step 6 ![]() Click Close.
Click Close.
The VAS Settings dialog box closes.
How to Delete VAS Table Parameters
Step 1 ![]() From the Policies tab in the left pane, choose Configuration > Policies > VAS Settings.
From the Policies tab in the left pane, choose Configuration > Policies > VAS Settings.
The VAS Settings dialog box appears.
Step 2 ![]() Click the Enable Traffic Forwarding radio button.
Click the Enable Traffic Forwarding radio button.
Step 3 ![]() Click the Traffic Forwarding Tables tab.
Click the Traffic Forwarding Tables tab.
The Traffic Forwarding Tables tab opens.
Step 4 ![]() From the list of traffic-forwarding tables in the Traffic Forwarding Tables area, select a table.
From the list of traffic-forwarding tables in the Traffic Forwarding Tables area, select a table.
Step 5 ![]() From the list of table parameters in the Table Parameters tab, select a table parameter.
From the list of table parameters in the Table Parameters tab, select a table parameter.
Step 6 ![]() Click the Delete () icon.
Click the Delete () icon.
The selected table parameter is deleted and is no longer displayed in the list of table parameters.
Step 7 ![]() Click Close.
Click Close.
The VAS Settings dialog box closes.
Managing the Protected URL Database
The Cisco SCE Protected URL Database is a database that contains a "blacklist," a list of websites that are considered off limits or dangerous. You can configure the Cisco SCE to apply a specific action, such as blocking a site, when a subscriber attempts to access a site listed on the blacklist.
The database is encrypted so that no one, including the operator, can view the blacklist. The blacklist is managed on the Cisco SCE and cannot be withdrawn to the management PC.
RDRs are created when a subscriber attempts to access a link included in the blacklist. However, the RDRs do not contains the URL or Host information of the site.
To enable the blacklist feature, you must do the following:
•![]() Define an HTTP flavor
Define an HTTP flavor
•![]() Create a blacklist service
Create a blacklist service
•![]() Assign the HTTP flavor to the blacklist service
Assign the HTTP flavor to the blacklist service
•![]() Create a rule for the blacklist service
Create a rule for the blacklist service
•![]() Assign black list entries to the flavor, using the CLI
Assign black list entries to the flavor, using the CLI
For more information about the Protected URL Database, see the Cisco Service Control URL Blacklisting Solution Guide.
 Feedback