- About this Guide
- Cisco Service Control Overview
- System Overview
- Traffic Processing Overview
- Getting Started
- Using the Network Navigator
- Using the Service Configuration Editor
- Using the Service Configuration Editor: Traffic Classification
- Using the Service Configuration Editor: Traffic Accounting and Reporting
- Using the Service Configuration Editor: Traffic Control
- Using the Service Configuration Editor: Additional Options
- Using the Subscriber Manager GUI Tool
- Using the Signature Editor
- Additional Management Tools and Interfaces
Cisco Service Control Application for Broadband User Guide, Release 3.6.x
Bias-Free Language
The documentation set for this product strives to use bias-free language. For the purposes of this documentation set, bias-free is defined as language that does not imply discrimination based on age, disability, gender, racial identity, ethnic identity, sexual orientation, socioeconomic status, and intersectionality. Exceptions may be present in the documentation due to language that is hardcoded in the user interfaces of the product software, language used based on RFP documentation, or language that is used by a referenced third-party product. Learn more about how Cisco is using Inclusive Language.
- Updated:
- May 11, 2011
Chapter: Getting Started
- Introduction
- How to Install SCA BB
Getting Started
Introduction
The module guides you through the process of installing or upgrading the Cisco Service Control Application for Broadband (SCA BB):
•![]() Explains how to install Protocol Packs, which contain new and updated protocol signatures
Explains how to install Protocol Packs, which contain new and updated protocol signatures
•![]() Describes the concept of the Console as a collection of tools, presents each tool and its role, and describes how to launch the tools and navigate between them
Describes the concept of the Console as a collection of tools, presents each tool and its role, and describes how to launch the tools and navigate between them
•![]() Concludes with a Quick Start that describes how to apply your first service configuration and generate your first report
Concludes with a Quick Start that describes how to apply your first service configuration and generate your first report
How to Install SCA BB

Note ![]() The SCA BB application can only be installed in the administrator user group of Windows XP. During installation the SCA BB application will change registry entries, therefore installation in normal user groups is not allowed. The installer must have administrator privileges assigned.
The SCA BB application can only be installed in the administrator user group of Windows XP. During installation the SCA BB application will change registry entries, therefore installation in normal user groups is not allowed. The installer must have administrator privileges assigned.
You install SCA BB in two stages:
1. ![]() Install the SCA BB front ends:
Install the SCA BB front ends:
–![]() The SCA BB Console
The SCA BB Console
–![]() The SCA BB Service Configuration Utility, the SCA BB Signature Configuration Utility, and the SCA BB Real-Time Monitoring Configuration Utility
The SCA BB Service Configuration Utility, the SCA BB Signature Configuration Utility, and the SCA BB Real-Time Monitoring Configuration Utility
2. ![]() Install the SCA BB application components:
Install the SCA BB application components:
–![]() The SCA BB Service Modeling Language Loadable Image (SLI) and the SCA BB Service Control Engine (SCE) applicative management plug-in
The SCA BB Service Modeling Language Loadable Image (SLI) and the SCA BB Service Control Engine (SCE) applicative management plug-in
–![]() The SCA BB Subscriber Manager applicative management plug-in (for systems with a Cisco Service Control Management Suite [SCMS] Subscriber Manager [SM])
The SCA BB Subscriber Manager applicative management plug-in (for systems with a Cisco Service Control Management Suite [SCMS] Subscriber Manager [SM])
If you are upgrading an existing installation of SCA BB, see How to Upgrade the SCE Using the SCE Software Upgrade Wizard or Working with Protocol Packs.
The SCA BB Installation Package
The SCA BB installation package is a ZIP file located in the CCO.
The installation package consists of the following files:
•![]() The installer for the Console: scas-bb-console-<version>-<build>.exe.
The installer for the Console: scas-bb-console-<version>-<build>.exe.
•![]() A Cisco installation application package file (PQI file) for each type of SCE platform. Each PQI file is located in a subfolder whose name is the platform name.
A Cisco installation application package file (PQI file) for each type of SCE platform. Each PQI file is located in a subfolder whose name is the platform name.
•![]() The file scas_bb_util.tgz, which contains the files for the SCA BB Service Configuration Utility (servconf), the SCA BB Signature Configuration Utility (sigconf), and the SCA BB Real-Time Monitoring Configuration Utility (rtmcmd) (together with real-time monitoring report templates).
The file scas_bb_util.tgz, which contains the files for the SCA BB Service Configuration Utility (servconf), the SCA BB Signature Configuration Utility (sigconf), and the SCA BB Real-Time Monitoring Configuration Utility (rtmcmd) (together with real-time monitoring report templates).
•![]() The file PCubeEngageMib.mib, which defines the SCAS BB MIB, located in the SNMP subfolder.
The file PCubeEngageMib.mib, which defines the SCAS BB MIB, located in the SNMP subfolder.
•![]() The SCA BB Service Configuration Java API distribution file: serviceconfig-java-api-dist.tgz.
The SCA BB Service Configuration Java API distribution file: serviceconfig-java-api-dist.tgz.
•![]() The file surfcontrol.xml, which lists the content categories for content filtering using SurfControl Content Port Authority, located in the URL Filtering subfolder.
The file surfcontrol.xml, which lists the content categories for content filtering using SurfControl Content Port Authority, located in the URL Filtering subfolder.
Installing SCA BB Application Components
SCA BB has two software components that reside on the SCE platform:
•![]() The SCA BB SLI, which performs traffic processing
The SCA BB SLI, which performs traffic processing
•![]() The SCA BB SCE applicative management plug-in, which performs some service configuration operations
The SCA BB SCE applicative management plug-in, which performs some service configuration operations
SCA BB also has one software component that resides on the SM device:
•![]() The SCA BB SM applicative management plug-in, which performs some application-specific subscriber management operations
The SCA BB SM applicative management plug-in, which performs some application-specific subscriber management operations
To install these components from the Console, see How to Install PQI Files on SCE Devices and Managing CM Devices.
To install these components from a command line, see Installing PQI Files from the Command Line.
Prerequisites
Before installing SCA BB, verify that the SCE platform and, if used, the SCMS-SM are operational and are running appropriate versions of their software.
•![]() How to Verify that the SCE Platform is Operational
How to Verify that the SCE Platform is Operational
•![]() How to Verify that the SCE Platform is Running an Appropriate Version of the OS
How to Verify that the SCE Platform is Running an Appropriate Version of the OS
•![]() How to Verify that the SM is Correctly Installed
How to Verify that the SM is Correctly Installed
•![]() How to Verify that an Appropriate Version of the SM is Running
How to Verify that an Appropriate Version of the SM is Running
How to Verify that the SCE Platform is Operational
Step 1 ![]() Verify that the status LED on the SCE flashes green. (Orange—booting up; flashing orange—warning; red—failure.)
Verify that the status LED on the SCE flashes green. (Orange—booting up; flashing orange—warning; red—failure.)
How to Verify that the SCE Platform is Running an Appropriate Version of the OS
Step 1 ![]() At the SCE platform CLI prompt
At the SCE platform CLI prompt (SCE#), type show version.
Step 2 ![]() Press Enter.
Press Enter.
The response shows the version of the OS running on the SCE platform.
How to Verify that the SM is Correctly Installed
Step 1 ![]() Open a Telnet session to the SM.
Open a Telnet session to the SM.
Step 2 ![]() Go to the SM bin directory and type
Go to the SM bin directory and type p3sm --sm-status.
Step 3 ![]() Press Enter.
Press Enter.
The response to this command displays the operational status of the SM.
How to Verify that an Appropriate Version of the SM is Running
Step 1 ![]() Open a Telnet session to the SM.
Open a Telnet session to the SM.
Step 2 ![]() Go to the SM bin directory and type
Go to the SM bin directory and type p3sm version.
Step 3 ![]() Press Enter.
Press Enter.
The response to this command displays the SM version.
How to Install SCA BB Front Ends
You should install the following SCA BB front ends:
•![]() The Console
The Console
•![]() The SCA BB Service Configuration Utility (servconf), the SCA BB Signature Configuration Utility (sigconf), and the SCA BB Real-Time Monitoring Configuration tool (rtmcmd) (together with associated real-time monitoring report templates)
The SCA BB Service Configuration Utility (servconf), the SCA BB Signature Configuration Utility (sigconf), and the SCA BB Real-Time Monitoring Configuration tool (rtmcmd) (together with associated real-time monitoring report templates)
–![]() servconf requires access to the Java Runtime Environment (JRE) (see Installing the Java Runtime Environment).
servconf requires access to the Java Runtime Environment (JRE) (see Installing the Java Runtime Environment).
Hardware Requirements
•![]() At least 1024 MB RAM is required to run the Console.
At least 1024 MB RAM is required to run the Console.
•![]() The minimal supported screen resolution for the Console is 1024x768 pixels.
The minimal supported screen resolution for the Console is 1024x768 pixels.
Operating System Requirements
The SCA Reporter GUI front end can be installed on any computer running Windows 2000, Windows XP, Windows Vista, or Windows 7.
Installing the Java Runtime Environment
The SCA BB Service Configuration Utility, servconf, requires access to JRE version 1.6.
You can download a JRE from the Sun™ website at http://java.com/en/download/.
To verify that the JRE is installed, run java -version from the command prompt. The Java version should start with 1.6.
If a different version of JRE is also installed on the workstation, you may need to tell servconf where to find the appropriate JRE. Do this by setting the JAVA_HOME environment variable to point to the JRE 1.6 installation directory. For example:
JAVA_HOME=C:\Program Files\Java\j2re1.6_08
How to Install the Console
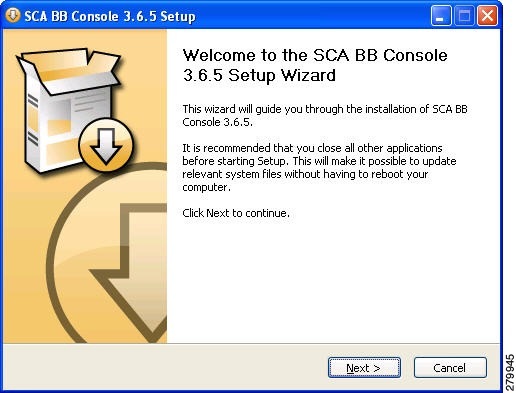
Step 1 ![]() Navigate to the Console installation file, sca-bb-console-3.6.5.exe, and double-click it.
Navigate to the Console installation file, sca-bb-console-3.6.5.exe, and double-click it.
The Welcome page of the SCA BB Console 3.6.5 Setup wizard appears (see Figure 4-1).
Figure 4-1 Welcome to the SCA BB Console 3.6.5 Setup Wizard
Step 2 ![]() Click Next.
Click Next.
The Install Location page of the Setup wizard opens (see Figure 4-2).
Figure 4-2 Choose Install Location
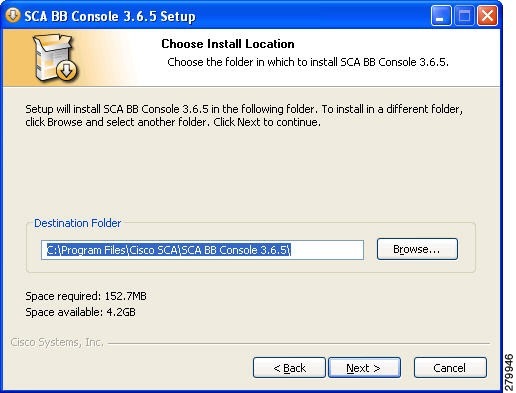
Step 3 ![]() (Optional) Click Browse and choose a different destination folder.
(Optional) Click Browse and choose a different destination folder.
Step 4 ![]() Click Next.
Click Next.
The Start Menu Folder page of the Setup wizard opens (see Figure 4-3).
Figure 4-3 Choose Start Menu Folder
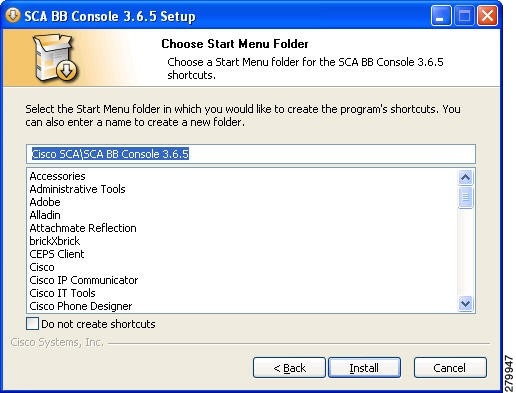
Step 5 ![]() (Optional) Enter a different Start Menu folder in the Start Menu Folder field.
(Optional) Enter a different Start Menu folder in the Start Menu Folder field.
Step 6 ![]() (Optional) Check the Do not create shortcuts check box.
(Optional) Check the Do not create shortcuts check box.
Step 7 ![]() Click Install.
Click Install.
The Installing page of the Setup wizard opens (see Figure 4-4).
Figure 4-4 Installing
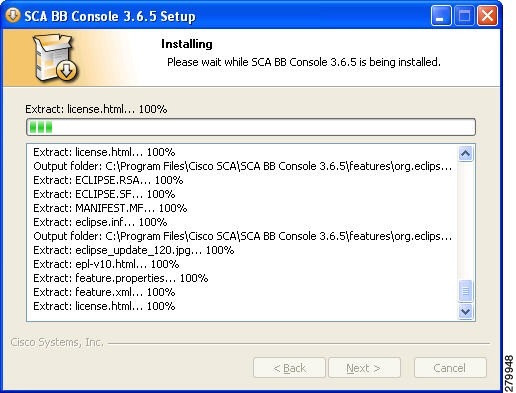
Step 8 ![]() Wait until the installation is complete.
Wait until the installation is complete.
The Next button is enabled.
Step 9 ![]() Click Next.
Click Next.
The Installation Complete page of the Setup wizard opens (see Figure 4-5).
Figure 4-5 Completing the SCA BB Console 3.6.5 Setup Wizard
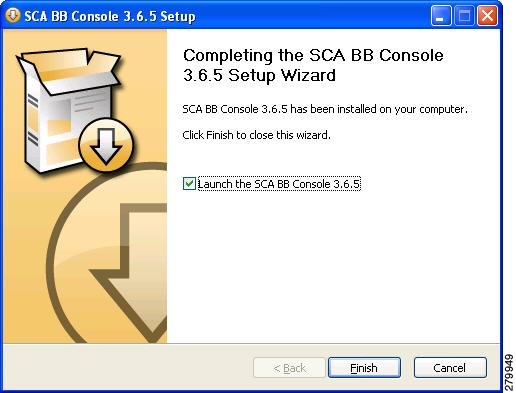
Step 10 ![]() To launch the Console, check the Run SCA BB Console after installation check box.
To launch the Console, check the Run SCA BB Console after installation check box.
Step 11 ![]() Click Finish.
Click Finish.
The SCA BB Console 3.6.5 Setup wizard closes.
The Console is now installed on the machine.
A shortcut is added to the Start menu.
How to Install the SCA BB Configuration Utilities
Step 1 ![]() From the SCA BB installation package, extract the file scas_bb_util.tgz, and copy it to a Windows, Solaris, or Linux workstation.
From the SCA BB installation package, extract the file scas_bb_util.tgz, and copy it to a Windows, Solaris, or Linux workstation.
Step 2 ![]() Unpack the file to a new folder.
Unpack the file to a new folder.
The SCA BB Service Configuration Utility (servconf), the SCA BB Real-Time Monitoring Configuration Utility (rtmcmd) (and associated real-time monitoring report templates), and the SCA BB Signature Configuration Utility (sigconf) are located under the bin folder.
How to Upgrade SCA BB Components
Upgrading SCA BB includes upgrading each of the following software components:
•![]() SCE Firmware
SCE Firmware
•![]() The SCE PQI file
The SCE PQI file
•![]() Protocol Pack SPQI file
Protocol Pack SPQI file
•![]() Policy file
Policy file
Note ![]() This section describes the upgrade of SCA BB application components only. For a full description of the entire Cisco solution upgrade procedure, consult the solution upgrade document accompanying the formal release.
This section describes the upgrade of SCA BB application components only. For a full description of the entire Cisco solution upgrade procedure, consult the solution upgrade document accompanying the formal release.
•![]() When you upgrade old PQB files, some protocol IDs are changed automatically. Messages such as the following may be displayed to indicate the change:
When you upgrade old PQB files, some protocol IDs are changed automatically. Messages such as the following may be displayed to indicate the change:
Protocol ID of BaiBao changed from 80 to 43
Protocol ID of PPLive changed from 81 to 44
•![]() When you upgrade a device with a new SPQI or PQI file, all other devices that are not upgraded may fail.
When you upgrade a device with a new SPQI or PQI file, all other devices that are not upgraded may fail.
•![]() New SCA BB releases do not use the default Dynamic Signature Script (DSS) file (see that it was installed for a previous SCA BB release).
New SCA BB releases do not use the default Dynamic Signature Script (DSS) file (see that it was installed for a previous SCA BB release).
•![]() If a protocol pack for the new release is available, install it after the product installation is complete. Do not install an old protocol pack on top of a new product installation.
If a protocol pack for the new release is available, install it after the product installation is complete. Do not install an old protocol pack on top of a new product installation.
How to Upgrade the SCE Using the SCE Software Upgrade Wizard
You can upgrade the SCE using the Network Navigator Tool via the SCE Software Upgrade wizard.
Step 1 ![]() Open the Network Navigator.
Open the Network Navigator.
Step 2 ![]() Choose one or more devices in the Site Manager tree.
Choose one or more devices in the Site Manager tree.
Step 3 ![]() Right-click one of the selected devices.
Right-click one of the selected devices.
Step 4 ![]() From the popup menu that appears, choose SCE Software Upgrade wizard.
From the popup menu that appears, choose SCE Software Upgrade wizard.
The SCE Software Upgrade wizard appears (see Figure 4-6).
Figure 4-6 SCE Software Upgrade
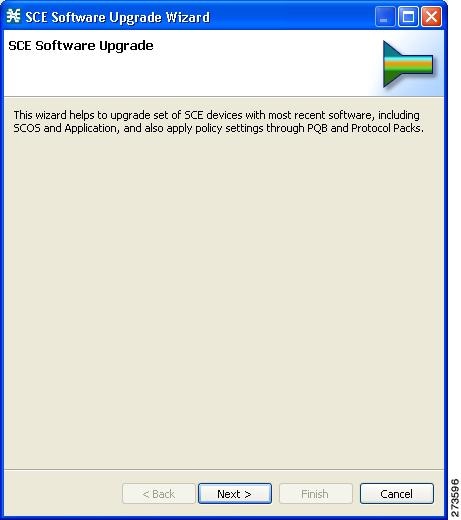
Step 5 ![]() Click Next.
Click Next.
The SCE IP Addresses page of the SCE Software Upgrade wizard opens (see Figure 4-7).
Figure 4-7 SCE IP Address
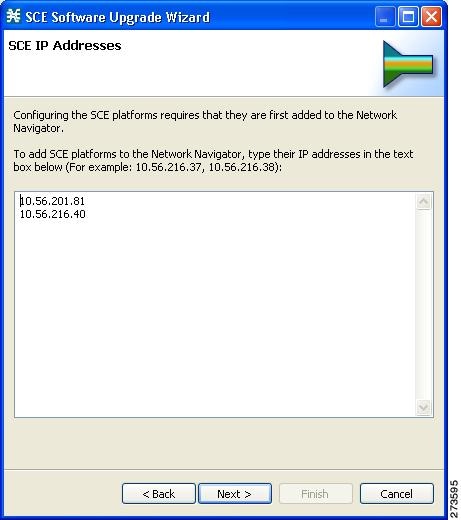
Step 6 ![]() (Optional) In the edit box, enter additional IP addresses.
(Optional) In the edit box, enter additional IP addresses.
Step 7 ![]() Click Next.
Click Next.
The SCE Usernames and Passwords page of the SCE Software Upgrade wizard opens (see Figure 4-8).
Figure 4-8 SCE Usernames and Passwords
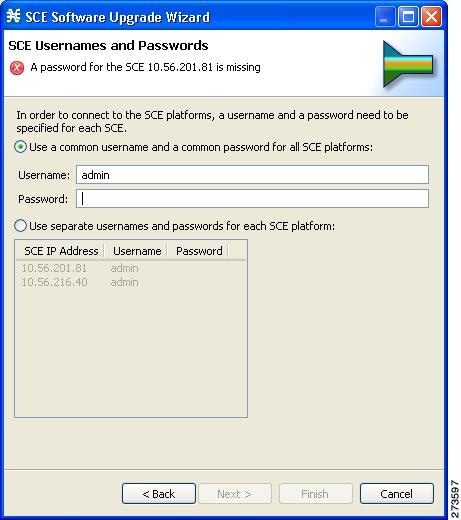
Step 8 ![]() Enter the usernames and passwords for the SCE devices.
Enter the usernames and passwords for the SCE devices.
Do one of the following:
•![]() To use the same username and password for all the SCE devices that you are adding, enter the username in the Username field and the password in the Password field.
To use the same username and password for all the SCE devices that you are adding, enter the username in the Username field and the password in the Password field.
•![]() To provide a different username and password pair for each SCE device, click the Use separate usernames and passwords for each SCE platform radio button, and, for each SCE device, enter the username and password in the appropriate cell of the table.
To provide a different username and password pair for each SCE device, click the Use separate usernames and passwords for each SCE platform radio button, and, for each SCE device, enter the username and password in the appropriate cell of the table.
Step 9 ![]() Click Next.
Click Next.
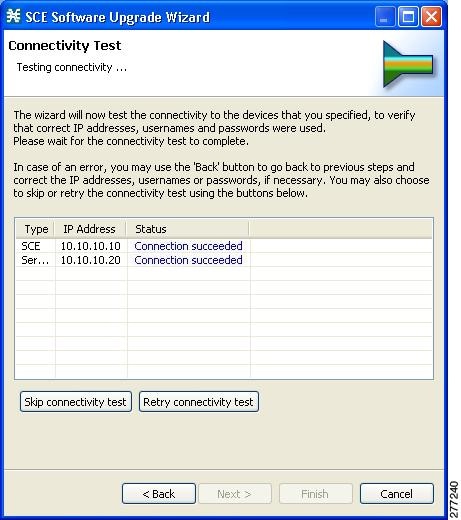
The Connectivity Test page of the SCE Software Upgrade wizard opens (see Figure 4-9).
Figure 4-9 Connectivity Test

The wizard tests to see that the connections to the defined devices can be made.
Note ![]() If a connection to one or more of the devices cannot be made or if there is some problem with the connection (such as invalid version of the device) an error is displayed next to the device. You can skip these tests by clicking Skip connectivity test. The connections are validated when you click Finish at the end of the wizard.
If a connection to one or more of the devices cannot be made or if there is some problem with the connection (such as invalid version of the device) an error is displayed next to the device. You can skip these tests by clicking Skip connectivity test. The connections are validated when you click Finish at the end of the wizard.
Step 10 ![]() Click Next.
Click Next.
The SCE Firmware (PKG) Installation page of the SCE Software Upgrade wizard opens (see Figure 4-10).
Figure 4-10 SCE Firmware (PKG) Installation
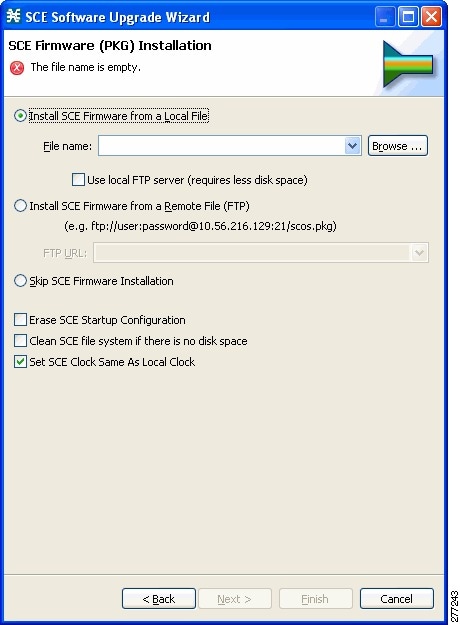
Choose the SCE Firmware installation file.
Do one of the following:
•![]() To install SCE Firmware from a local file, click Browse.
To install SCE Firmware from a local file, click Browse.
A Select file dialog box appears.
Browse to the SCE Firmware installation file that you are installing.
Check the Use local FTP server check box to reduce the disk space usage.
•![]() To download SCE Firmware from a remote site, choose the Install SCE Firmware from a Remote File (FTP) radio button and in the FTP URL field, enter the URL.
To download SCE Firmware from a remote site, choose the Install SCE Firmware from a Remote File (FTP) radio button and in the FTP URL field, enter the URL.
Step 11 ![]() Click the Skip SCE Firmware Installation radio button.
Click the Skip SCE Firmware Installation radio button.
Step 12 ![]() Click Next.
Click Next.
The SCE Application Software (PQI) Installation page of the SCE Software Upgrade wizard opens (see Figure 4-11).
Figure 4-11 SCE Application Software (PQI) Installation
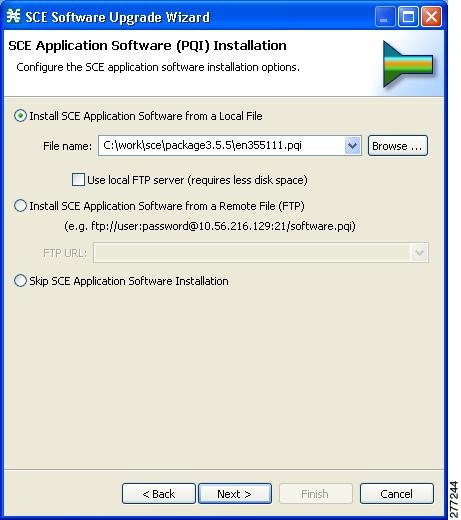
Step 13 ![]() Choose the PQI installation file.
Choose the PQI installation file.
Do one of the following:
•![]() To install the PQI file from a local file, click Browse.
To install the PQI file from a local file, click Browse.
A Select file dialog box appears.
Browse to the PQI file that you are installing.
Check the Use local FTP server check box to reduce the disk space usage.
•![]() To download a PQI file from a remote site, choose the Install SCE Application Software from a Remote File (FTP) radio button and in the FTP URL field, enter the URL.
To download a PQI file from a remote site, choose the Install SCE Application Software from a Remote File (FTP) radio button and in the FTP URL field, enter the URL.
Click the Skip SCE Software Application Installation radio button.
Step 14 ![]() Click Next.
Click Next.
The Protocol Pack (SPQI) Update page of the SCE Software Upgrade wizard opens (see Figure 4-12).
Figure 4-12 Protocol Pack (SPQI) Update
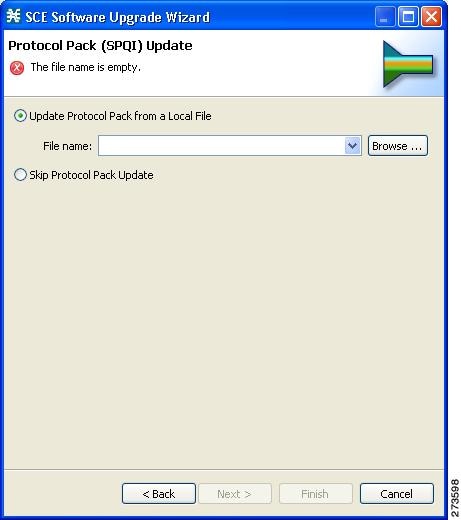
Step 15 ![]() Update the protocol pack.
Update the protocol pack.
Do one of the following:
•![]() To update the SPQI file from a local file, click Browse.
To update the SPQI file from a local file, click Browse.
A Select file dialog box appears.
Browse to the SPQI file that you are updating.
•![]() Click the Skip Protocol Pack Update radio button.
Click the Skip Protocol Pack Update radio button.
Step 16 ![]() Click Next.
Click Next.
The Service Configuration (PQB) Update page of the SCE Software Upgrade wizard opens (see Figure 4-13).
Figure 4-13 Service Configuration (PQB) Update
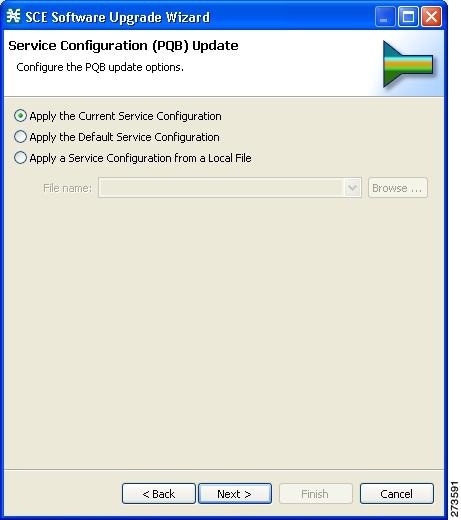
Step 17 ![]() Choose one of the PQB update options.
Choose one of the PQB update options.
•![]() Apply the Current Service Configuration—Keep the existing service configuration.
Apply the Current Service Configuration—Keep the existing service configuration.
•![]() Apply the Default Service Configuration—Apply the default service configuration delivered with the product.
Apply the Default Service Configuration—Apply the default service configuration delivered with the product.
•![]() Apply the Service Configuration from a Local File—Apply a service configuration from a local file.
Apply the Service Configuration from a Local File—Apply a service configuration from a local file.
Step 18 ![]() If you selected the Apply the Service Configuration form a Local File radio button, click Browse.
If you selected the Apply the Service Configuration form a Local File radio button, click Browse.
A Select file dialog box appears.
Browse to the file containing the service configuration.
Step 19 ![]() Click Next.
Click Next.
The Connectivity Test window of the SCE Software Upgrade wizard opens.
The connectivity test verifies the connections to the defined devices.
Note ![]() If a connection to one or more of the devices cannot be made or if there is some problem with the connection (such as invalid version of the device), an error is displayed next to the device. You can skip these tests by clicking Skip connectivity test. The connections are validated when you click Finish at the end of the wizard.
If a connection to one or more of the devices cannot be made or if there is some problem with the connection (such as invalid version of the device), an error is displayed next to the device. You can skip these tests by clicking Skip connectivity test. The connections are validated when you click Finish at the end of the wizard.
Figure 4-14
Connectivity Test
Step 20 ![]() Click Next.
Click Next.
The Confirmation page of the SCE Software Upgrade wizard opens (see Figure 4-15).
Figure 4-15 Summary Page
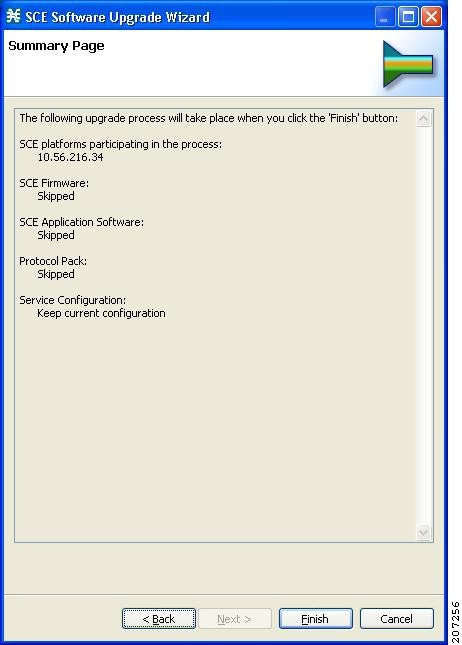
The actions that the wizard is about to take are listed on the page.
Step 21 ![]() Click Finish.
Click Finish.
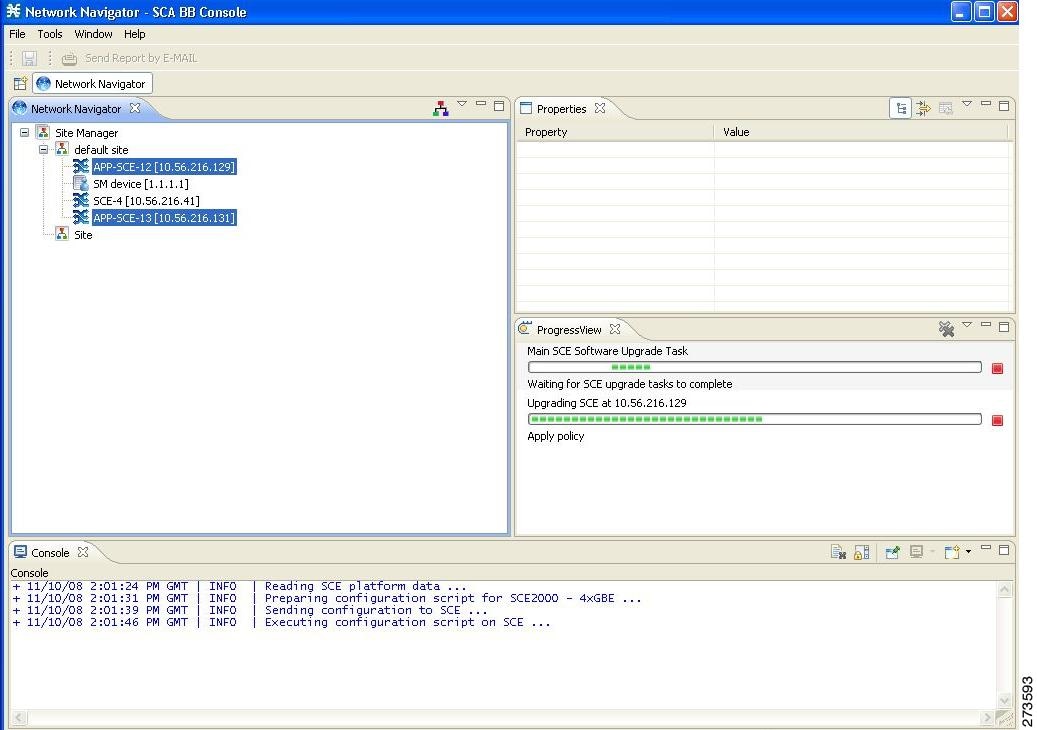
You can view the progress in the Progress view (see Figure 4-16).
Figure 4-16 Progress
Working with Protocol Packs
SCA BB uses stateful Layer 7 capabilities for classification of traffic flows.
When a traffic flow is handled by the system, it is assigned a signature ID according to the set of Layer 3 to Layer 7 parameters (the signature) characterizing this flow. Typically, these signatures come embedded in SCA BB.
To enable rapid response to the ever-changing protocol environment, SCA BB was enhanced to allow signatures to be updated dynamically. You can load a protocol support plug-in onto an operational system, enhancing the system's protocol support without compromising the stability of the system (no update of an existing software component is required) and without any service downtime.
•![]() Installing the Service Hierarchy Tree
Installing the Service Hierarchy Tree
•![]() How to Verify Version Compatibility for Protocol Packs
How to Verify Version Compatibility for Protocol Packs
•![]() How to Verify the Installation of a Protocol Pack
How to Verify the Installation of a Protocol Pack
Protocol Packs
Periodically, Cisco publishes protocol packs containing new and improved protocol signatures for SCA BB. A typical protocol pack is a file containing signatures for detecting network worms, popular peer-to-peer applications, and other relevant protocols. When loaded into SCE platforms, these signatures improve SCA BB classification abilities.
Note ![]() You can install a protocol pack on an SCE platform only if a PQI is already installed on the platform.
You can install a protocol pack on an SCE platform only if a PQI is already installed on the platform.
A protocol pack for SCA BB may be either a DSS file or an SPQI file:
•![]() Loading a DSS file to the SCE platform requires no downtime of SCA BB or the platform.
Loading a DSS file to the SCE platform requires no downtime of SCA BB or the platform.
•![]() Loading an SPQI file to the SCE platform entails updating the SCE application:
Loading an SPQI file to the SCE platform entails updating the SCE application:
–![]() If hitless upgrade (see Hitless Upgrade of the SLI) is enabled, there is no downtime of the SCE platform when loading the SPQI file.
If hitless upgrade (see Hitless Upgrade of the SLI) is enabled, there is no downtime of the SCE platform when loading the SPQI file.
–![]() If hitless upgrade is not enabled, loading an SPQI file requires a short downtime (up to one minute) of the SCE platform. During that time, network traffic bypasses the platform and is neither controlled nor reported.
If hitless upgrade is not enabled, loading an SPQI file requires a short downtime (up to one minute) of the SCE platform. During that time, network traffic bypasses the platform and is neither controlled nor reported.
Note ![]() If hitless upgrade is disabled, SPQI installation can cause the loss of the following subscriber data from all subscribers: package ID, real-time monitoring flag, and quota settings. Subscribers are assigned default values for these properties.
If hitless upgrade is disabled, SPQI installation can cause the loss of the following subscriber data from all subscribers: package ID, real-time monitoring flag, and quota settings. Subscribers are assigned default values for these properties.
Installing Protocol Packs
You install a protocol pack on an SCE platform using one of the following:
•![]() The SCA BB Service Configuration Utility
The SCA BB Service Configuration Utility
•![]() The Network Navigator tool (see How to Install a Protocol Pack)
The Network Navigator tool (see How to Install a Protocol Pack)
Note ![]() If the protocol pack is an SPQI file you can enable and configure the hitless upgrade option using Hitless Upgrade CLI commands. (See Hitless Upgrade of the SLI.)
If the protocol pack is an SPQI file you can enable and configure the hitless upgrade option using Hitless Upgrade CLI commands. (See Hitless Upgrade of the SLI.)
The tool or utility performs the following steps:
1. ![]() Retrieves the current service configuration from the SCE platform and (optionally) stores a backup copy in a folder that you specify.
Retrieves the current service configuration from the SCE platform and (optionally) stores a backup copy in a folder that you specify.
2. ![]() Imports the signatures that are in the DSS or SPQI file into the service configuration. This overwrites any DSS that was previously imported into the service configuration.
Imports the signatures that are in the DSS or SPQI file into the service configuration. This overwrites any DSS that was previously imported into the service configuration.
3. ![]() For each new signature that includes a Buddy Protocol attribute (an attribute that points to an existing protocol) (see The Buddy Protocol)—Adds the new signature to all services that include the buddy protocol.
For each new signature that includes a Buddy Protocol attribute (an attribute that points to an existing protocol) (see The Buddy Protocol)—Adds the new signature to all services that include the buddy protocol.
4. ![]() If the protocol pack is an SPQI file—Replaces the SCE application. This causes a short (up to one minute) downtime in SCE platform service.
If the protocol pack is an SPQI file—Replaces the SCE application. This causes a short (up to one minute) downtime in SCE platform service.
5. ![]() Applies the new service configuration to the SCE platform.
Applies the new service configuration to the SCE platform.
If the protocol pack is an SPQI file and the hitless upgrade option is enabled, you can monitor the progress of the upgrade using Hitless Upgrade CLI Commands.
Installing the Service Hierarchy Tree
Opening a PQB using the Client (GUI) exposes its service hierarchy tree (signatures, flavors, protocols, and so forth). The Service Configuration Hierarchy is defined by the Client.
When loading a PQB file from the SCE, it is essential that the PQB Hierarchy Tree is the same version as the one in the Client, or in other words, the PQB must be the same version as the Client, otherwise the PQB does not open.
Because the client can be connected with different SCE with different versions, and each PQB can have different Service Hierarchy Tree definition, the user needs to install the relevant Service Hierarchy Tree in the Client (GUI) before opening a PQB.
The client has the ability to install the service hierarchy tree according to the SCE version. The GUI installation comes with a fixed set of service hierarchy elements which are placed in a specific version related jar files. This enables the user to select between different jars related to different versions.
Note ![]() The SCE service hierarchy tree is different than the client version. When installing a service hierarchy tree for a SCE:
The SCE service hierarchy tree is different than the client version. When installing a service hierarchy tree for a SCE:
•![]() Always back up user PQB prior to upgrade to PPXY and keep a copy since the PQB is changed.
Always back up user PQB prior to upgrade to PPXY and keep a copy since the PQB is changed.
•![]() Remove/Reinstall Service Tree Protocol.
Remove/Reinstall Service Tree Protocol.
To view, install, and remove the service hierarchy tree use the following procedures:
•![]() View and Install Service Hierarchy Tree
View and Install Service Hierarchy Tree
•![]() Remove Service Hierarchy Tree
Remove Service Hierarchy Tree
View and Install Service Hierarchy Tree
Step 1 ![]() To view the service hierarchy tree, open the Protocol Pack tab.
To view the service hierarchy tree, open the Protocol Pack tab.
Step 2 ![]() From the toolbar, select Service Configuration Editor (see Figure 4-17).
From the toolbar, select Service Configuration Editor (see Figure 4-17).
Figure 4-17 Service Configuration Editor - Preferences
Step 3 ![]() Select Preferences and then select Service Configuration.
Select Preferences and then select Service Configuration.
A Preferences window opens (see Figure 4-18).
Figure 4-18 Service Configuration Editor - Service Configuration

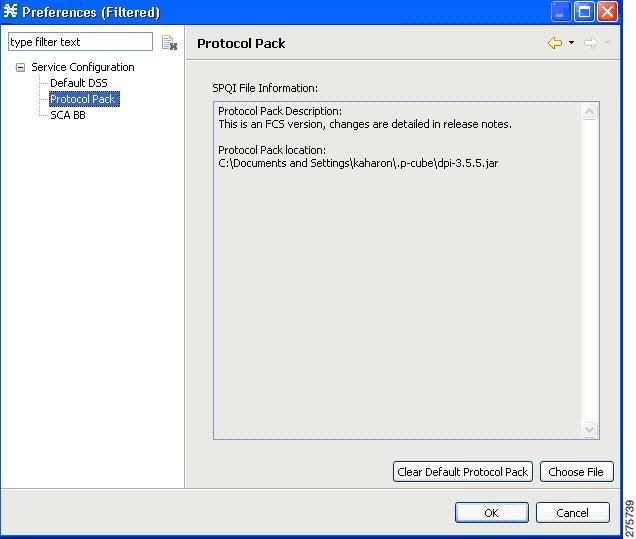
Step 4 ![]() Select Protocol Pack from the Service Configuration tree (see Figure 4-19). The upper window provides information related to service hierarchy tree related to the GUI.
Select Protocol Pack from the Service Configuration tree (see Figure 4-19). The upper window provides information related to service hierarchy tree related to the GUI.
Figure 4-19 Preferences (Filtered)

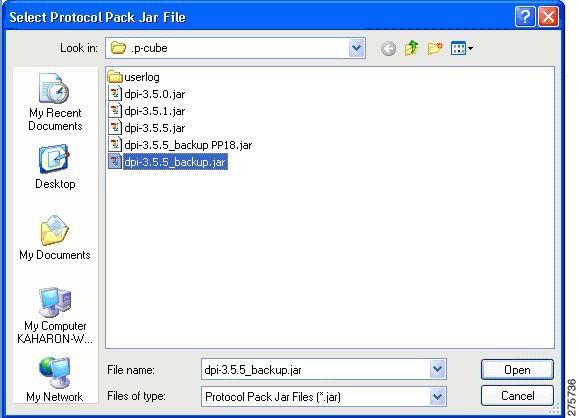
Step 5 ![]() To install a new service hierarchy tree, click the Choose File button and select either a jar file or a SPQI file (see Figure 4-20).
To install a new service hierarchy tree, click the Choose File button and select either a jar file or a SPQI file (see Figure 4-20).
Figure 4-20 Select Protocol Pack
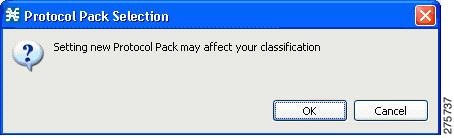
Step 6 ![]() Click Open, and approve the warning message (see Figure 4-21) by clicking OK.
Click Open, and approve the warning message (see Figure 4-21) by clicking OK.
Figure 4-21 Protocol Pack Selection Warning Message
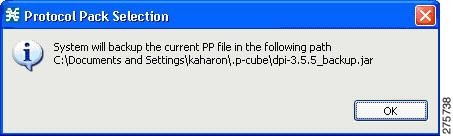
Step 7 ![]() To backup the current protocol pack and install the new service hierarchy tree, approve the backup message (see Figure 4-22) by clicking OK.
To backup the current protocol pack and install the new service hierarchy tree, approve the backup message (see Figure 4-22) by clicking OK.
Figure 4-22 Protocol Pack Selection Backup Message
Remove Service Hierarchy Tree
Step 1 ![]() To remove the service hierarchy tree and to return to the default configuration, click the Clear Default Protocol Pack button in the Preferences window (see Figure 4-23).
To remove the service hierarchy tree and to return to the default configuration, click the Clear Default Protocol Pack button in the Preferences window (see Figure 4-23).
Figure 4-23 Preferences (Filtered)
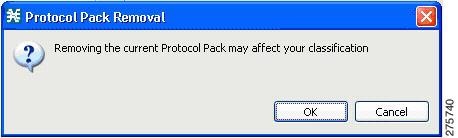
Step 2 ![]() Accept the operation by clicking OK on the Protocol Pack Removal message screen (see Figure 4-24).
Accept the operation by clicking OK on the Protocol Pack Removal message screen (see Figure 4-24).
Figure 4-24 Protocol Pack Removal Message
The service hierarchy tree is removed from the system, and when a new PQB is opened, the client installs the default service classifications.
How to Verify Version Compatibility for Protocol Packs
A protocol pack is compatible only with specific versions of the SCE application. When working with protocol packs, you should verify that the protocol pack version matches the SCE application version. For example, only use a protocol pack for 3.6.0 on SCE application version 3.6.0.
The version compatibility information for each protocol pack is included in the protocol pack's release notes.
Step 1 ![]() Verify that the correct version of servconf is installed and running correctly.
Verify that the correct version of servconf is installed and running correctly.
•![]() From the command prompt, type
From the command prompt, type servconf --version.
•![]() Press Enter.
Press Enter.
The version of the utility should match that of the protocol pack.
Step 2 ![]() Verify that the correct version of the SCE application is installed.
Verify that the correct version of the SCE application is installed.
•![]() At the SCE platform CLI prompt
At the SCE platform CLI prompt (SCE#), type show version.
•![]() Press Enter.
Press Enter.
The application version should match that of the protocol pack.
Step 3 ![]() Verify that a service configuration (PQB) is applied to the SCE platform.
Verify that a service configuration (PQB) is applied to the SCE platform.
•![]() In the Console, retrieve and view the current PQB.
In the Console, retrieve and view the current PQB.
How to Verify the Installation of a Protocol Pack
Step 1 ![]() At the SCE platform CLI prompt
At the SCE platform CLI prompt (SCE#), type show version.
Step 2 ![]() Press Enter.
Press Enter.
The response shows the version of the OS running on the SCE platform. This includes information about the installed protocol pack version.
Step 3 ![]() Retrieve the PQB from the SCE platform and view it using the Console.
Retrieve the PQB from the SCE platform and view it using the Console.
Step 4 ![]() Verify that the new protocols from the protocol pack were added to the service configuration.
Verify that the new protocols from the protocol pack were added to the service configuration.
The problems that may cause the installation of a protocol pack to fail and their remedies include:
•![]() Missing or incorrect version of the JRE—Install the correct version of the JRE (see Installing the Java Runtime Environment).
Missing or incorrect version of the JRE—Install the correct version of the JRE (see Installing the Java Runtime Environment).
•![]() Incorrect or missing SCE application version on the SCE platform—Verify that the correct version of the SCE application is installed (see How to Verify Version Compatibility for Protocol Packs).
Incorrect or missing SCE application version on the SCE platform—Verify that the correct version of the SCE application is installed (see How to Verify Version Compatibility for Protocol Packs).
•![]() No service configuration (PQB) is applied to the SCE platform—Create a new PQB and apply it using the Console.
No service configuration (PQB) is applied to the SCE platform—Create a new PQB and apply it using the Console.
•![]() servconf failed to import the new signatures into the PQB—Use the
servconf failed to import the new signatures into the PQB—Use the --force-signature update signature option when running servconf (see servconf Syntax).
When reporting problems to Cisco, please include the servconf log file, located at <user.home>\.p-cube\servconf.log. With Windows, this usually maps to C:\Documents and Settings\<username>\.p-cube\servconf.log or C:\Users\<username>\.p-cube\servconf.log.
Hitless Upgrade of the SLI
Hitless upgrade is the SCA BB method of upgrading the software components that reside on the SCE platform without incurring any service downtime.
•![]() Hitless upgrade is available on SCE 2000 and SCE 1000_2U platforms.
Hitless upgrade is available on SCE 2000 and SCE 1000_2U platforms.
•![]() Hitless upgrade is not available on SCE 1000_1.5U platforms.
Hitless upgrade is not available on SCE 1000_1.5U platforms.
If hitless upgrade is enabled, classification, reporting, and control continue uninterrupted when you install an SPQI file (see Working with Protocol Packs). You can install SPQI files using either the Console or servconf, the SCA BB Service Configuration Utility. An SPQI file is a package that includes the required (SLI) files.
Note ![]() When you apply a new policy or during Protocol Pack upgrade, there is a delay of 30 seconds before the rules are applied to the new flows.
When you apply a new policy or during Protocol Pack upgrade, there is a delay of 30 seconds before the rules are applied to the new flows.
After the new application is loaded on the SCE platform:
•![]() The new application services all new flows and bundles.
The new application services all new flows and bundles.
•![]() The old application continues to service existing flows (and new flows that belong to bundles of existing flows).
The old application continues to service existing flows (and new flows that belong to bundles of existing flows).
•![]() Both applications share available memory.
Both applications share available memory.
Until all old flows die or are killed, the hitless upgrade is considered to be in progress. To make the hitless upgrade process bounded, you can set criteria that triggers the explicit killing of all flows still executing on the old application. Two such criteria exist:
•![]() When a specified amount of time has passed since the process started.
When a specified amount of time has passed since the process started.
•![]() When the number of old flows goes below a specified threshold.
When the number of old flows goes below a specified threshold.
The default value for the first criterion is 60 (minutes); the default value for the second is zero (flows). This means that the replace operation is guaranteed to complete after no more than one hour (sooner, if all old flows die naturally), but no old flows are killed by the application before one hour passes.
These criteria are configurable by CLI commands.
You can initiate the explicit killing of all old flows using a manual command.
Hitless Upgrade CLI Commands
You can configure, monitor, and control hitless upgrade using the SCE platform Command-Line Interface (CLI). For more information about the SCE platform CLI, see Cisco SCE8000 CLI Command Reference.
The commands listed here are explained in the following section.
Use the following CLI commands to configure the criteria for completing a hitless upgrade:
replace completion time <minutes>
no replace completion time
default replace completion time
replace completion num-flows <num>
no replace completion num-flows
default replace completion num-flows
These commands are line interface configuration commands. To run these commands you must enter line interface configuration mode (see How to Enter Line Interface Configuration Mode) and see the SCE(config if)# prompt displayed.
The following two CLI commands are EXEC mode commands.
Use the following CLI command to monitor the progress of a hitless upgrade:
show applications slot <num> replace
Use the following CLI command to force immediate completion of a hitless upgrade:
application slot <num> replace force completion
Description of Hitless Upgrade CLI Commands
Table 4-1 describes the hitless upgrade CLI commands listed in the previous section.
How to Enter Line Interface Configuration Mode
To run line interface configuration commands, you must enter line interface configuration mode and see the SCE(config if)# prompt displayed.
Step 1 ![]() At the SCE platform CLI prompt
At the SCE platform CLI prompt (SCE#, type configure.
Step 2 ![]() Press Enter.
Press Enter.
The SCE(config)# prompt appears.
Step 3 ![]() Type interface LineCard 0.
Type interface LineCard 0.
Step 4 ![]() Press Enter.
Press Enter.
The SCE(config if)# prompt appears.
How to Launch the Console
Step 1 ![]() Choose Start > All Programs > Cisco SCA > SCA BB Console 3.6.5 > SCA BB Console 3.6.5.
Choose Start > All Programs > Cisco SCA > SCA BB Console 3.6.5 > SCA BB Console 3.6.5.
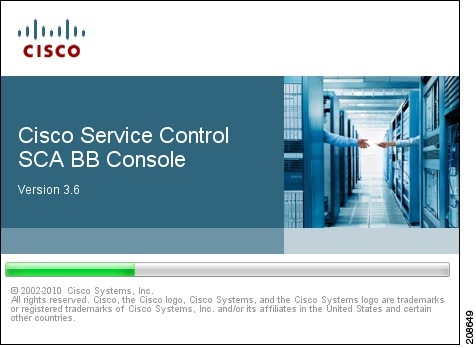
The Cisco Service Control SCA BB Console splash screen appears (see Figure 4-25).
Figure 4-25 Cisco Service Control SCA BB Console
After the Console has loaded, the main window of the Console appears.
The first time that you launch the Console, the Welcome view is open in the main window (see Figure 4-26).
Figure 4-26 Welcome - Introducing Cisco Service Control
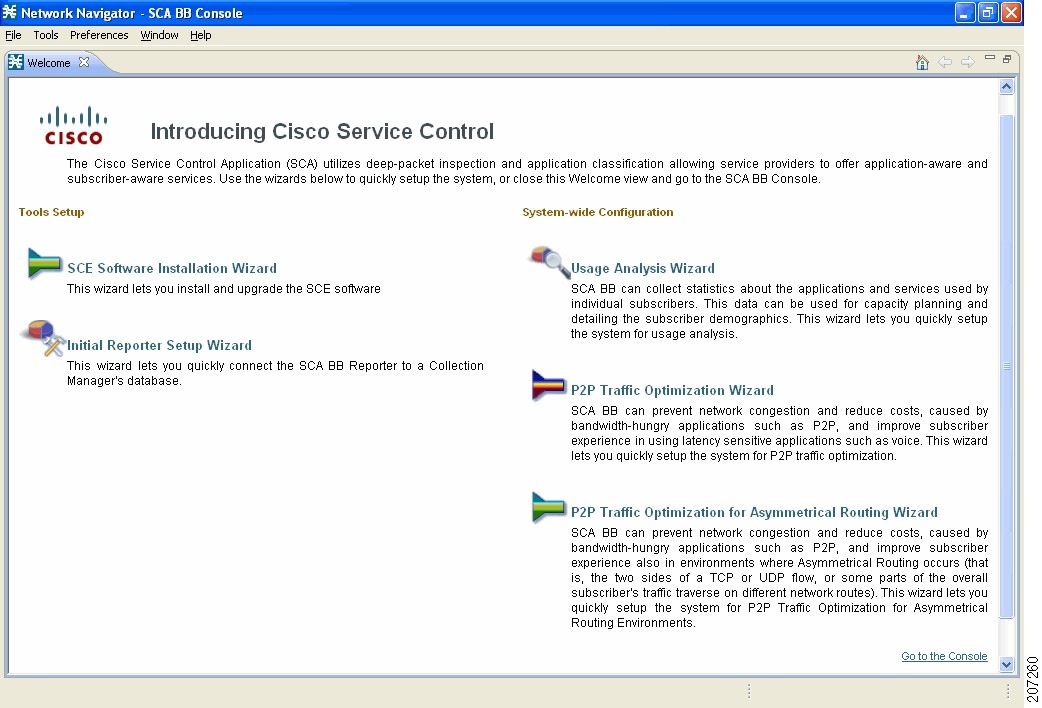
Step 2 ![]() Close the Welcome view and click Go to the console.
Close the Welcome view and click Go to the console.
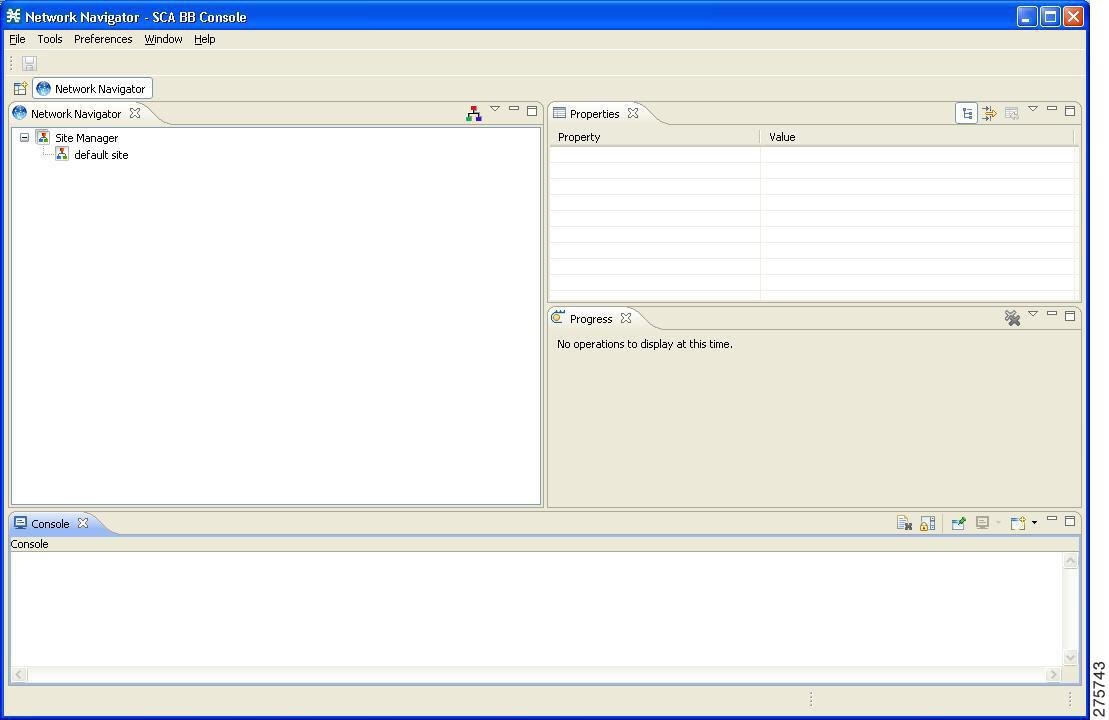
The Welcome view closes. The Network Navigator tool is open in the Console (see Figure 4-27).
Figure 4-27 Network Navigator
Note ![]() When you close the Console, it remembers which tools are open, which is the active tool, and whether the Welcome view is displayed, and applies this the next time you launch the Console.
When you close the Console, it remembers which tools are open, which is the active tool, and whether the Welcome view is displayed, and applies this the next time you launch the Console.
How to Use the Console
The Console is the front end of SCA BB. You use it to configure the services that the SP offers to you.
The Console consists of the following tools:
•![]() Network Navigator tool
Network Navigator tool
•![]() Service Configuration Editor tool
Service Configuration Editor tool
•![]() Signature Editor tool
Signature Editor tool
•![]() Subscriber Manager GUI tool
Subscriber Manager GUI tool
•![]() Reporter tool
Reporter tool
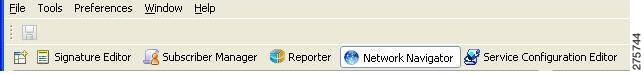
The Console GUI has a menu bar and a standard toolbar (see Figure 4-28). Underneath the toolbar is another bar that displays the button of any open Console tool. When you launch a tool, a button is added to this bar. To switch between open tools, click the appropriate button on the bar.
Figure 4-28 Menu Bar and Toolbar of the Console GUI
Note ![]() The title of the Console window shows the active tool and the active service configuration.
The title of the Console window shows the active tool and the active service configuration.
The Welcome View of the Console links to a number of Configuration Wizards that can configure the initial, basic configuration of your system.
•![]() The Service Configuration Editor Tool
The Service Configuration Editor Tool
•![]() The Subscriber Manager GUI Tool
The Subscriber Manager GUI Tool
Configuration Wizards
The configuration wizards available from the Welcome view are (three of these wizards can also be executed from the Network Navigator tool):
•![]() Usage Analysis wizard—Creates a simple model of devices and connects to them.
Usage Analysis wizard—Creates a simple model of devices and connects to them.
•![]() The P2P Traffic Optimization wizards:
The P2P Traffic Optimization wizards:
–![]() P2P Traffic Optimization wizard—Creates a simple model of devices, connects to them, and limits P2P traffic to a specified percentage of total available bandwidth.
P2P Traffic Optimization wizard—Creates a simple model of devices, connects to them, and limits P2P traffic to a specified percentage of total available bandwidth.
–![]() P2P Traffic Optimization at a Peering Point wizard—Creates a simple model of devices, connects to them, limits P2P traffic to a specified percentage of total available bandwidth, and allows you to enable asymmetric routing classification mode.
P2P Traffic Optimization at a Peering Point wizard—Creates a simple model of devices, connects to them, limits P2P traffic to a specified percentage of total available bandwidth, and allows you to enable asymmetric routing classification mode.
•![]() Reporter DB Configuration wizard—Connects the SCA BB Reporter tool to a database.
Reporter DB Configuration wizard—Connects the SCA BB Reporter tool to a database.
Asymmetric Routing
Traffic processing depends on the routing environment. The Cisco Service Control solution can operate in two typical routing schemes: symmetric and asymmetric. In asymmetric routing, for a significant number of flows, only one direction (inbound or outbound) is routed through the SCE platform.
Anonymous Subscriber Mode
Anonymous subscriber mode is a mode in which entities defined as IP addresses are treated as subscribers.
How to Use the Usage Analysis Wizard
The Usage Analysis wizard allows you to create a simple model of devices and connect to them.
Note ![]() If they do not already exist, devices defined in the wizard are added to the default site in the Site Manager tree.
If they do not already exist, devices defined in the wizard are added to the default site in the Site Manager tree.
Step 1 ![]() From the Console main menu, choose Help > Welcome.
From the Console main menu, choose Help > Welcome.
The Welcome view opens (see Figure 4-29).
Figure 4-29 Welcome - Introducing Cisco Service Control
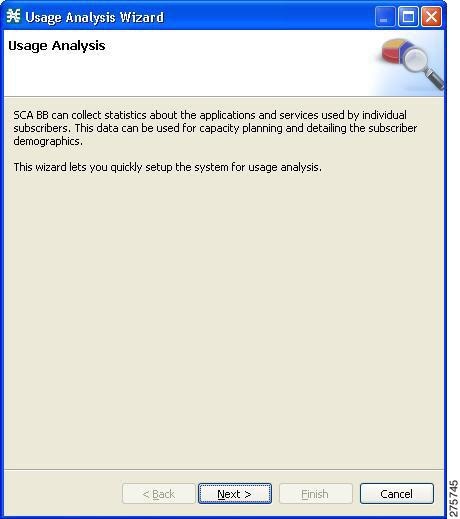
Step 2 ![]() Click Usage Analysis Wizard.
Click Usage Analysis Wizard.
The Welcome page of the Usage Analysis wizard appears (see Figure 4-30).
Figure 4-30 Usage Analysis
Note ![]() You can also execute the Usage Analysis wizard from the Network Navigator tool:
You can also execute the Usage Analysis wizard from the Network Navigator tool:
1. ![]() Select one or more devices in the Site Manager tree.
Select one or more devices in the Site Manager tree.
2. ![]() Right-click one of the selected devices.
Right-click one of the selected devices.
3. ![]() From the popup menu that appears, select Configuration Wizards > Usage Analysis Configuration.
From the popup menu that appears, select Configuration Wizards > Usage Analysis Configuration.
4. ![]() You can set only one CM and one Reporter database in the wizard. If you select more than one CM or Reporter database, only one CM and one Reporter database is selected and a warning message is displayed. Click OK to continue.
You can set only one CM and one Reporter database in the wizard. If you select more than one CM or Reporter database, only one CM and one Reporter database is selected and a warning message is displayed. Click OK to continue.
Step 3 ![]() Click Next.
Click Next.
The SCE IP Addresses page of the Usage Analysis wizard opens (see Figure 4-31).
Figure 4-31 SCE IP Addresses

Step 4 ![]() In the edit box, enter the IP addresses of the SCE devices that should be added to the model.
In the edit box, enter the IP addresses of the SCE devices that should be added to the model.
If you started from the Network Navigator, the IP addresses of the SCE devices that you selected are displayed in the edit box. You can add additional addresses.
Note ![]() You can work with up to 20 SCE devices at one time using the wizard.
You can work with up to 20 SCE devices at one time using the wizard.
Step 5 ![]() Click Next.
Click Next.
The SCE Usernames and Passwords page of the Usage Analysis wizard opens (see Figure 4-32).
Figure 4-32 SCE Usernames and Passwords
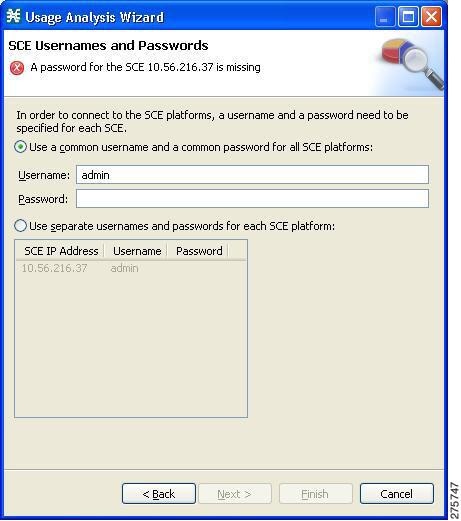
Step 6 ![]() Enter the usernames and passwords for the SCE devices.
Enter the usernames and passwords for the SCE devices.
Do one of the following:
•![]() To use the same username and password for all the SCE devices that you are adding, enter the username in the Username field and the password in the Password field.
To use the same username and password for all the SCE devices that you are adding, enter the username in the Username field and the password in the Password field.
•![]() To provide a different username and password pair for each SCE device, select the Use separate usernames and passwords for each SCE platform radio button, and, for each SCE device, enter the username and password in the appropriate cell of the table.
To provide a different username and password pair for each SCE device, select the Use separate usernames and passwords for each SCE platform radio button, and, for each SCE device, enter the username and password in the appropriate cell of the table.
Step 7 ![]() Click Next.
Click Next.
The CM Setup page of the Usage Analysis wizard opens (see Figure 4-33).
Figure 4-33 CM Setup
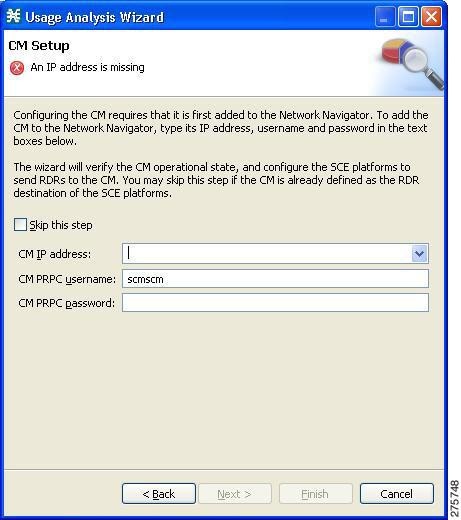
Step 8 ![]() Define the SCSM Collection Manager (CM) to use with this configuration.
Define the SCSM Collection Manager (CM) to use with this configuration.
Do one of the following:
•![]() Enter the IP address, username, and password of the CM device in the appropriate fields.
Enter the IP address, username, and password of the CM device in the appropriate fields.
If you started from the Network Navigator, this information is retrieved and displayed. You can modify these parameters.
•![]() Check the Skip this step check box.
Check the Skip this step check box.
Step 9 ![]() Click Next.
Click Next.
The Reporter Setup page of the Usage Analysis wizard opens (see Figure 4-34).
Figure 4-34 Reporter Setup
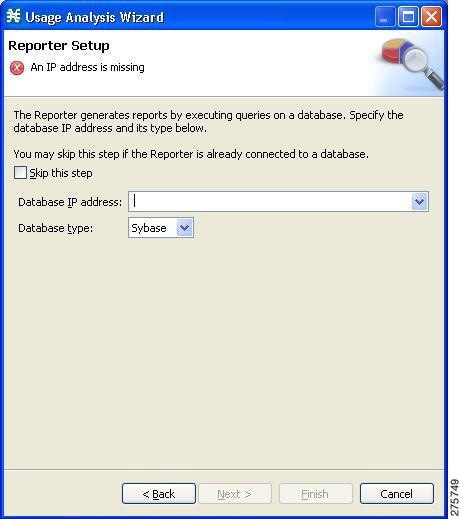
Step 10 ![]() Define the database to which the Reporter tool should connect.
Define the database to which the Reporter tool should connect.
Do one of the following:
•![]() Enter the IP address of the database and select the database type.
Enter the IP address of the database and select the database type.
If you started from the Network Navigator, this information is retrieved and displayed. You can modify these parameters.
•![]() Check the Skip this step check box.
Check the Skip this step check box.
Step 11 ![]() Click Next.
Click Next.
The Connectivity Test page of the Usage Analysis wizard opens (see Figure 4-35).
Figure 4-35 Connectivity Test
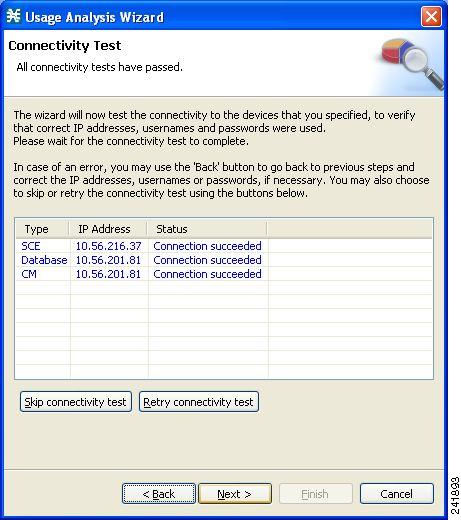
The wizard tests to see that the connections to the defined devices can be made.
Note ![]() If a connection to one or more of the devices cannot be made or if there is some problem with the connection (such as invalid version of the device) an error is displayed next to the device. You can skip these tests by clicking Skip connectivity test. The connections are validated when you click Finish at the end of the wizard.
If a connection to one or more of the devices cannot be made or if there is some problem with the connection (such as invalid version of the device) an error is displayed next to the device. You can skip these tests by clicking Skip connectivity test. The connections are validated when you click Finish at the end of the wizard.
Step 12 ![]() Click Next.
Click Next.
The Anonymous Subscribers page of the Usage Analysis wizard opens (see Figure 4-36).
Figure 4-36 Anonymous Subscribers
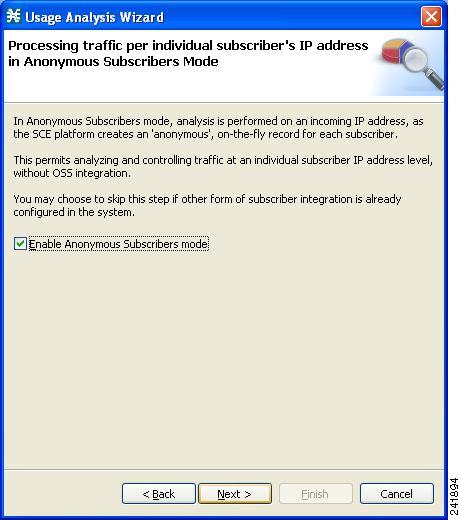
Step 13 ![]() To disable anonymous subscriber mode, clear the Enable Anonymous Subscribers mode check box.
To disable anonymous subscriber mode, clear the Enable Anonymous Subscribers mode check box.
Step 14 ![]() Click Next.
Click Next.
The Confirmation page of the Usage Analysis wizard opens (see Figure 4-37).
Figure 4-37 Confirmation
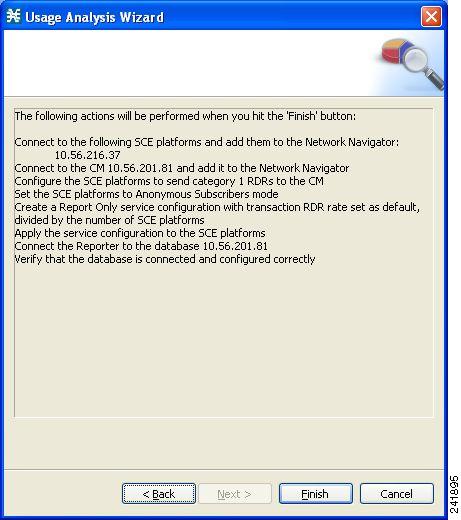
The actions that the wizard is about to take are listed on the page.
Step 15 ![]() Click Finish.
Click Finish.
The Configuration Output page of the Usage Analysis wizard opens (see Figure 4-38).
Figure 4-38 Configuration Output

New devices are added to the default site of the Site Manager tree in the Network Navigator (see Figure 4-39).
Figure 4-39 Site Manager Tree
The wizard attempts to connect to all devices that you defined. The operation fails if:
•![]() The wizard cannot connect to any of the SCE devices that you listed in Step 4.
The wizard cannot connect to any of the SCE devices that you listed in Step 4.
•![]() You defined a CM in Step 8, but the wizard cannot connect to it.
You defined a CM in Step 8, but the wizard cannot connect to it.
•![]() You defined a database in Step 10, but the wizard cannot connect to it.
You defined a database in Step 10, but the wizard cannot connect to it.
If you defined a CM in Step 8, the SCE devices are configured so that the only category 1 RDR destination is the CM.
Note ![]() RDR categories are the mechanism by which different types of RDRs can be sent to different collectors. For more information about RDR categories, see either the "Raw Data Formatting: The RDR Formatter and NetFlow Exporting" chapter of Cisco SCE8000 10GBE Software Configuration Guide or the "Raw Data Formatting: The RDR Formatter and NetFlow Exporting" chapter of Cisco SCE8000 GBE Software Configuration Guide.
RDR categories are the mechanism by which different types of RDRs can be sent to different collectors. For more information about RDR categories, see either the "Raw Data Formatting: The RDR Formatter and NetFlow Exporting" chapter of Cisco SCE8000 10GBE Software Configuration Guide or the "Raw Data Formatting: The RDR Formatter and NetFlow Exporting" chapter of Cisco SCE8000 GBE Software Configuration Guide.
A new service configuration named Usage Analysis is created, and opens in the Service Configuration Editor (see Figure 4-40).
Figure 4-40 Service Configuration Editor
The service configuration has the following characteristics:
•![]() Report Only mode.
Report Only mode.
•![]() The maximum Transaction RDR rate is set as the default value (250) divided by the number of SCE devices. (To configure the Transaction RDR see How to Manage Transaction RDRs; the content and structure of the Transaction RDR is listed in "Transaction RDR" in the "Raw Data Records: Formats and Field Contents" chapter of Cisco Service Control Application for Broadband Reference Guide.)
The maximum Transaction RDR rate is set as the default value (250) divided by the number of SCE devices. (To configure the Transaction RDR see How to Manage Transaction RDRs; the content and structure of the Transaction RDR is listed in "Transaction RDR" in the "Raw Data Records: Formats and Field Contents" chapter of Cisco Service Control Application for Broadband Reference Guide.)
The service configuration is applied to the SCE devices.
If you defined a database in Step 10:
•![]() The SCA BB Reporter tool is connected to the selected database.
The SCA BB Reporter tool is connected to the selected database.
•![]() The first SCE platform entered in Step 4 is selected as the source of service configuration data.
The first SCE platform entered in Step 4 is selected as the source of service configuration data.
•![]() The Next button is enabled.
The Next button is enabled.
Step 16 ![]() If you did not define a database in Step 10, click Close.
If you did not define a database in Step 10, click Close.
The Usage Analysis wizard closes.
Step 17 ![]() Click Next.
Click Next.
The Create common reports page of the Usage Analysis wizard opens (see Figure 4-41).
Figure 4-41 Create Common Reports
Step 18 ![]() To create reports, check the Create and display common reports check box.
To create reports, check the Create and display common reports check box.
Note ![]() Report instances are created for four predefined report types:
Report instances are created for four predefined report types:
•![]() Global Bandwidth per Service
Global Bandwidth per Service
•![]() Global Active Subscribers per Service
Global Active Subscribers per Service
•![]() Top P2P Protocols
Top P2P Protocols
•![]() Global Hourly Call Minutes per Service (VoIP)
Global Hourly Call Minutes per Service (VoIP)
Step 19 ![]() Click Close.
Click Close.
The wizard closes.
The Reporter tool opens in the Console.
Report instances of each of the four report types open in the Report View of the Reporter tool.
How to Use the P2P Traffic Optimization Wizards
There are two wizards for optimizing P2P traffic:
•![]() The P2P Traffic Optimization wizard allows you to create a simple model of devices, connect to them, and limit P2P traffic to a specified percentage of total available bandwidth.
The P2P Traffic Optimization wizard allows you to create a simple model of devices, connect to them, and limit P2P traffic to a specified percentage of total available bandwidth.
•![]() The P2P Traffic Optimization at a Peering Point wizard allows you to create a simple model of devices, connect to them, limit P2P traffic to a specified percentage of total available bandwidth, and enable asymmetric routing classification mode.
The P2P Traffic Optimization at a Peering Point wizard allows you to create a simple model of devices, connect to them, limit P2P traffic to a specified percentage of total available bandwidth, and enable asymmetric routing classification mode.
Note ![]() If they do not already exist, devices defined in the wizard are added to the default site in the Site Manager tree.
If they do not already exist, devices defined in the wizard are added to the default site in the Site Manager tree.
Step 1 ![]() From the Console main menu, choose Help > Welcome.
From the Console main menu, choose Help > Welcome.
The Welcome view opens (see Figure 4-42).
Figure 4-42 Welcome - Introducing Cisco Service Control
Step 2 ![]() Click P2P Traffic Optimization Wizard or P2P Traffic Optimization for Asymmetrical Routing Wizard.
Click P2P Traffic Optimization Wizard or P2P Traffic Optimization for Asymmetrical Routing Wizard.
The Welcome page of the selected wizard appears (see Figure 4-43 or Figure 4-44).
Figure 4-43 P2P Traffic Optimization
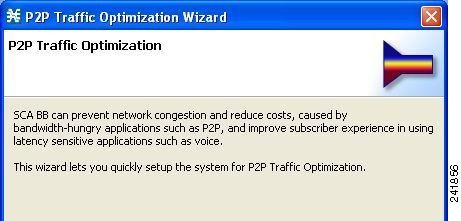
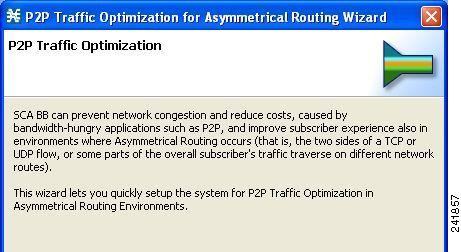
Figure 4-44 P2P Traffic Optimization for Asymmetrical Routing
Note ![]() You can also execute the P2P Traffic Optimization wizard from the Network Navigator tool.
You can also execute the P2P Traffic Optimization wizard from the Network Navigator tool.
1. ![]() Select one or more devices in the Site Manager tree.
Select one or more devices in the Site Manager tree.
2. ![]() Right-click one of the selected devices.
Right-click one of the selected devices.
3. ![]() From the popup menu that appears, choose Configuration Wizards > P2P Traffic Optimization Wizard or Configuration Wizards > P2P Traffic Optimization for Asymmetrical Routing Wizard.
From the popup menu that appears, choose Configuration Wizards > P2P Traffic Optimization Wizard or Configuration Wizards > P2P Traffic Optimization for Asymmetrical Routing Wizard.
Note ![]() You can set only one CM and one Reporter database in the wizard. If you select more than one CM or Reporter database, only one CM and one Reporter database is selected and a warning message is displayed. Click OK to continue.
You can set only one CM and one Reporter database in the wizard. If you select more than one CM or Reporter database, only one CM and one Reporter database is selected and a warning message is displayed. Click OK to continue.
Step 3 ![]() Click Next.
Click Next.
The SCE IP Addresses page of the P2P Traffic Optimization wizard opens (see Figure 4-45).
Figure 4-45 SCE IP Addresses
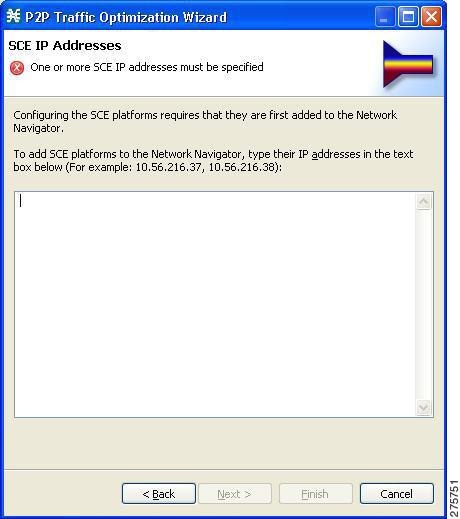
Step 4 ![]() In the edit box, enter the IP addresses of the SCE devices that should be added to the model.
In the edit box, enter the IP addresses of the SCE devices that should be added to the model.
If you started from the Network Navigator, the IP addresses of the SCE devices that you selected are displayed in the edit box. You can add additional addresses.
Note ![]() You can work with up to 20 SCE devices at one time using the wizard.
You can work with up to 20 SCE devices at one time using the wizard.
Step 5 ![]() Click Next.
Click Next.
The SCE Usernames and Passwords page of the P2P Traffic Optimization wizard opens (see Figure 4-46).
Figure 4-46 SCE Usernames and Passwords
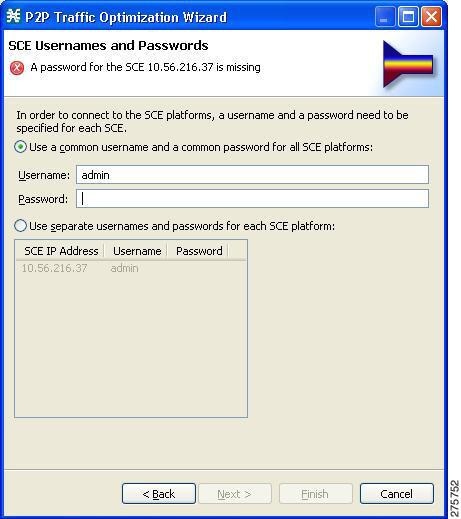
Step 6 ![]() Enter the usernames and passwords for the SCE devices.
Enter the usernames and passwords for the SCE devices.
Do one of the following:
•![]() To use the same username and password for all the SCE devices that you are adding, enter the username in the Username field and the password in the Password field.
To use the same username and password for all the SCE devices that you are adding, enter the username in the Username field and the password in the Password field.
•![]() To provide a different username and password pair for each SCE device, click the Use separate usernames and passwords for each SCE platform radio button, and, for each SCE device, enter the username and password in the appropriate cell of the SCE device table.
To provide a different username and password pair for each SCE device, click the Use separate usernames and passwords for each SCE platform radio button, and, for each SCE device, enter the username and password in the appropriate cell of the SCE device table.
Step 7 ![]() Click Next.
Click Next.
The CM Setup page of the P2P Traffic Optimization wizard opens (see Figure 4-47).
Figure 4-47 CM Setup
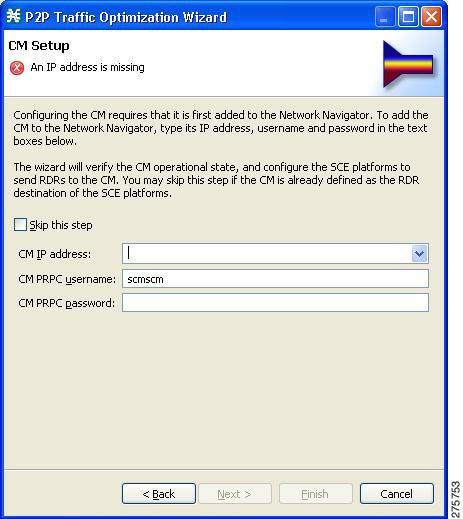
Step 8 ![]() Define the SCSM Collection Manager (CM) to use with this configuration.
Define the SCSM Collection Manager (CM) to use with this configuration.
Do one of the following:
•![]() Enter the IP address, username, and password of the CM device in the appropriate fields.
Enter the IP address, username, and password of the CM device in the appropriate fields.
If you started from the Network Navigator, this information is retrieved and displayed. You can modify these parameters.
•![]() Check the Skip this step check box.
Check the Skip this step check box.
Step 9 ![]() Click Next.
Click Next.
The Reporter Setup page of the P2P Traffic Optimization wizard opens (see Figure 4-48).
Figure 4-48 Reporter Setup

Step 10 ![]() Define the database to which the Reporter tool should connect.
Define the database to which the Reporter tool should connect.
Do one of the following:
•![]() Enter the IP address of the database and select the database type.
Enter the IP address of the database and select the database type.
If you started from the Network Navigator, this information is retrieved and displayed. You can modify these parameters.
•![]() Check the Skip this step check box.
Check the Skip this step check box.
Step 11 ![]() Click Next.
Click Next.
The Connectivity Test page of the P2P Traffic Optimization wizard opens (see Figure 4-49).
Figure 4-49 Connectivity Test
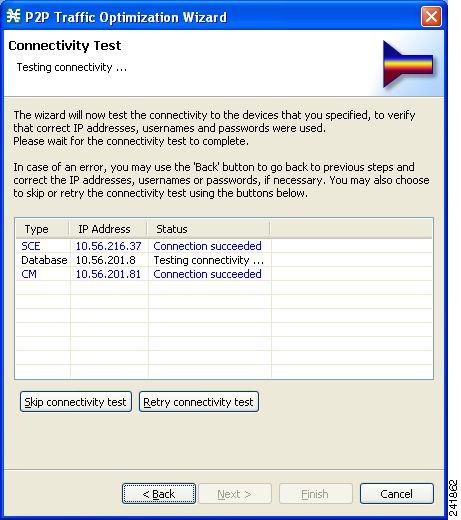
The wizard tests to see that the connections to the defined devices can be made.
Note ![]() If a connection to one or more of the devices cannot be made or if there is some problem with the connection (such as invalid version of the device) an error is displayed next to the device. You can skip these tests by clicking Skip connectivity test. The connections are validated when you click Finish at the end of the wizard.
If a connection to one or more of the devices cannot be made or if there is some problem with the connection (such as invalid version of the device) an error is displayed next to the device. You can skip these tests by clicking Skip connectivity test. The connections are validated when you click Finish at the end of the wizard.
Step 12 ![]() Click Next.
Click Next.
The Anonymous Subscribers page of the P2P Traffic Optimization wizard opens (see Figure 4-50).
Figure 4-50 Anonymous Subscribers
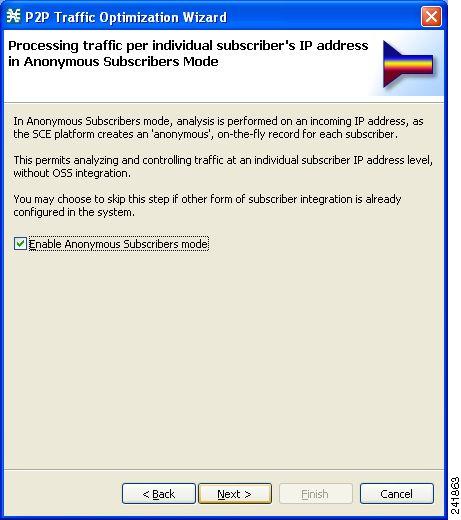
Step 13 ![]() To disable anonymous subscriber mode, uncheck the Enable Anonymous Subscribers mode check box.
To disable anonymous subscriber mode, uncheck the Enable Anonymous Subscribers mode check box.
Step 14 ![]() Click Next.
Click Next.
The effect of P2P traffic optimization page of the P2P Traffic Optimization wizard opens (see Figure 4-51).
Figure 4-51 Effect of P2P Traffic Optimization
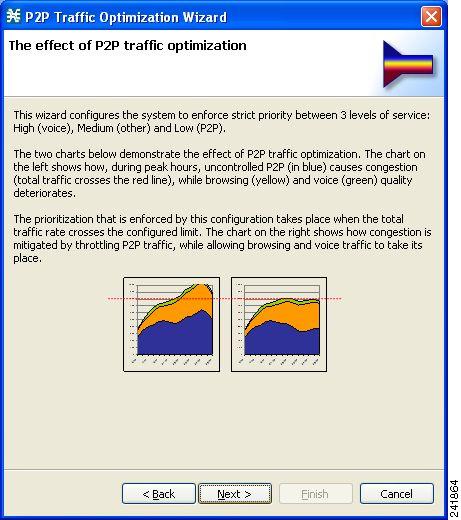
This page explains why you should optimize (limit) P2P traffic.
Step 15 ![]() Click Next.
Click Next.
The Link rate limits for P2P traffic optimization page of the P2P Traffic Optimization wizard opens (see Figure 4-52).
Figure 4-52 Link Rate Limits
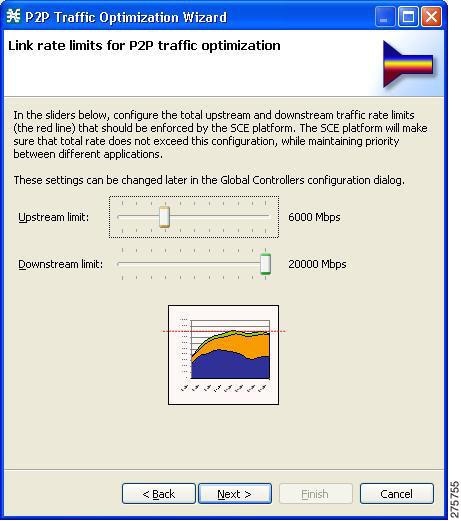
Step 16 ![]() Use the sliders to configure the upstream and downstream link rate limits.
Use the sliders to configure the upstream and downstream link rate limits.
The scale of each slider is the percentage of the aggregated bandwidth of both links.
Step 17 ![]() If you are running the P2P Traffic Optimization wizard, go to Step 20.
If you are running the P2P Traffic Optimization wizard, go to Step 20.
If you are running the P2P Traffic Optimization for Asymmetrical Routing wizard, continue at the next step.
Step 18 ![]() Click Next.
Click Next.
The Classification of split flows page of the P2P Traffic Optimization wizard opens (see Figure 4-53).
Figure 4-53 Classification of Split Flows
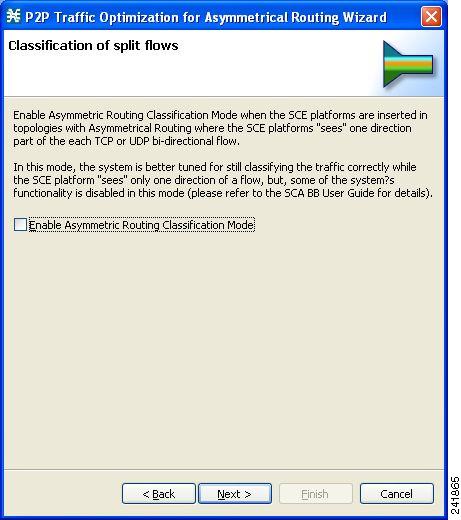
Step 19 ![]() To enable asymmetric routing classification mode, check the Enable Asymmetric Routing Classification Mode check box.
To enable asymmetric routing classification mode, check the Enable Asymmetric Routing Classification Mode check box.
Step 20 ![]() Click Next.
Click Next.
The Confirmation page of the P2P Traffic Optimization wizard opens (see Figure 4-54).
Figure 4-54 Confirmation
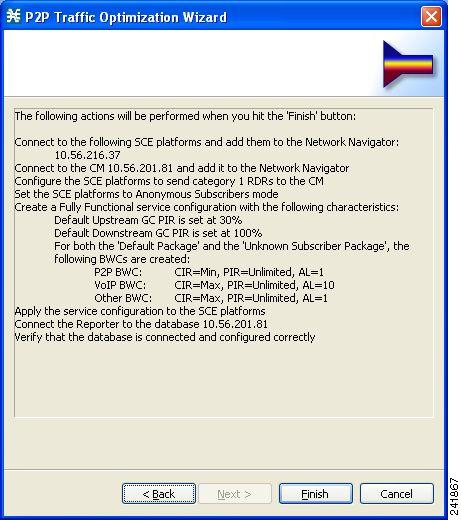
The actions that the wizard is about to take are listed on the page.
For an explanation of the bandwidth controller parameters, see Subscriber BWC Parameters.
Step 21 ![]() Click Finish.
Click Finish.
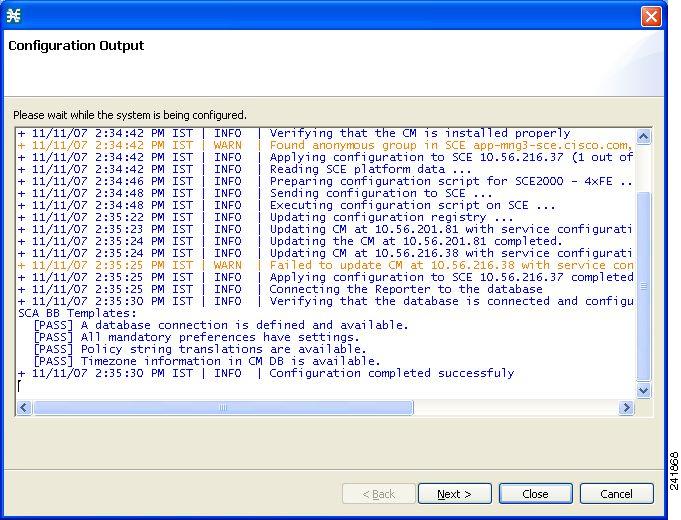
The Configuration Output page of the P2P Traffic Optimization wizard opens (see Figure 4-55).
Figure 4-55 Configuration Output
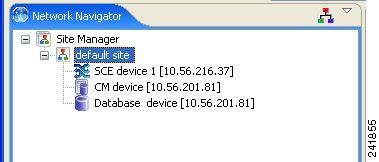
New devices are added to the default site of the Site Manager tree in the Network Navigator (see Figure 4-56).
Figure 4-56 Network Navigator
The wizard attempts to connect to all devices that you defined. The operation fails if:
•![]() The wizard cannot connect to any of the SCE devices that you listed in Step 4.
The wizard cannot connect to any of the SCE devices that you listed in Step 4.
•![]() You defined a CM in Step 8, but the wizard cannot connect to it.
You defined a CM in Step 8, but the wizard cannot connect to it.
•![]() You defined a database in Step 10, but the wizard cannot connect to it.
You defined a database in Step 10, but the wizard cannot connect to it.
If you defined a CM in Step 8, the SCE devices are configured so that the only category 1 RDR destination is the CM.
Note ![]() RDR categories are the mechanism by which different types of RDRs can be sent to different collectors. For more information about RDR categories, see "Raw Data Records: Formats and Field Contents" chapter of Cisco Service Control Application for Broadband Reference Guide.
RDR categories are the mechanism by which different types of RDRs can be sent to different collectors. For more information about RDR categories, see "Raw Data Records: Formats and Field Contents" chapter of Cisco Service Control Application for Broadband Reference Guide.
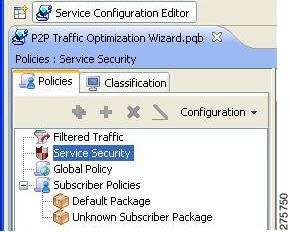
A new service configuration named P2P Traffic Optimization (or P2P Traffic Optimization for Asymmetrical Routing) is created, and opens in the Service Configuration Editor (see Figure 4-57).
Figure 4-57 Service Configuration Editor

The service configuration has the following characteristics:
•![]() Full functionality mode.
Full functionality mode.
•![]() The upstream and downstream default AGCs are set with the link limit values defined in Step 16.
The upstream and downstream default AGCs are set with the link limit values defined in Step 16.
•![]() For both the default package and the Unknown Subscriber Traffic package, the following upstream and downstream BWCs are created (Table 4-2):
For both the default package and the Unknown Subscriber Traffic package, the following upstream and downstream BWCs are created (Table 4-2):
The service configuration is applied to the SCE devices.
If you defined a database in Step 10:
1. ![]() The SCA BB Reporter tool is connected to the selected database.
The SCA BB Reporter tool is connected to the selected database.
2. ![]() The first SCE platform entered in Step 4 is selected as the source of service configuration data.
The first SCE platform entered in Step 4 is selected as the source of service configuration data.
3. ![]() The Next button is enabled.
The Next button is enabled.
Step 22 ![]() If you did not define a database in Step 10, click Finish.
If you did not define a database in Step 10, click Finish.
The P2P Traffic Optimization wizard closes.
Step 23 ![]() Click Next.
Click Next.
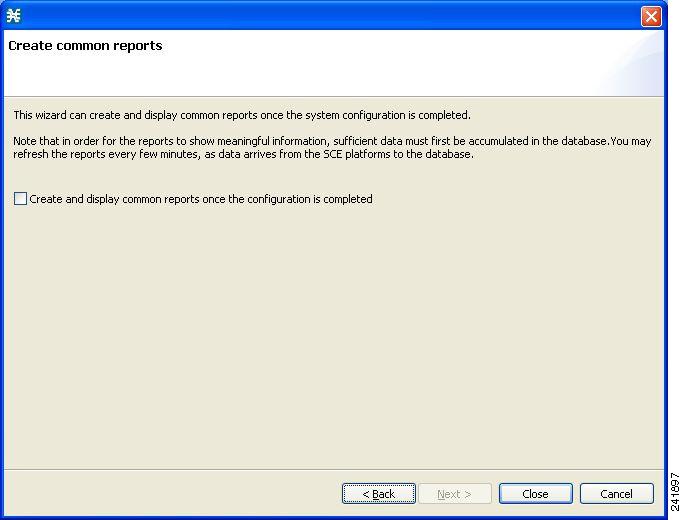
The Create common reports page of the P2P Traffic Optimization wizard opens (see Figure 4-58).
Figure 4-58 Create Common Reports
Step 24 ![]() To create reports, check the Create and display common reports check box.
To create reports, check the Create and display common reports check box.
Note ![]() Report instances are created for four predefined report types:
Report instances are created for four predefined report types:
•![]() Global Bandwidth per Service
Global Bandwidth per Service
•![]() Global Active Subscribers per Service
Global Active Subscribers per Service
•![]() Top P2P Protocols
Top P2P Protocols
•![]() Global Hourly Call Minutes per Service (VoIP)
Global Hourly Call Minutes per Service (VoIP)
Step 25 ![]() Click Close.
Click Close.
The wizard closes.
The Reporter tool opens in the Console.
Report instances of each of the four report types open in the Report View of the Reporter tool.
How to Use the Reporter DB Configuration Wizard
The Reporter DB Configuration wizard allows you to connect the Reporter to a database.

Step 1 ![]() From the Console main menu, choose Help > Welcome.
From the Console main menu, choose Help > Welcome.
The Welcome view opens (see Figure 4-59).
Figure 4-59 Welcome - Introducing Cisco Service Control
Step 2 ![]() Click Initial Reporter Setup Wizard.
Click Initial Reporter Setup Wizard.
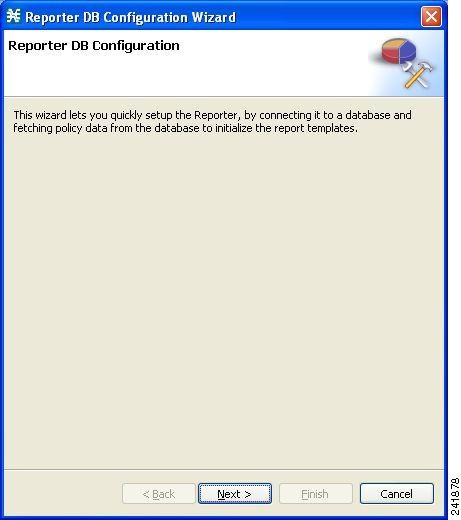
The Welcome page of the Reporter DB Configuration wizard appears (see Figure 4-60).
Figure 4-60 Reporter DB Configuration
Step 3 ![]() Click Next.
Click Next.
The Reporter Setup page of the Reporter DB Configuration wizard opens (see Figure 4-61).
Figure 4-61 Reporter Setup
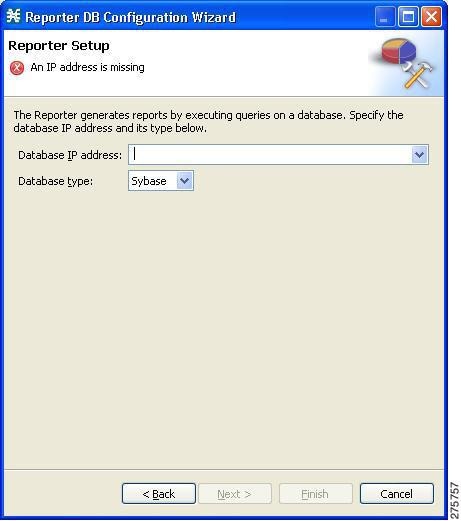
Step 4 ![]() In the Configure the IP address of the database field, enter the IP address of the database.
In the Configure the IP address of the database field, enter the IP address of the database.
Step 5 ![]() From the Select the correct database type drop-down list, select the type of the database.
From the Select the correct database type drop-down list, select the type of the database.
Step 6 ![]() Click Next.
Click Next.
The Connectivity Test window of the Reporter DB Configuration wizard opens (see Figure 4-62).
Figure 4-62 Connectivity Test
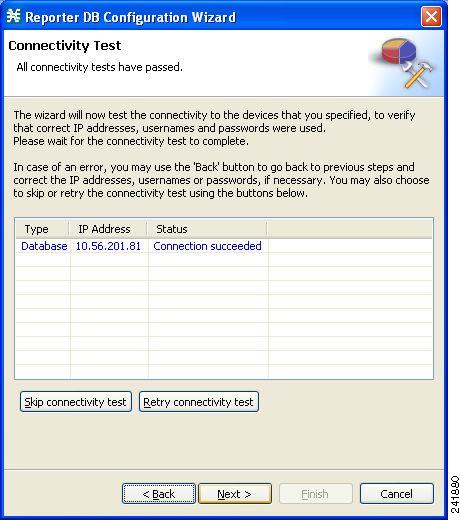
Step 7 ![]() Click Next.
Click Next.
The Confirmation window of the Reporter DB Configuration wizard opens (see Figure 4-63).
Figure 4-63 Confirmation
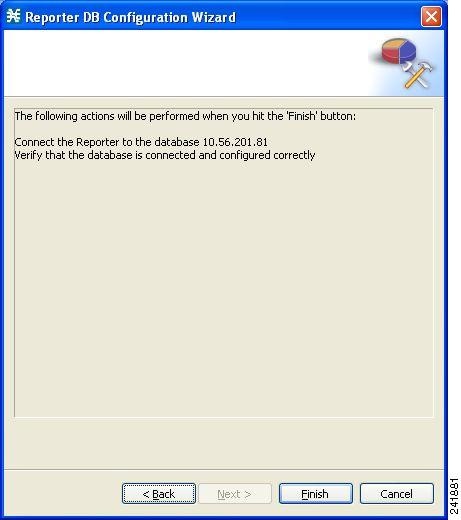
The actions that the wizard is about to take are listed on the page.
Step 8 ![]() Click Finish.
Click Finish.
The Configuration Output page of the Reporter DB Configuration wizard opens (see Figure 4-64).
Figure 4-64 Configuration Output
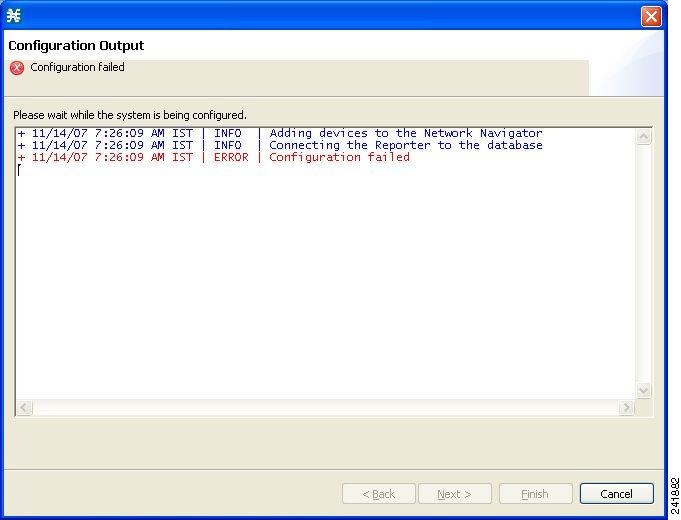
The wizard attempts to connect the SCA BB Reporter tool to the selected database. The operation fails if the wizard cannot connect to the database.
The database is queried for its service configuration data and the first SCE device in the response is chosen as the source of service configuration data.
The database device is added to the Site Manager tree in the Network Navigator.
Step 9 ![]() Click Next.
Click Next.
The Create common reports page of the Reporter DB Configuration wizard opens (see Figure 4-65).
Figure 4-65 Create Common Reports
Step 10 ![]() To create reports, check the Create and display common reports check box.
To create reports, check the Create and display common reports check box.
Note ![]() Report instances are created for four predefined report types:
Report instances are created for four predefined report types:
•![]() Global Bandwidth per Service
Global Bandwidth per Service
•![]() Global Active Subscribers per Service
Global Active Subscribers per Service
•![]() Top P2P Protocols
Top P2P Protocols
•![]() Global Hourly Call Minutes per Service (VoIP)
Global Hourly Call Minutes per Service (VoIP)
Step 11 ![]() Click Close.
Click Close.
The wizard closes.
The Reporter tool opens in the Console.
Report instances of each of the four report types open in the Report View of the Reporter tool.
The Network Navigator Tool
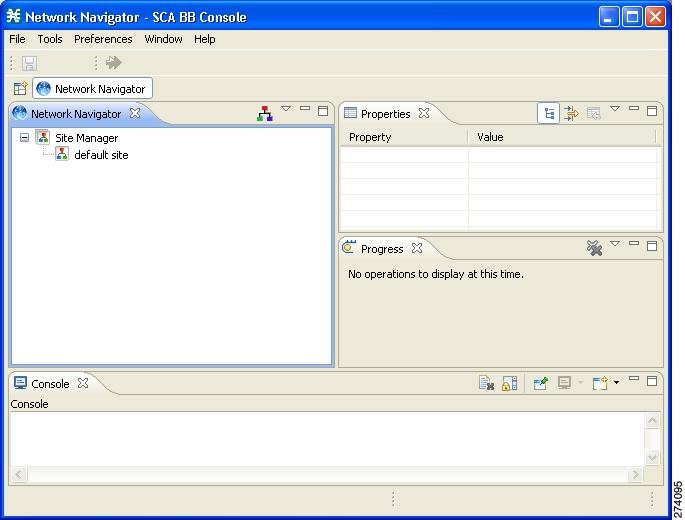
The Network Navigator is a tool that allows you to create and manage a simple model of all local and remote devices that are part of the Cisco Service Control solution.
For more information about the Network Navigator, see Using the Network Navigator.
How to Open the Network Navigator Tool
Step 1 ![]() From the Console main menu, choose Tools > Network Navigator.
From the Console main menu, choose Tools > Network Navigator.
The Network Navigator tool opens (see Figure 4-66).
Figure 4-66 Network Navigator
How to Close the Network Navigator Tool
Step 1 ![]() Right-click the Network Navigator button.
Right-click the Network Navigator button.
Step 2 ![]() From the popup menu that appears, select Close.
From the popup menu that appears, select Close.
The Network Navigator tool closes.
The Service Configuration Editor Tool
The Service Configuration Editor is a tool that allows you to create service configurations. A service configuration is a data structure that defines how the SCE platform analyses network traffic, what rules apply to the traffic, and what actions the SCE platform takes to enforce these rules.
Most of this document discusses using the Service Configuration Editor. See Using the Service Configuration Editor.
•![]() How to Open the Service Configuration Editor Tool
How to Open the Service Configuration Editor Tool
•![]() How to Close the Service Configuration Editor Tool
How to Close the Service Configuration Editor Tool
How to Open the Service Configuration Editor Tool
Step 1 ![]() From the Console main menu, choose Tools > Service Configuration Editor.
From the Console main menu, choose Tools > Service Configuration Editor.
A No Service Configuration Is Open dialog box appears (see Figure 4-67).
Figure 4-67 No Service Configuration Is Open
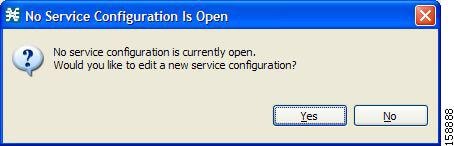
Step 2 ![]() Click Yes.
Click Yes.
A New Service Configuration Settings dialog box appears (see Figure 4-68).
Figure 4-68 New Service Configuration Settings
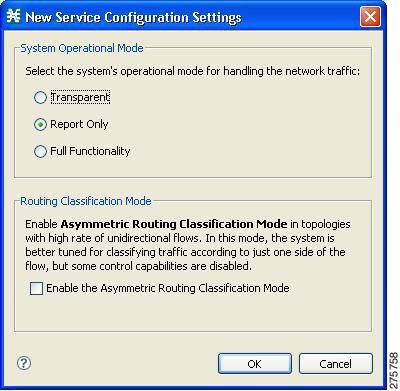
Step 3 ![]() Select one of the System Operational Mode radio buttons.
Select one of the System Operational Mode radio buttons.
•![]() Transparent—The system does not generate RDRs and does not enforce active rules on the network traffic.
Transparent—The system does not generate RDRs and does not enforce active rules on the network traffic.
•![]() Report only—The system generates RDRs only. No active rule enforcement is performed on the network traffic.
Report only—The system generates RDRs only. No active rule enforcement is performed on the network traffic.
•![]() Full functionality—The system enforces active rules on the network traffic and performs reporting functions (that is, generates RDRs).
Full functionality—The system enforces active rules on the network traffic and performs reporting functions (that is, generates RDRs).
Note ![]() You can change the system operational mode at any time.
You can change the system operational mode at any time.
Step 4 ![]() (Optional, but highly recommended if your system has a high proportion of unidirectional flows) To switch to asymmetric routing classification mode, check the Enable the Asymmetric Routing Classification Mode check box.
(Optional, but highly recommended if your system has a high proportion of unidirectional flows) To switch to asymmetric routing classification mode, check the Enable the Asymmetric Routing Classification Mode check box.
Note ![]() It is recommended that you do not change the routing classification mode after creating a service configuration, as this causes loss of service configuration data. (See Asymmetric Routing Classification Mode.)
It is recommended that you do not change the routing classification mode after creating a service configuration, as this causes loss of service configuration data. (See Asymmetric Routing Classification Mode.)
Step 5 ![]() Click OK.
Click OK.
A default service configuration opens in the Service Configuration Editor tool (see Figure 4-69).
Figure 4-69 Service Configuration Editor
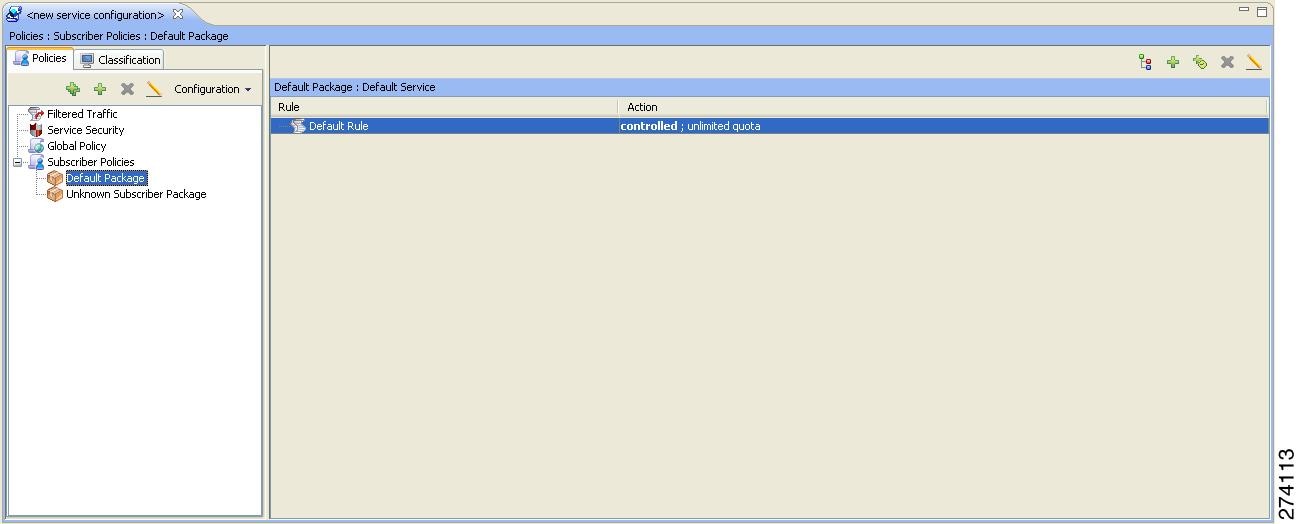
How to Close the Service Configuration Editor Tool
Step 1 ![]() Right-click the Service Configuration Editor button.
Right-click the Service Configuration Editor button.
Step 2 ![]() From the popup menu that appears, select Close.
From the popup menu that appears, select Close.
The Service Configuration Editor tool closes.
The Signature Editor Tool
The Signature Editor is a tool that allows you to create and modify files that can add and modify protocols and protocol signatures in SCA BB.
For more information about the Signature Editor, see Using the Signature Editor.
•![]() How to Open the Signature Editor Tool
How to Open the Signature Editor Tool
•![]() How to Close the Signature Editor Tool
How to Close the Signature Editor Tool
How to Open the Signature Editor Tool
Step 1 ![]() From the Console main menu, choose Tools > Signature Editor.
From the Console main menu, choose Tools > Signature Editor.
The Signature Editor tool opens (see Figure 4-70).
Figure 4-70 Signature Editor Tool
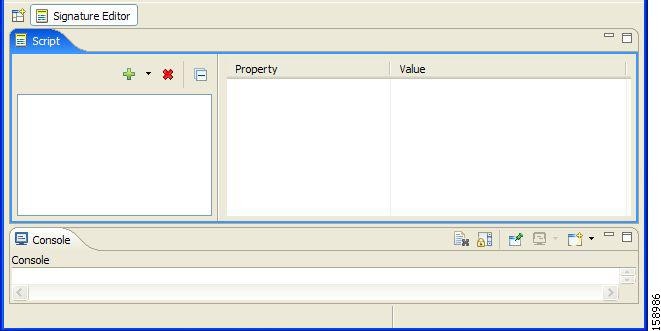
How to Close the Signature Editor Tool
Step 1 ![]() Right-click the Signature Editor button.
Right-click the Signature Editor button.
Step 2 ![]() From the popup menu that appears, select Close.
From the popup menu that appears, select Close.
The Signature Editor tool closes.
The Subscriber Manager GUI Tool
The Subscriber Manager (SM) GUI is a tool that allows you to connect to an SCMS-SM and then manage subscribers, assign packages to subscribers, edit subscriber parameters, and manually add subscribers.
For more information about connecting to an SCMS-SM and using the SM GUI, see Using the Subscriber Manager GUI Tool.
For more information about the SCMS-SM, see Cisco Service Control Management Suite Subscriber Manager User Guide.
How to Open the SM GUI Tool
Step 1 ![]() From the Console main menu, choose Tools > Subscriber Manager.
From the Console main menu, choose Tools > Subscriber Manager.
The SM GUI tool opens (see Figure 4-71).
Figure 4-71 Subscriber Manager
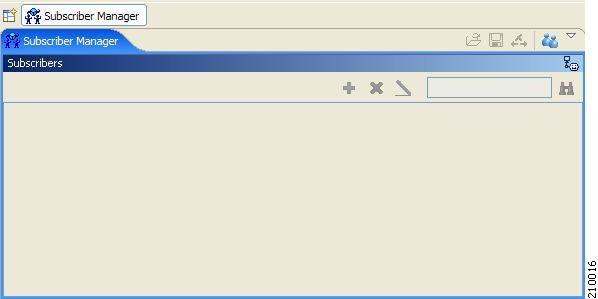
How to Close the SM GUI Tool
Step 1 ![]() Right-click the Subscriber Manager button.
Right-click the Subscriber Manager button.
Step 2 ![]() From the popup menu that appears, select Close.
From the popup menu that appears, select Close.
The SM GUI tool closes.
The Reporter Tool
The Cisco Service Control Application (SCA) Reporter is a tool that allows you to query the Cisco Service Control Management Suite (SCMS) Collection Manager (CM) RDR database, and present the results in a chart or a table. This valuable tool helps you to understand the habits and resource consumption of the applications and subscribers that use your network. It also helps you evaluate the efficacy of various rules and the possible impact of their implementation on the network. You can view the reports in both tabular and chart formats, export them, save them, and edit their appearance.
You can run the SCA Reporter as a standalone or inside the Reporter tool in the Console.
Note ![]() From SCA Reporter, if you launch reports that retrieve large number of records (around 800,000 and above), the processing might take a considerable amount of time. There might be a delay in launch of the reports and the system might appear to be halted. In rare instances, the console may close. To avoid such issues, use the time range for the report query.
From SCA Reporter, if you launch reports that retrieve large number of records (around 800,000 and above), the processing might take a considerable amount of time. There might be a delay in launch of the reports and the system might appear to be halted. In rare instances, the console may close. To avoid such issues, use the time range for the report query.
For more information about the SCA Reporter, see Cisco Service Control Application Reporter User Guide.
•![]() How to Open the Reporter Tool
How to Open the Reporter Tool
•![]() How to Close the Reporter Tool
How to Close the Reporter Tool
How to Open the Reporter Tool
Step 1 ![]() From the Console main menu, choose Tools > Reporter.
From the Console main menu, choose Tools > Reporter.
The Reporter tool opens (see Figure 4-72).
Figure 4-72 Reporter
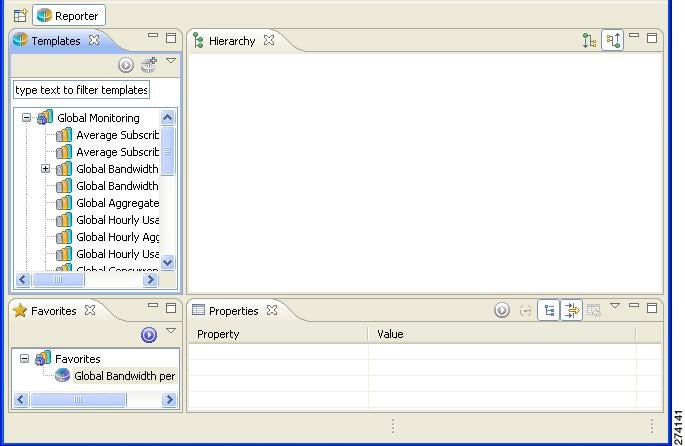
Note ![]() You can use the SCA Reporter to generate reports only if the Console is connected to a database. (See How to Make Databases Accessible to the SCA Reporter.)
You can use the SCA Reporter to generate reports only if the Console is connected to a database. (See How to Make Databases Accessible to the SCA Reporter.)
How to Close the Reporter Tool
Step 1 ![]() Right-click the Reporter button.
Right-click the Reporter button.
Step 2 ![]() From the popup menu that appears, select Close.
From the popup menu that appears, select Close.
The Reporter tool closes.
Online Help
You can access relevant parts of this user guide from the Console.
How to Access Online Help
Step 1 ![]() From the Console main menu, choose Help > Help Contents.
From the Console main menu, choose Help > Help Contents.
Online help opens in a separate window.
How to Search Online Help
You can also search online help from the current tool.
Step 1 ![]() From the Console main menu, choose Help > Search.
From the Console main menu, choose Help > Search.
The Help view opens next to the current tool (see Figure 4-73).
Figure 4-73 Help
Step 2 ![]() Enter a word, phrase, or more complex search expression in the Search expression field.
Enter a word, phrase, or more complex search expression in the Search expression field.
The Go button is enabled.
Note ![]() Click >> (Expand) for an explanation of how to construct search expressions.
Click >> (Expand) for an explanation of how to construct search expressions.
Step 3 ![]() Click Go.
Click Go.
Help topics containing your search expression are listed under Local Help.
Step 4 ![]() Click a help topic to view its contents.
Click a help topic to view its contents.
Note ![]() You can bookmark topics for later reference.
You can bookmark topics for later reference.
Step 5 ![]() By clicking the appropriate link at the bottom of the Help view, you can switch to:
By clicking the appropriate link at the bottom of the Help view, you can switch to:
•![]() All topics
All topics
•![]() Related topics
Related topics
•![]() Bookmarks
Bookmarks
Quick Start with the Console
This Quick Start section helps you get started with the Console. The section includes an example of using the Network Navigator tool and the Service Configuration Editor to apply the default service configuration to an SCE platform.
Example: How to Configure the Console and Apply the Default Service Configuration
In this example, you add an SCE device to the default site and apply the default service configuration to the SCE.
Step 1 ![]() Launch the Console.
Launch the Console.
Choose Start > All Programs > Cisco SCA > SCA BB Console 3.6.5 > SCA BB Console 3.6.5.
Step 2 ![]() If necessary, close the Welcome view.
If necessary, close the Welcome view.
Step 3 ![]() Open the Network Navigator.
Open the Network Navigator.
From the Console main menu, choose Tools > Network Navigator.
This step sets up the Console for network device operations.
Note ![]() The Network Navigator tool is open the first time you launch the Console.
The Network Navigator tool is open the first time you launch the Console.
You should now be able to see the default site displayed in the Network Navigator view.
Step 4 ![]() Add an SCE device to the default site.
Add an SCE device to the default site.
a. ![]() Right-click the default site, and, from the popup menu that appears, select New > SCE.
Right-click the default site, and, from the popup menu that appears, select New > SCE.
The Create new SCE wizard appears.
In the Address field, enter the actual IP address of an SCE platform.
b. ![]() Click Finish.
Click Finish.
The Create new SCE wizard closes.
The new device is added to the site.
Step 5 ![]() Check the SCE platform version and operational state.
Check the SCE platform version and operational state.
a. ![]() Right-click the SCE device and, from the popup menu that appears, select Online Status.
Right-click the SCE device and, from the popup menu that appears, select Online Status.
A Password Management dialog box appears.
b. ![]() Enter the username and password for managing the SCE.
Enter the username and password for managing the SCE.
c. ![]() Enter the SNMP RO Community String.
Enter the SNMP RO Community String.
d. ![]() Click Extract.
Click Extract.
The SCE online status is retrieved.
e. ![]() Check that the system and application versions are correct, and that the operational state is Active.
Check that the system and application versions are correct, and that the operational state is Active.
Step 6 ![]() Open the Service Configuration Editor.
Open the Service Configuration Editor.
•![]() From the Console main menu, choose Tools > Service Configuration Editor.
From the Console main menu, choose Tools > Service Configuration Editor.
The Service Configuration Editor opens.
A No Service Configuration Is Open dialog box appears.
Step 7 ![]() Create a new service configuration.
Create a new service configuration.
a. ![]() Click Yes in the No Editor Is Open dialog box.
Click Yes in the No Editor Is Open dialog box.
A New Service Configuration Settings dialog box appears.
b. ![]() Click OK.
Click OK.
A default service configuration opens in the Service Configuration Editor tool.
Step 8 ![]() Apply the service configuration to the SCE platform.
Apply the service configuration to the SCE platform.
a. ![]() From the toolbar, select
From the toolbar, select  (Apply Service Configuration to SCE Devices).
A Password Management dialog box appears.
b. ![]() Enter the username and password for managing the SCE and click Apply.
Enter the username and password for managing the SCE and click Apply.
The service configuration is applied to the SCE platform.
 Feedback