Cisco SCA BB SNMP Real Time Monitoring User Guide, Release 3.5.5
Bias-Free Language
The documentation set for this product strives to use bias-free language. For the purposes of this documentation set, bias-free is defined as language that does not imply discrimination based on age, disability, gender, racial identity, ethnic identity, sexual orientation, socioeconomic status, and intersectionality. Exceptions may be present in the documentation due to language that is hardcoded in the user interfaces of the product software, language used based on RFP documentation, or language that is used by a referenced third-party product. Learn more about how Cisco is using Inclusive Language.
- Updated:
- October 25, 2009
Chapter: Overview
Overview
Introduction
SNMP-based monitoring tools, such as MRTG, allow network administrators to monitor the activity and health of network devices in real time. Cisco SCA BB includes an SNMP-based real-time monitoring solution, which is implemented using MRTG and a Round Robin Database (RRDTool).
The SCA BB Real-Time Monitoring Configuration Utility (rtmcmd) is a command-line utility (CLU) for automating the production of the files required by the MRTG tool.
•![]() Components of SNMP RTM with MRTG and RRDTool
Components of SNMP RTM with MRTG and RRDTool
•![]() SCA BB Real-Time Monitoring Reports
SCA BB Real-Time Monitoring Reports
•![]() SCA BB Real-Time Monitoring Environment
SCA BB Real-Time Monitoring Environment
What are MRTG and RRDTool?
The Multi Router Traffic Grapher (MRTG) is a tool that monitors the traffic load on network links by monitoring specified SNMP counters. It generates HTML pages containing images that provide real-time visual representation of this traffic, allowing the user to see traffic load on a network over time in graphical form. The SCE platform running the SCA BB application provides numerous SNMP counters that can be used to produce reports.
Round Robin Database Tool (RRDTool) stores and displays time-series data. The data is stored in a round-robin database so that the system storage footprint remains constant over time. This tool is used in conjunction with MRTG to produce higher-quality graphics.
References
Refer to the following links for MRTG and RRDTool documentation and download:
•![]() MRTG web page
MRTG web page
•![]() RRDTool web page
RRDTool web page
Components of SNMP RTM with MRTG and RRDTool
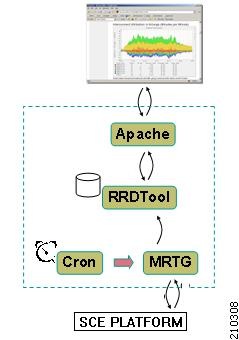
Following are the components of an MRTG / RRDTool monitoring system:
•![]() MRTG is a script that collects SNMP data from monitored devices. It monitors SNMP network devices and stores the retrieved data in a database. It is written in Perl and works on Unix/Linux and Windows.
MRTG is a script that collects SNMP data from monitored devices. It monitors SNMP network devices and stores the retrieved data in a database. It is written in Perl and works on Unix/Linux and Windows.
MRTG is free software licensed under the Gnu GPL. It requires the following:
–![]() Perl
Perl
–![]() RRDTool to persist data and to generate high quality graphs
RRDTool to persist data and to generate high quality graphs
•![]() The MRTG CFG file lists the SNMP OIDs of the SNMP counters that MRTG should poll.
The MRTG CFG file lists the SNMP OIDs of the SNMP counters that MRTG should poll.
•![]() RRDTool stores data and generates charts. RRDTool uses Round Robin Database to store time-series data, and generates charts using this data.
RRDTool stores data and generates charts. RRDTool uses Round Robin Database to store time-series data, and generates charts using this data.
RRDTool is a free software licensed under the Gnu GPL. It requires the following:
–![]() A web server to delegate user requests to the RRDTool's CGI interpreter
A web server to delegate user requests to the RRDTool's CGI interpreter
•![]() RRDTool CGI files implement the report web pages. These files are executable scripts residing on the web server. When you request a report web page, RRDTool executes the script and dynamically creates the updated chart.
RRDTool CGI files implement the report web pages. These files are executable scripts residing on the web server. When you request a report web page, RRDTool executes the script and dynamically creates the updated chart.
•![]() Cron (or any other scheduling service) periodically invokes MRTG to poll SNMP counters from monitored devices.
Cron (or any other scheduling service) periodically invokes MRTG to poll SNMP counters from monitored devices.
•![]() Apache (or any other web server) serves the charts to the user web browser.
Apache (or any other web server) serves the charts to the user web browser.
•![]() Cisco Service Control platforms support MIBs counters that are monitored by MRTG.
Cisco Service Control platforms support MIBs counters that are monitored by MRTG.
Figure 1-1 illustrates the components of a real-time SNMP monitoring system in action.
Figure 1-1 Components of a Real Time SNMP Monitoring System
References
Refer to the following links for RTM software components documentation and download:
•![]() PyCron (for windows setups)
PyCron (for windows setups)
•![]() ActivePerl (for running MRTG)
ActivePerl (for running MRTG)
•![]() Apache Web-Server
Apache Web-Server
SCA BB Real-Time Monitoring Reports
•![]() Pre-defined SCA BB Real-Time Monitoring Reports
Pre-defined SCA BB Real-Time Monitoring Reports
•![]() About Real-Time Monitoring Reports
About Real-Time Monitoring Reports
Pre-defined SCA BB Real-Time Monitoring Reports
MRTG and RRDTool each require configuration files containing the information necessary for creating the reports, such as the OIDs of the relevant SNMP counters. To simplify the process of creating and maintaining MRTG configuration files and RRDTool CGI report files, Cisco SCA BB provides the following:
•![]() A set of templates for creating MRTG CFG files and RRDTool CGI files that implement pre-defined reports based on SCE and SCA BB MIBs. These templates cannot be used as is, and must first be processed to reflect the specific Service Configuration to be monitored.
A set of templates for creating MRTG CFG files and RRDTool CGI files that implement pre-defined reports based on SCE and SCA BB MIBs. These templates cannot be used as is, and must first be processed to reflect the specific Service Configuration to be monitored.
•![]() A software tool, rtmcmd, that processes the templates into CFG and CGI files, according to the specified SCA BB Service Configuration and SCE platform hostname or IP address.
A software tool, rtmcmd, that processes the templates into CFG and CGI files, according to the specified SCA BB Service Configuration and SCE platform hostname or IP address.
Table 1-1 lists the available Cisco Service Control pre-defined SNMP based reports.
About Real-Time Monitoring Reports
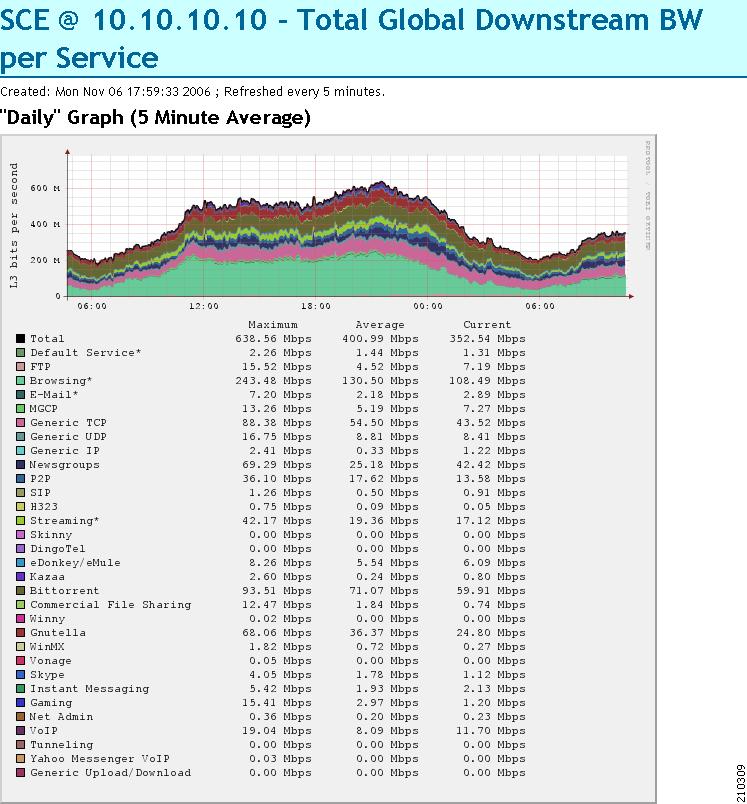
Note the following general information regarding charts:
•![]() Each report is actually made of the following four charts, representing different time scales. These charts are based on the round robin archives for each SNMP counter (the archives are created by MRTG).
Each report is actually made of the following four charts, representing different time scales. These charts are based on the round robin archives for each SNMP counter (the archives are created by MRTG).
–![]() Daily (5-minute average)
Daily (5-minute average)
–![]() Weekly (30-minute average)
Weekly (30-minute average)
–![]() Monthly (2-hour average)
Monthly (2-hour average)
–![]() Yearly (1-day average)
Yearly (1-day average)
•![]() The legend items for each graph item (including the total item) include the following information for each item:
The legend items for each graph item (including the total item) include the following information for each item:
–![]() Average value
Average value
–![]() Maximum value
Maximum value
–![]() Current value
Current value
•![]() The data in each chart is a series of average values (a series of 5-minute-average values for the daily chart, 30-minute-average for the weekly chart, and so on)
The data in each chart is a series of average values (a series of 5-minute-average values for the daily chart, 30-minute-average for the weekly chart, and so on)
•![]() Maximum value items do not show the actual highest value of the monitored counter in each period, but rather the highest average value in the series, which is likely to be lower than the actual maximum value.
Maximum value items do not show the actual highest value of the monitored counter in each period, but rather the highest average value in the series, which is likely to be lower than the actual maximum value.
•![]() The colors of the chart items are taken from a pre-defined, non-configurable set of colors.
The colors of the chart items are taken from a pre-defined, non-configurable set of colors.
Figure 1-2 shows a report example.
Figure 1-2 Sample Graph
SCA BB Real-Time Monitoring Environment
•![]() SCA BB Real-Time Monitoring Setup
SCA BB Real-Time Monitoring Setup
SCA BB Real-Time Monitoring Setup
An RTM setup requires the installation of the components described in Chapter 3, "Real-Time Monitoring Configuration Utility," and can be set up on either Windows or Unix/Linux servers.
The Chapter 2, "Getting Started" provides a step by step description how to set up a SCA BB RTM system.
SCA BB RTM system requires MRTG version 2.14 and RRDTool version 1.2. Consult the MRTG web site for the exact required Perl version.
Cisco has tested SCA BB RTM systems on the following setups:
•![]() Windows 2000/XP using Apache v2.2 and PyCron v0.5
Windows 2000/XP using Apache v2.2 and PyCron v0.5
•![]() Linux Red-Hat 3 and Red-Hat 4.
Linux Red-Hat 3 and Red-Hat 4.

Note ![]() The SCA BB RTM functionality can support up to 90 SCE platforms.
The SCA BB RTM functionality can support up to 90 SCE platforms.
RTM Directory
To view a report, RTM users browse to a URL mapped to a designated directory on their web server. This designated directory is referred to as the RTM directory. Users are required to create the RTM directory under the web server web documents directory tree; for example, when using an Apache web server on a Windows system, the RTM directory might be located at C:/PROGRA~1/APACHE~1/Apache2.2/htdocs/rtm. Upon completion of an RTM setup installation (see Chapter 2, "Getting Started"), the SCA BB RTM directory contains the following sub-directories and files:
•![]() An mrtg-cfg folder containing an MRTG CFG file for each monitored SCE platform. The CFG file names have the following pattern <SCE IP/Host- name>_scabb_mrtg.cfg.
An mrtg-cfg folder containing an MRTG CFG file for each monitored SCE platform. The CFG file names have the following pattern <SCE IP/Host- name>_scabb_mrtg.cfg.
•![]() A directory for each SCE named sce_<SCE IP/Host-name >. These directories contain the Report CGI files and the RRDTool archives after the first invocation of MRTG.
A directory for each SCE named sce_<SCE IP/Host-name >. These directories contain the Report CGI files and the RRDTool archives after the first invocation of MRTG.
•![]() A static folder containing common, invariant files such as CSS and image files.
A static folder containing common, invariant files such as CSS and image files.
•![]() A htaccess file (Apache web server only). This file is used to exclude files or folders from the automatic listings of the RTM directory.
A htaccess file (Apache web server only). This file is used to exclude files or folders from the automatic listings of the RTM directory.
 Feedback