Release 6.2: Cisco Vision Dynamic Signage Director Administration Guide
Bias-Free Language
The documentation set for this product strives to use bias-free language. For the purposes of this documentation set, bias-free is defined as language that does not imply discrimination based on age, disability, gender, racial identity, ethnic identity, sexual orientation, socioeconomic status, and intersectionality. Exceptions may be present in the documentation due to language that is hardcoded in the user interfaces of the product software, language used based on RFP documentation, or language that is used by a referenced third-party product. Learn more about how Cisco is using Inclusive Language.
- Updated:
- July 29, 2019
Chapter: System State Reports
System State Reports
The System State Report application enables easy capture and export of system state data for Cisco Vision Dynamic Signage Director servers. Send this information to a remote support engineer to help troubleshoot issues with the system.
Information About System State Reports
Figure 1 shows the System State Report screen.
Figure 1 System State Report Screen
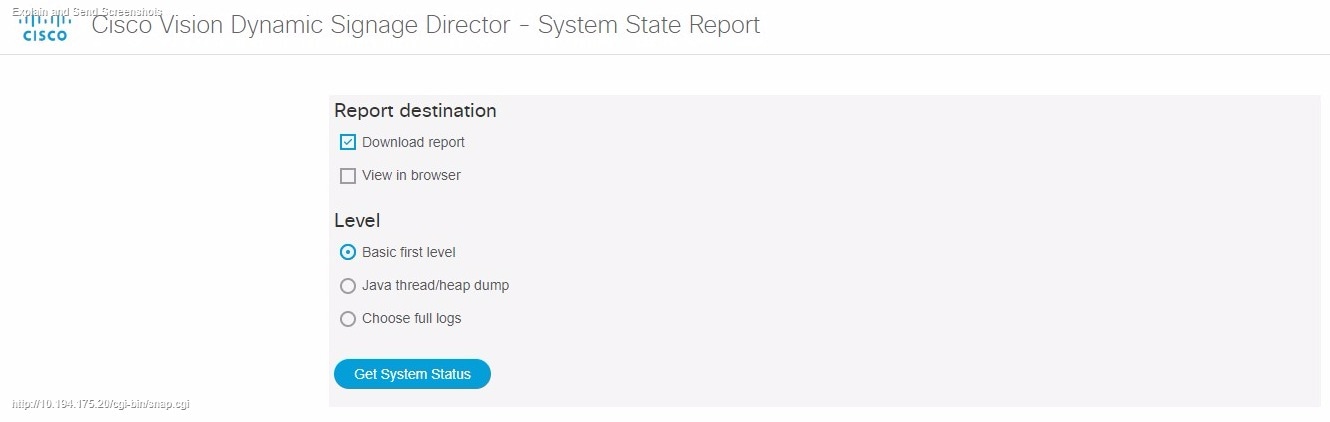
Table 1 describes the options provided on the System State Report screen.
How to Run a System State Report
This section includes the following tasks:
■![]() Running a System State Report Manually
Running a System State Report Manually
■![]() Scheduling a System State Report
Scheduling a System State Report
Running a System State Report Manually
To run a system state report manually:
1.![]() From the Cisco Vision Dynamic Signage Director server Main Menu, go to More > System State Report.
From the Cisco Vision Dynamic Signage Director server Main Menu, go to More > System State Report.
2.![]() Select one or both report destination types, Download report and/or View in browser.
Select one or both report destination types, Download report and/or View in browser.
3.![]() Under Level, select the type of report that you want to run.
Under Level, select the type of report that you want to run.
4.![]() Click Get System Status. A status bar displays while the report is generating.
Click Get System Status. A status bar displays while the report is generating.
Scheduling a System State Report
You can extract the system state data on a periodic basis. Go to Tools > Management Dashboard. Click the Tools drawer > Advanced > Scheduled Tasks function. View the reports generated under Previous Reports on the main System State Report page.
1.![]() Go to More > Management Dashboard and select Tools drawer > Advanced tab > Scheduled Tasks.
Go to More > Management Dashboard and select Tools drawer > Advanced tab > Scheduled Tasks.
2.![]() Click Add Row and add a row with the task type being SystemStateExtractorTask.
Click Add Row and add a row with the task type being SystemStateExtractorTask.
3.![]() Enter a task time as desired.
Enter a task time as desired.
View the reports generated under Previous Reports on the main System State Report page.
Viewing Reports
After manually running a report, the screen displays “Report is ready” as shown in Figure 2.
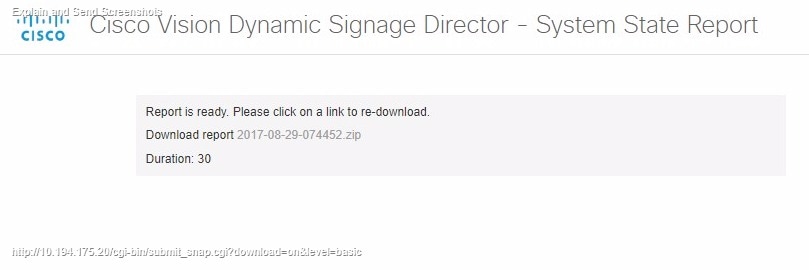
Depending on the option(s) that you selected before running the report, you can view the report in your browser by selecting the link provided.
If you downloaded the report, then depending on your browser and its settings, you will get a dialog box to save the report on your local machine. If the automatic download does not work, click on the link after the word Download to download the file again. The report downloads as a compressed file (.zip) containing multiple parts to the report.
Note: The heap dump report type is a compressed report file which you can save to your local drive and forward to support personnel for troubleshooting.It is packaged like the Basic Level report.
Viewing Scheduled Reports and Previous Reports
View scheduled reports under Previous Reports on the System State Report screen. The format of the file name is the date and time that the report was run.
Click one of the timestamps under Previous Reports to download the report that ran at the scheduled time. You may get a dialog box to save the report on your local machine. If so, save it as desired. This is a compressed file containing multiple parts to the report.
Viewing the Contents of the Zip File
Once you have downloaded the report file to your PC, you will have a.zip file. You can email it to Cisco support as is.
To view the contents of a downloaded file:
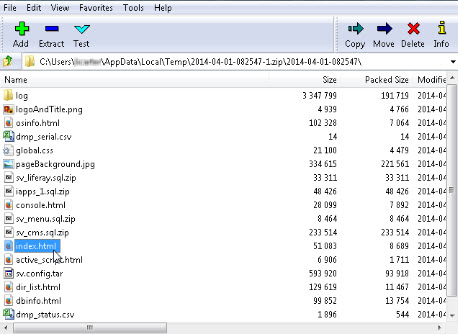
1.![]() Double-click the file to open the.zip file archive manager. The contents of this file depends on the file compression software program installed on your PC. Figure 3 shows an example of a common Microsoft Windows compression file manager, where the.zip file is opened to view the contents.
Double-click the file to open the.zip file archive manager. The contents of this file depends on the file compression software program installed on your PC. Figure 3 shows an example of a common Microsoft Windows compression file manager, where the.zip file is opened to view the contents.
Figure 3 Windows Compression File Manager Example
2.![]() Click Extract and load all of the files in the archive to a new directory on your local drive.
Click Extract and load all of the files in the archive to a new directory on your local drive.
3.![]() Navigate to the directory that you just created and locate a file named index.html. Double-click the file and it will open in your internet browser.
Navigate to the directory that you just created and locate a file named index.html. Double-click the file and it will open in your internet browser.
4.![]() Click links from the browser page to view the rest of the report.
Click links from the browser page to view the rest of the report.
Tip: In the case of the heap dump and log file reports, there is not an “index.html” file. Navigate down the levels of folders until you see the log files of interest.
 Feedback