Admin User Reports
This section provides the details about the following types of reports for the admin user:
Current Viewers Report
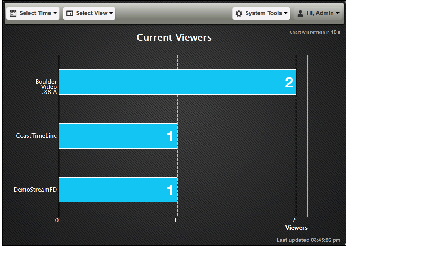
The StadiumVision Mobile Reporter provides a report that depicts the current number of unique clients using StadiumVision Mobile, as shown in Figure 1.
Figure 1 Current Viewers Report
Event Scorecard—Quality and Uptake Scores
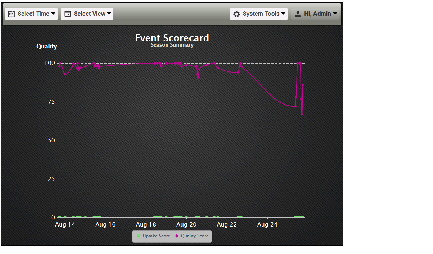
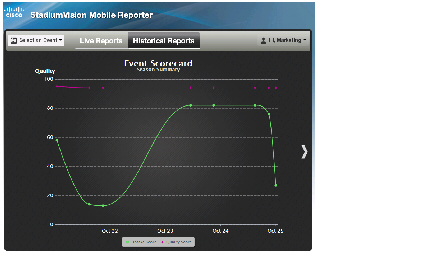
When you log into Cisco StadiumVision Mobile Reporter as an admin, the Event Scorecard report opens with the Season Summary as the default view.
Figure 2 Event Scorecard Report—Default View
The uptake score is a measure of the number of WiFi devices that are on a venue’s WiFi network compared to how many of those devices are using the Cisco StadiumVision Mobile app. It is the percentage of devices using the SDK out of all the devices on the appropriate SSID in the wireless network.
Both the Quality Score and the Uptake Score will be a value between 0 and 100. When Prime Infrastructure is disabled, the Uptake Scores will be zero as shown in Figure 2.
Data Export Reports
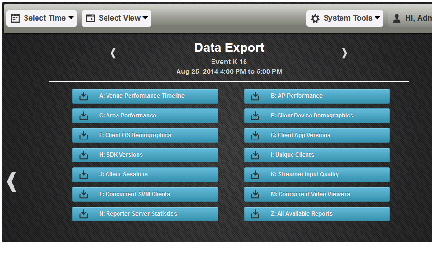
The list of reports available for data export for the selected event are displayed from the Cisco StadiumVision Mobile Reporter admin screen using the Select View > Data Export option.
Timesaver Depending on your data collection and the report that you are viewing, certain navigation buttons are available:
—You can toggle between the Event Scorecard and Data Export report views for the selected event using the < and > buttons located in the middle of the report screen (on either side of the chart).
—You can select other events in the data collection using the < and > buttons located at the top of the report screen (on either side of the chart title).
Figure 3 Data Export Reports—Download View
Table 1 lists the admin user reports available via the Data Export menu option, as well as a description of the report and its corresponding download filename. Reports are exported from the Cisco StadiumVision Mobile Reporter as CSV (comma-separated values) files contained within a.zip file. The CSV file can be viewed in a spreadsheet application.
Table 1 Admin User Data Export Reports
|
|
|
A: Venue Performance Timeline |
Errors per minute based on client SDK statistics. |
B: AP Performance |
Quality fields organized by Access Point (AP). |
C: Area Performance |
Key quality fields organized by logical area which can include multiple APs. |
E: Client Device Demographics |
Metrics categorized by Device Type. One row per client device type and band. Device Type is determined from the manufacturer and model information. |
D: Location Performance |
Available for internal testpoint data only. |
F: Client OS Demographics |
Metrics categorized by Device OS. One row per client device type and band. |
G: Client App Versions |
Metrics categorized by App Version. One row per client device type and band. |
H: SDK Versions |
Metrics categorized by SDK Version. One row per client device type and band. |
I: Unique Clients |
List of unique client devices. One row per client device type and band. |
J: Client Sessions |
Detailed information about each client session. A client session occurs whenever a user on a mobile device starts an audio or video channel, or initiates a data file transfer from the Cisco StadiumVision Mobile Streamer. When that user activity stops, that client session is terminated, but the client can start a new session. |
K: Streamer Input Quality |
Provides metrics indicating the quality of the Streamer input streams. |
L: Concurrent SVM Clients |
Provides the data for the marketing chart named Concurrent SVM Clients. For more information on the marketing chart of the same name, see the “Concurrent SVM Clients” section. |
M: Concurrent Video Viewers |
This report gives the number of unique users per channel per minute based on WiFi MAC address. It is updated every minute. |
N: Reporter Server Statistics |
Provides system performance metrics and troubleshooting information. |
Z: All Available Reports |
This is an archive that contains all reports in the above list, subject to there being data for that report for that time period. |
Data Export—Report Field Descriptions
This section provides detailed descriptions of the fields contained within each report.
Key Service Quality Fields
Table 2 lists the key fields for measuring Cisco StadiumVision Mobile service quality.
Table 2 Service Quality Field Descriptions
|
|
|
Expected Value or Range for Normal Operation
|
Unrecoverable block error ratio |
Percentage of blocks that could not be recovered via forward error correction (FEC). An indicator of network multicast performance. |
5% or less is an acceptable value. Greater than 5% indicated abnormal conditions. |
(Video) Glitches per minute |
Number of buffering stalls per minute, accumulated over all of the devices reporting. |
Greater than 6 indicates a problem. |
Streamer announcements loss ratio (%) |
Percentage of the Cisco StadiumVision Mobile Streamer service announcements that were missed. An indicator of network multicast performance. |
20% or less is an acceptable value. Anything greater than 20% indicates abnormal conditions. |
Stats upload failure ratio |
Percentage of stat reports that could not be uploaded to Cisco StadiumVision Mobile Reporter. An indicator of network unicast performance. |
10% or less is normal; 10-25% indicates an area for concern; greater than 25% indicates a very bad failure rate. |
Average RSSI |
Received Signal Strength Indicator. A measurement of the power present in a received radio signal. |
5 GHz: -68 dbm or better
2.4 GHz: -63 dbm
Average: -65 dbm |
Venue Performance Timeline
Note This report is based only on video sessions, not on audio or data sessions.
Table 3 Venue Performance Timeline Report Fields Descriptions
|
|
|
Time |
Time of measurement. |
Block Error ratio (%) |
Blocks that could not be recovered via forward error correction (FEC). |
Unrecoverable block error ratio (%) |
Percentage of blocks that could not be recovered via forward error correction (FEC). An indicator of network multicast performance. |
Glitches Per Minute |
Number of buffering stalls per minute, accumulated over all of the devices reporting. |
AP Performance
Table 4 AP Performance Report Field Descriptions
|
|
|
AP Radio MAC |
Access point basic service set identifier. Use to identify access points and their associated clients. |
Band |
WiFi spectrum assignment. |
AP Name |
Name assigned to the wireless access point. |
AP Area |
Set of APs grouped as an area. |
Date |
Event date. |
Event |
Event name. |
| Non-Session Fields |
Total unique SVM Clients |
Number of unique clients that Reporter has heard from, including clients that never consumed any video, audio or data sessions. |
Reporting Activity (min) |
The total length of client reporting activity. |
Stats Upload Failure ratio (%) |
Percentage of stat reports that could not be uploaded to Cisco StadiumVision Mobile Reporter. An indicator of network unicast performance. |
Streamer announce loss ratio (%) |
Percentage of lost streamer announcements. |
Average RSSI (dBm) |
Received Signal Strength Indicator. A measurement of the power present in a received radio signal. An average value. |
| Video Session Fields |
Unique SVM Video clients |
Number of unique clients that consumed at least one video session. |
Session time (min) |
Cumulative value of all the sessions from all the clients reporting, for the given AP and Band combination. |
Unrecoverable block error ratio (%) |
Percentage of blocks that could not be recovered via forward error correction (FEC). An indicator of network multicast performance. |
Video glitches per minute |
Number of buffering stalls per minute, accumulated over all of the devices reporting for the given AP and Band. |
| Audio Session Fields |
Unique SVM Audio clients |
Number of unique clients that consumed at least one audio session. |
Session time (min) |
Cumulative value of all the sessions from all the clients reporting, for the given AP and Band combination. |
Unrecover block error ratio (%) |
Percentage of blocks that could not be recovered via forward error correction (FEC). An indicator of network multicast performance. |
Audio glitches per minute |
Number of buffering stalls per minute, accumulated over all of the devices reporting for the given AP and Band. |
| Data Session Fields |
Unique SVM Data clients |
Number of unique clients that consumed at least one data session. |
Session time (min) |
Session length of time in minutes. |
Unrecover block error ratio (%) |
Percentage of blocks that could not be recovered via forward error correction (FEC). An indicator of network multicast performance. |
Area Performance
Table 5 Area Performance Report Field Descriptions
|
|
|
AP Area |
Set of APs grouped as an area. |
Band |
WiFi spectrum assignment. |
Date |
Event date. |
Event |
Event name. |
| Non-Session Fields |
Total unique SVM Clients |
Number of unique clients that Reporter has heard from, including clients that never consumed any video, audio or data sessions. |
Reporting Activity (min) |
The total length of client reporting activity. |
Stats Upload Failure ratio (%) |
Percentage of stat reports that could not be uploaded to Cisco StadiumVision Mobile Reporter. An indicator of network unicast performance. |
Streamer announce loss ratio (%) |
Percentage of lost streamer announcements. |
Average RSSI (dBm) |
Received Signal Strength Indicator. A measurement of the power present in a received radio signal. An average value. |
| Video Session Fields |
Unique SVM Video clients |
Number of unique clients that consumed at least one video session. |
Session time (min) |
Length of session in minutes. |
Unrecoverable block error ratio (%) |
Percentage of blocks that could not be recovered via forward error correction (FEC). An indicator of network multicast performance. |
Video glitches per minute |
Number of buffering stalls per minute, accumulated over all of the devices reporting for the given area. |
| Audio Session Fields |
Unique SVM Audio clients |
Number of unique clients that consumed at least one audio session. |
Session time (min) |
Length of session in minutes. |
Unrecover block error ratio (%) |
Percentage of blocks that could not be recovered via forward error correction (FEC). An indicator of network multicast performance. |
Audio glitches per minute |
Number of buffering stalls per minute, accumulated over all of the devices reporting for the given area. |
Client Device Demographics
Table 6 Client Device Demographics Report Field Descriptions
|
|
|
Device Type |
Device name and model number. |
Band |
WiFi spectrum assignment. |
Date |
Event date. |
Event |
Event name. |
| Non-Session Fields |
Total unique SVM Clients |
Number of unique clients that Reporter has heard from, including clients that never consumed any video, audio or data sessions. |
Reporting Activity (min) |
The total length of client reporting activity for the specific device type and band. |
Stats Upload Failure ratio (%) |
Percentage of stat reports that could not be uploaded to Cisco StadiumVision Mobile Reporter. An indicator of network unicast performance. |
Streamer announce loss ratio (%) |
Percentage of lost streamer announcements. |
Average RSSI (dBm) |
Received Signal Strength Indicator. A measurement of the power present in a received radio signal. An average value. |
| Video Session Fields |
Unique SVM Video clients |
Number of unique clients that consumed at least one video session. |
Session time (min) |
Length of session in minutes. |
Unrecoverable block error ratio (%) |
Percentage of blocks that could not be recovered via forward error correction (FEC). An indicator of network multicast performance. |
Video glitches per minute |
Number of buffering stalls per minute, accumulated over all of the devices reporting. |
| Audio Session Fields |
Unique SVM Audio clients |
Number of unique clients that consumed at least one audio session. |
Session time (min) |
Length of session in minutes. |
Unrecover block error ratio (%) |
Percentage of blocks that could not be recovered via forward error correction (FEC). An indicator of network multicast performance. |
Audio glitches per minute |
Number of buffering stalls per minute, accumulated over all of the devices reporting. |
Client OS Demographics
Table 7 Client OS Demographics Report Field Descriptions
|
|
|
Client OS |
Name of the operating system and version used on a client device. |
Band |
WiFi spectrum assignment. |
Date |
Event date. |
Event |
Event name. |
| Non-Session Fields |
Total unique SVM Clients |
Number of unique clients that Reporter has heard from, aggregated for the specific Client OS, including clients that never consumed any video, audio or data sessions. |
Reporting Activity (min) |
The total length of client reporting activity. |
Stats Upload Failure ratio (%) |
Percentage of stat reports that could not be uploaded to Cisco StadiumVision Mobile Reporter. An indicator of network unicast performance. |
Streamer announce loss ratio (%) |
Percentage of lost streamer announcements. |
Average RSSI (dBm) |
Received Signal Strength Indicator. A measurement of the power present in a received radio signal. An average value. |
| Video Session Fields |
Unique SVM Video clients |
Number of unique clients that consumed at least one video session. |
Session time (min) |
Length of session in minutes. |
Unrecoverable block error ratio (%) |
Percentage of blocks that could not be recovered via forward error correction (FEC). An indicator of network multicast performance. |
Video glitches per minute |
Number of buffering stalls per minute, accumulated over all of the devices reporting. |
| Audio Session Fields |
Unique SVM Audio clients |
Number of unique clients that consumed at least one audio session. |
Session time (min) |
Length of session in minutes. |
Unrecover block error ratio (%) |
Percentage of blocks that could not be recovered via forward error correction (FEC). An indicator of network multicast performance. |
Audio glitches per minute |
Number of buffering stalls per minute, accumulated over all of the devices reporting. |
Client App Versions
Table 8 Client App Versions Report Field Descriptions
|
|
|
Client App Version |
Client application version. |
Band Ghz |
WiFi spectrum assignment. |
Date |
Event date. |
Event |
Event name. |
| Non-Session Fields |
Total unique SVM Clients |
Number of unique clients that Reporter has heard from, including clients that never consumed any video, audio or data sessions. |
Reporting Activity (min) |
The total length of client reporting activity. |
Stats Upload Failure ratio (%) |
Percentage of stat reports that could not be uploaded to Cisco StadiumVision Mobile Reporter. An indicator of network unicast performance. |
Streamer announce loss ratio (%) |
Percentage of lost streamer announcements. |
Average RSSI (dBm) |
Received Signal Strength Indicator. A measurement of the power present in a received radio signal. An average value. |
| Video Session Fields |
Unique SVM Video clients |
Number of unique clients that consumed at least one video session. |
Session time (min) |
Length of session in minutes. |
Unrecoverable block error ratio (%) |
Percentage of blocks that could not be recovered via forward error correction (FEC). An indicator of network multicast performance. |
Video glitches per minute |
Number of buffering stalls per minute, accumulated over all of the devices reporting. |
| Audio Session Fields |
Unique SVM Audio clients |
Number of unique clients that consumed at least one audio session. |
Session time (min) |
Length of session in minutes. |
Unrecover block error ratio (%) |
Percentage of blocks that could not be recovered via forward error correction (FEC). An indicator of network multicast performance. |
Audio glitches per minute |
Number of buffering stalls per minute, accumulated over all of the devices reporting. |
| Data Session Fields |
Unique SVM Data clients |
Number of unique clients that consumed at least one data session. |
Session time (min) |
Session length of time in minutes. |
SDK Versions
Table 9 SDK Versions Report Field Descriptions
|
|
|
SDK Version |
Version number of the Cisco StadiumVision Mobile SDK. |
Band |
WiFi spectrum assignment. |
Date |
Event date. |
| Non-Session Fields |
Total unique SVM Clients |
Number of unique clients that Reporter has heard from, including clients that never consumed any video, audio or data sessions. |
Reporting Activity (min) |
The total length of client reporting activity. |
Stats Upload Failure ratio (%) |
Percentage of stat reports that could not be uploaded to Cisco StadiumVision Mobile Reporter. An indicator of network unicast performance. |
Streamer announce loss ratio (%) |
Percentage of lost streamer announcements. |
Average RSSI (dBm) |
Received Signal Strength Indicator. A measurement of the power present in a received radio signal. An average value. |
| Video Session Fields |
Unique SVM Video clients |
Number of unique clients that consumed at least one video session. |
Session time (min) |
Length of session in minutes. |
Unrecoverable block error ratio (%) |
Percentage of blocks that could not be recovered via forward error correction (FEC). An indicator of network multicast performance. |
Video glitches per minute |
Number of buffering stalls per minute, accumulated over all of the devices reporting. |
| Audio Session Fields |
Unique SVM Audio clients |
Number of unique clients that consumed at least one audio session. |
Session time (min) |
Length of session in minutes. |
Unrecover block error ratio (%) |
Percentage of blocks that could not be recovered via forward error correction (FEC). An indicator of network multicast performance. |
Audio glitches per minute |
Number of buffering stalls per minute, accumulated over all of the devices reporting. |
| Data Session Fields |
Unique SVM Data clients |
Number of unique clients that consumed at least one data session. |
Session time (min) |
Session length of time in minutes. |
Unique Clients
Table 10 Unique Clients Report Field Descriptions
|
|
|
Device UUID |
Universally unique identifier (UUID). For SVM, this ID is unique for each device for each installation of an SVM app. |
MAC Address |
MAC address assigned to the SVM client (mobile device). |
Manufacturer |
Manufacturer name. |
Model |
Device model name. |
OS Type |
Operating system type. |
OS Version |
Operating system version. |
Brand |
Device brand name. |
HW Model |
Hardware model number. |
Platform |
Platform name. |
App Name |
Application name. |
App ver |
Application version. |
SDK ver |
Version of the Cisco StadiumVision Mobile Reporter client SDK. |
Client Sessions
Table 11 Client Sessions Report Field Descriptions
|
|
|
Session UUID |
Session universally unique identifier (UUID). |
Session Type |
Either video, audio, or data. |
Client device UUID |
Device universally unique identifier (UUID). |
BSSID |
Basic Service Set Identification (BSSID). The BSSID is the MAC address of the wireless access point. |
Channel name |
WiFi channel. |
Start Time 24H |
Time in 24 hour format. |
Client MAC Address |
Client media access control address (MAC address). |
Client IP Address |
Client IP address. |
App name |
Application name. |
App ver |
Application version. |
SDK ver |
Version number of the Cisco StadiumVision Mobile SDK. |
AP |
Access point MAC address. |
AP Name |
Access point name. |
Band GHz |
WiFi spectrum assignment. |
Wifi channel |
WiFi channel. |
Test point |
Internal field used by Cisco TAC. |
Session time (min) |
Session time in minutes. |
Blocks Received |
Total blocks received. |
Unrecoverable block error ratio (%) |
Percentage of blocks that could not be recovered via forward error correction (FEC). An indicator of network multicast performance. |
Video glitches per minute |
Calculated as the number of unrecoverable block errors per minute. |
Audio glitches per minute |
Number of buffering stalls per minute, accumulated over all of the devices reporting. |
Stats upload failure ratio (%) |
Percentage of stat reports that could not be uploaded to Cisco StadiumVision Mobile Reporter. An indicator of network unicast performance. |
Streamer announce loss ratio (%) |
Percentage of lost streamer announcements. |
Average RSSI (dBm) |
Received Signal Strength Indicator. A measurement of the power present in a received radio signal. An average value. |
Streamer Input Quality
Table 12 Streamer Input Quality Report Field Descriptions
|
|
|
Time |
Time in 24 hour format. |
Channel Name |
Assigned channel name. |
Total Delta |
A comparison of current and previous video protection windows. |
Active Delta |
A comparison of current and previous active video windows. |
Discontinuity Event |
An internal event in the Cisco StadiumVision Mobile Streamer which is used to rate video quality. |
Concurrent SVM Clients
Table 13 Concurrent Clients Report Field Descriptions
|
|
|
Time |
Time data was polled. |
SVM Clients |
Number of Cisco StadiumVision Mobile clients. |
Concurrent Video Viewers
Table 14 Concurrent Video Viewers Report Field Descriptions
|
|
|
Time |
Time in 24 hour format. |
Channel Name |
Assigned channel name. |
Users |
Number of users. |
Reporter Server Statistics
Table 15 Reporter Server Statistics Report Field Descriptions
|
|
|
Time |
Time in 24 hour format. |
apache status |
One or zero; one means up, zero means down. |
cassandra log msgs |
Configuration database log messages. |
cassandra status |
One or zero; one means up, zero means down. |
cpu util |
CPU utilization percentage. |
disk free gb |
Hard disk free space in gigabytes. |
disk used gb |
Hard disk space used in gigabytes. |
disk util |
Hard disk utilization percentage. |
httpd log msgs |
Apache httpd log messages. |
load avg |
|
memory util |
Memory utilization. |
mongo log msgs |
Report database log messages. |
mongo status |
One or zero; one means up, zero means down. |
sym log msgs |
Cisco StadiumVision Mobile log messages. |
svm server status |
One or zero; one means up, zero means down. |
swap util |
Swap utility status. |
Marketing User Reports
The marketing user has access to six report types. Each of these reports has two distinct presentation views. One view is the event view, which presents data collected during the span of one specific event. The other view is the season view, which presents summarized data for all of this seasons events that have been completed so far.
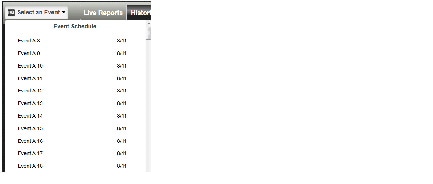
Reports are organized into three categories: Live Reports, Historical Reports, and the Season Reports (listed in Table 16 ).
- Live Reports—Real-Time reports
- Historical Reports—Reports for a specific event
- Season Reports—Cumulative reports over a span of time
The Cisco StadiumVision Mobile Reporter user interface distinguishes between the event view for past events and the event view for a live event happening right now. This separation is mostly a navigational one, as the live and historical event views are almost identical.
.
Marketing Report Navigation and Showing Detail
- To see a report for a particular event, use the Select an Event dropdown (Figure 4).
Figure 4 Choosing an Event
- You can move between reports for the selected event using the < and > buttons located in the middle of the report screen (on either side of the chart).
- If you have multiple series of plots, you can show/hide plots on the chart using the button at the bottom of some reports.
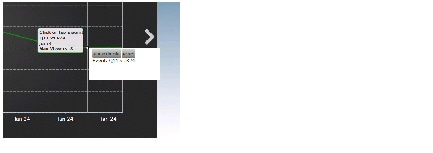
- Several reports offer additional details for an event by clicking on the data point in the chart, and clicking show details, as shown in Figure 5.
Figure 5 Sample Report Time Point Detail
Report Terminology
To maximize report comprehension, the following terminology should be understood.
.
|
|
|
WiFi Client |
A generic WiFi device, such as a tablet or smartphone, which may or may not be running an SVM client app. |
SVM Client |
A Google Android or Apple iOS client with an SVM app installed. |
Video Viewer |
An SVM client that is watching a video channel. |
Concurrent |
Used to describe clients that are performing the same task at the same time. For example clients watching the same channel at the same time are concurrent viewers of that channel. |
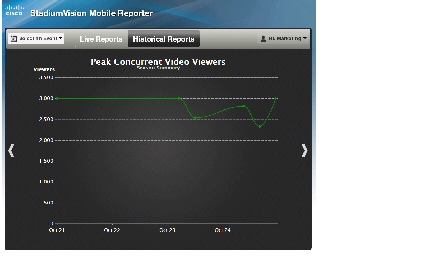
Peak Concurrent Video Viewers |
The event report shows the highest number of SVM clients that are viewed at the same time for each of the available video channels during a specific event. The live event report has a unique twist in that in addition to peak viewers it also shows the current number of viewers watching each channel right now. The season report shows the highest number of SVM clients that concurrently viewed video for each of the past events, regardless of channel. |
Event Scorecard Report
Figure 6 Event Scorecard Report
Peak Concurrent Video Viewers Report
Figure 7 Peak Concurrent Video Viewers Report
Understanding Peak Viewer Reporting: Example
1. A group of 20 clients (A) watch the in-house channel for the entire game.
2. A second group of 10 clients (B) watch the in-house channel for the first half. At half time they switch to ESPN. Finally, right before the start of the 2nd half all 10 clients are turned off.
3. A third group of 5 clients (C) show up during the second half, and watch ESPN for the remainder of the game.
As a result the event report shows 30 peak viewers for the in-house channel, and 10 peak viewers for ESPN. The season report shows 30 peak viewers for the event.
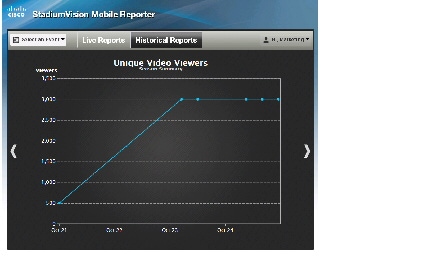
Unique Video Viewers
Figure 8 Unique Video Viewers Report
The event report shows the number of unique SVM clients that watched each of the available video channels during a specific event. An SVM client is uniquely identified by its UUID, and is only counted once per channel it viewed, even if it left a channel and resumed viewing it later. A client that watches multiple channels during the event is counted as one unique viewer for each of the channels it viewed.
The season report shows the total number of unique SVM clients that viewed video for each of the past events, regardless of channel watched. Hence each unique client is counted once per event only.
1. A group of 20 clients (A) watch the in-house channel for the entire game.
2. A second group of 10 clients (B) watch the in-house channel for the first half. At half time they switch to ESPN. And right before the start of the 2nd half all 10 clients are turned off.
3. A third group of 5 clients (C) show up during the second half, and watch ESPN for the remainder of the game.
As a result the event report shows 30 unique viewers for the in-house channel, and 15 unique viewers for ESPN. The season report shows 35 unique viewers for the event.
Total Video Viewing Time
Figure 9 Total Video Viewing Time
The event report shows the total duration that each channel was viewed during a specific event. This is calculated by summing up the number of minutes watched by each of the clients that tuned to this channel. It makes no difference if a client watched a channel once for 30 minutes or twice for 15 minutes.
The season report shows the total number of minutes of video viewed across all channels, broken down by event. This aggregate number is a simple summation of the minutes recorded for each individual channel for that event.
1. A group of 20 clients (A) watch the in-house channel for 10 minutes each.
2. A second group of 10 clients (B) watch the in-house channel for 20 minutes each. The same clients also watch ESPN for 10 minutes each.
As a result the event report shows the in-house channel being watched for 400 minutes, and the ESPN channel being watched for 100 minutes. The season report shows that a total of 500 minutes was watched during this event.
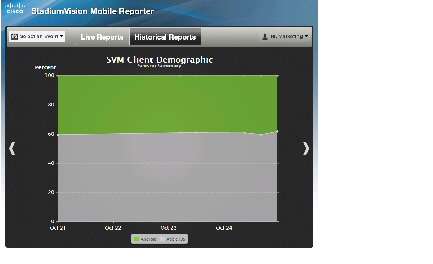
SVM Client Demographic
Figure 10 SVM Client Demographic Report
The event report shows the total number of unique Google Android and Apple iOS clients that used the SVM client app at some point during the event. This includes devices that never tuned to a channel to watch video. The fact that the SVM client was launched, and briefly ran in the foreground, is sufficient for that client to be recorded. Hence the client demographic count is likely to be higher than that shown for the same event on the 'Unique Video Viewers' season.
1. A group of 20 Apple iOS clients (A) watch the in-house channel during the first half.
2. A group of 15 Google Android clients (B) watch the in-house channel during the second half.
3. A group of 10 Apple iOS clients (C) use the SVM enabled app for in seat ordering only. They never tune to any of the video channels.
4. A group of 5 Google Android clients (D) use the SVM enabled app for way finding only. They never tune to any of the video channels.
As a result the event report shows 30 unique Apple iOS clients and 20 unique Google Android clients. The season report also shows 30 Apple iOS and 20 Google Android clients for this event.
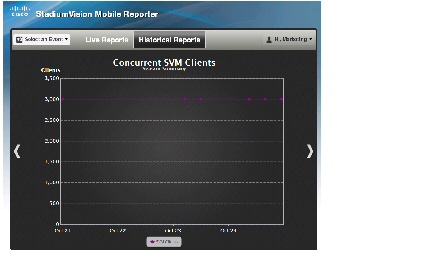
Concurrent SVM Clients
Figure 11 Concurrent SVM Clients Report
The event report shows the number of SVM clients that were active at the same time (concurrently) over the course of the event. This includes clients that are not tuned to a video channel. The fact that the SVM client is launched, and running in the foreground, is sufficient for that client to be recorded. Hence the concurrent SVM client count reported here is likely to be higher than that shown for the same event on the 'Peak Video Viewers' season report.
1. A group of 20 clients (A) were watching the in-house channel at 5:13 PM.
2. A group of 10 clients (B) were using the SVM enabled app for in seat ordering at 5:13 PM. Hence it is a given that they were not also watching video at that time.
3. The time of peak SVM activity is at 6:03 PM, when there are a total of 100 concurrently active SVM clients, including groups A and B.
As a result the event report shows 30 active clients at 5:13 PM. The season report captures the peak value of the event chart, which in this case is 100 concurrent clients.
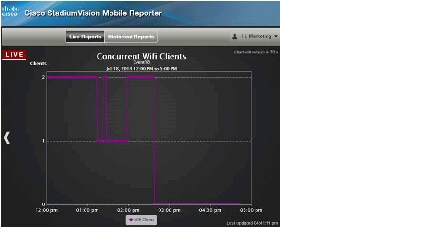
Concurrent WiFi Clients
Figure 12 Concurrent WiFi Clients Report
Maintenance Window
Event and Season reports begin generation at 3:00 a.m. by default. If an event occurs at 10:00 p.m., the reports will be available after the 3:00 a.m. generation cycle.
Note The Cisco StadiumVision Mobile Reporter performs maintenance from 3:00 a.m. to 6:00 a.m. Do not schedule events to run during the maintenance window.


 Feedback