Designed for workloads that demand high-reliability, intensive compute operations with low management costs.
Eight 2nd Gen Intel Xeon Scalable processors
Up to 224 cores
Up to 36 TB of memory with Intel Optane PMem
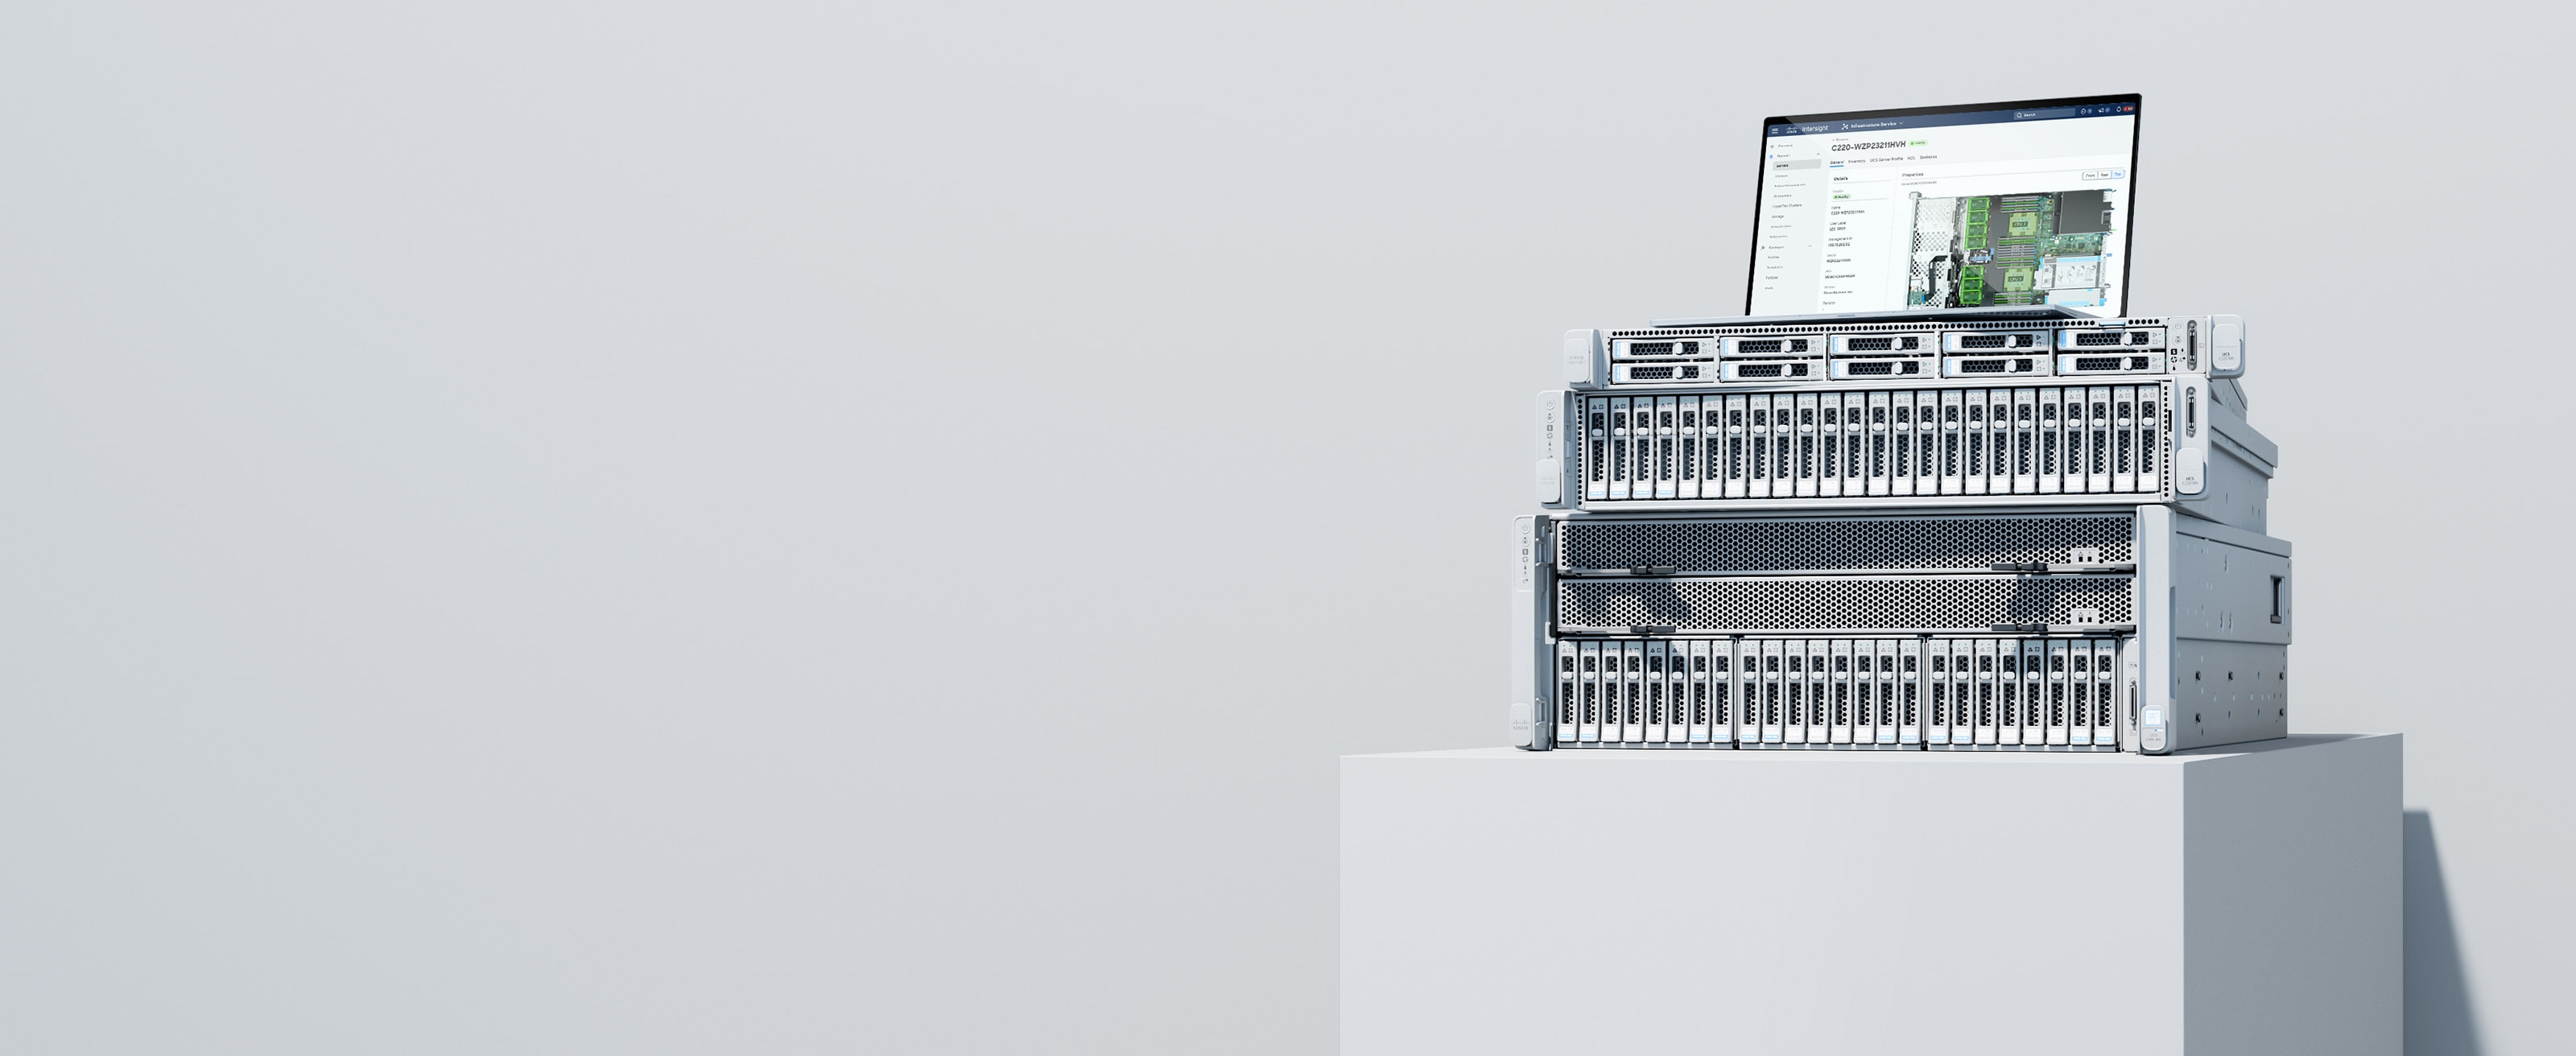
An easier way to manage your IT infrastructure
Simplify and automate operations across your entire infrastructure from one place with Cisco Intersight. Then, no matter where you are, you can focus on where you're needed most.