Switch(config)#ip nbar custom MYDOMAIN composite server-name *mydomain.com id 13
Konfiguration und Überprüfung von NetFlow, AVC und ETA auf Catalyst Switches der Serie 9000
Download-Optionen
-
ePub (383.8 KB)
In verschiedenen Apps auf iPhone, iPad, Android, Sony Reader oder Windows Phone anzeigen
Aktualisiert:13. November 2025
Dokument-ID:218311
Inklusive Sprache
In dem Dokumentationssatz für dieses Produkt wird die Verwendung inklusiver Sprache angestrebt. Für die Zwecke dieses Dokumentationssatzes wird Sprache als „inklusiv“ verstanden, wenn sie keine Diskriminierung aufgrund von Alter, körperlicher und/oder geistiger Behinderung, Geschlechtszugehörigkeit und -identität, ethnischer Identität, sexueller Orientierung, sozioökonomischem Status und Intersektionalität impliziert. Dennoch können in der Dokumentation stilistische Abweichungen von diesem Bemühen auftreten, wenn Text verwendet wird, der in Benutzeroberflächen der Produktsoftware fest codiert ist, auf RFP-Dokumentation basiert oder von einem genannten Drittanbieterprodukt verwendet wird. Hier erfahren Sie mehr darüber, wie Cisco inklusive Sprache verwendet.
Informationen zu dieser Übersetzung
Cisco hat dieses Dokument maschinell übersetzen und von einem menschlichen Übersetzer editieren und korrigieren lassen, um unseren Benutzern auf der ganzen Welt Support-Inhalte in ihrer eigenen Sprache zu bieten. Bitte beachten Sie, dass selbst die beste maschinelle Übersetzung nicht so genau ist wie eine von einem professionellen Übersetzer angefertigte. Cisco Systems, Inc. übernimmt keine Haftung für die Richtigkeit dieser Übersetzungen und empfiehlt, immer das englische Originaldokument (siehe bereitgestellter Link) heranzuziehen.
Inhalt
Einleitung
In diesem Dokument wird beschrieben, wie NetFlow, Application Visibility and Control (AVC) und Encrypted Traffic Analytics (ETA) konfiguriert und validiert werden.
Voraussetzungen
Anforderungen
Cisco empfiehlt, dass Sie über Kenntnisse in folgenden Bereichen verfügen:
- NetFlow
- AVC
- ETA
Verwendete Komponenten
Die Informationen in diesem Dokument basieren auf einem Catalyst Switch der Serie 9300, auf dem die Cisco IOS® XE Software 16.12.4 ausgeführt wird.
Die Informationen in diesem Dokument beziehen sich auf Geräte in einer speziell eingerichteten Testumgebung. Alle Geräte, die in diesem Dokument benutzt wurden, begannen mit einer gelöschten (Nichterfüllungs) Konfiguration. Wenn Ihr Netzwerk in Betrieb ist, stellen Sie sicher, dass Sie die möglichen Auswirkungen aller Befehle kennen.
Verwandte Produkte
Dieses Dokument kann auch mit folgenden Hardware- und Softwareversionen verwendet werden:
- 9200 (unterstützt nur NetFlow und AVC)
- 9300 (unterstützt NetFlow, AVC und ETA)
- 9400 (unterstützt NetFlow, AVC und ETA)
- 9500 (unterstützt nur NetFlow und AVC)
- 9600 (unterstützt nur NetFlow und AVC)
- Cisco IOS XE 16.12 und höher
Hintergrundinformationen
- Flexible NetFlow ist die Flow-Technologie der nächsten Generation, die Daten erfasst und misst, damit alle Router oder Switches im Netzwerk zu einer Quelle für Telemetrie werden können.
- Flexible NetFlow ermöglicht extrem detaillierte und präzise Messungen des Datenverkehrs und eine umfassende Sammlung von aggregiertem Datenverkehr.
- Flexible NetFlow verwendet Datenflüsse, um Statistiken für die Abrechnung, die Netzwerküberwachung und die Netzwerkplanung bereitzustellen.
- Ein Flow ist ein unidirektionaler Strom von Paketen, der an einer Quellschnittstelle ankommt und dieselben Werte für die Schlüssel hat. Ein Schlüssel ist ein identifizierter Wert für ein Feld innerhalb des Pakets. Sie erstellen einen Flow über einen Flow-Datensatz, um die eindeutigen Schlüssel für Ihren Flow zu definieren.
Anmerkung: Plattformbefehle können variieren. Befehl kann show platform fed show platform fed switch oder umgekehrt sein. Wenn die in den Beispielen angegebene Syntax nicht analysiert wird, versuchen Sie es mit der Variante.
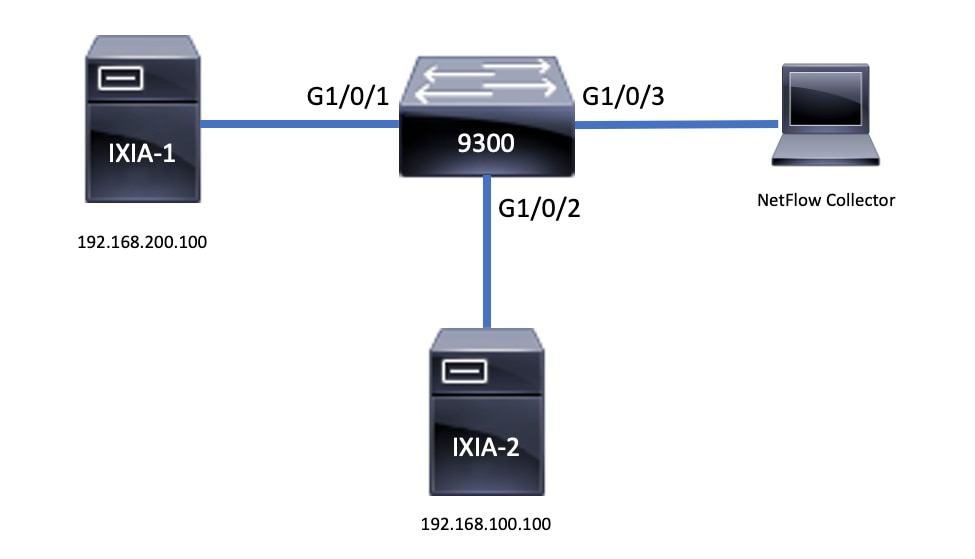
Netzwerkdiagramm
Konfigurieren
Komponenten
Die NetFlow-Konfiguration besteht aus drei Hauptkomponenten, die zusammen verwendet werden können. Es gibt mehrere Varianten, um Datenverkehrsanalysen und Datenexporte durchzuführen.
Flow-Datensatz
- Ein Datensatz ist eine Kombination aus Schlüssel- und Nicht-Schlüsselfeldern. Flexible NetFlow-Datensätze werden Flexible NetFlow-Überwachungen zugewiesen, um den Cache zu definieren, der zum Speichern von Flow-Daten verwendet wird.
- Flexible NetFlow umfasst mehrere vordefinierte Datensätze, die zur Überwachung des Datenverkehrs verwendet werden können.
- Flexible NetFlow ermöglicht darüber hinaus die Definition benutzerdefinierter Datensätze für einen flexiblen NetFlow-Datenflussmonitor-Cache durch die Angabe von Schlüssel- und Nicht-Schlüsselfeldern, um die Datenerfassung an Ihre spezifischen Anforderungen anzupassen.
Wie im Beispiel gezeigt, Details zur Flussdatensatz-Konfiguration:
flow record TAC-RECORD-IN
match flow direction
match ipv4 source address
match interface input
match ipv4 destination address
match ipv4 protocol
collect counter packets long
collect counter bytes long
collect timestamp absolute last
collect transport tcp flags

flow record TAC-RECORD-OUT
match flow direction
match interface output
match ipv4 source address
match ipv4 destination address
match ipv4 protocol
collect counter packets long
collect counter bytes long
collect timestamp absolute last
collect transport tcp flags
Flow Exporter
- Flow Exporter werden verwendet, um die Daten im Flow Monitor Cache zur Analyse und Speicherung in ein Remote-System (Server, der als NetFlow Collector fungiert) zu exportieren.
- Flow-Exporteure werden Flow-Monitoren zugewiesen, um Datenexportfunktionen für die Flow-Monitore bereitzustellen.
Wie im Beispiel gezeigt, Details zur Flow Exporter-Konfiguration:
flow exporter TAC-EXPORT
destination 192.168.69.2
source Vlan69
Datenflussüberwachung
- Datenflussmonitore sind die Flexible NetFlow-Komponente, die auf Schnittstellen angewendet wird, um die Überwachung des Netzwerkverkehrs durchzuführen.
- Flow-Daten werden aus dem Netzwerkverkehr gesammelt und dem Flow Monitor-Cache hinzugefügt, während der Prozess ausgeführt wird. Der Prozess basiert auf den Schlüssel- und Nicht-Schlüsselfeldern im Flow Record.
Wie im Beispiel gezeigt, werden Konfigurationsdetails für den Flussmonitor angezeigt:
flow monitor TAC-MONITOR-IN
exporter TAC-EXPORT
record TAC-RECORD-IN

flow monitor TAC-MONITOR-OUT
exporter TAC-EXPORT
record TAC-RECORD-OUT

Switch#show run int g1/0/1
Building configuration...

Current configuration : 185 bytes
!
interface GigabitEthernet1/0/1
switchport access vlan 42
switchport mode access
ip flow monitor TAC-MONITOR-IN input
ip flow monitor TAC-MONITOR-OUT output
load-interval 30
end
Flow Sampler (optional)
- Flow Sampler werden als separate Komponenten in einer Router-Konfiguration erstellt.
- Flow-Sampler begrenzen die Anzahl der Pakete, die zur Analyse ausgewählt werden, um die Last auf dem Gerät zu reduzieren, das Flexible NetFlow verwendet.
- Flow-Sampler dienen dazu, die Last auf dem Gerät zu reduzieren, das Flexible NetFlow verwendet. Diese Last wird durch die Begrenzung der Anzahl an Paketen erreicht, die für die Analyse ausgewählt werden.
- Flow Sampler tauschen Genauigkeit für Router-Leistung aus. Bei einer Verringerung der Anzahl von Paketen, die vom Flow Monitor analysiert werden, kann sich dies auf die Genauigkeit der im Flow Monitor-Cache gespeicherten Informationen auswirken.
Wie im Beispiel gezeigt, Konfiguration des Flow-Samplers:
sampler SAMPLE-TAC
description Sample at 50%
mode random 1 out-of 2

Switch(config)#interface GigabitEthernet1/0/1
Switch(config-if)#ip flow monitor TAC-MONITOR-IN sampler SAMPLE-TAC input
Switch(config-if)#end
Einschränkungen
- Für Flexible NetFlow ist eine Cisco DNA Addon-Lizenz erforderlich, ansonsten steht Sampled NetFlow nur zur Verfügung.
- Flow-Exporteure können den Management-Port nicht als Quelle verwenden.
Dies ist keine vollständige Liste. Informationen zur entsprechenden Plattform und zum entsprechenden Code finden Sie im Konfigurationsleitfaden.
Überprüfung
Plattformunabhängige Überprüfung
Überprüfen Sie die Konfiguration, und vergewissern Sie sich, dass die erforderlichen NetFlow-Komponenten vorhanden sind:
- Flow-Datensatz
- Flow Exporter
- Datenflussüberwachung
- Flow Sampler (optional)
Tipp: Führen Sie einen Befehl aus, um die Flussdatensätze, den Flow-Exporter und die Flussüberwachungsausgabe in einem Befehl anzuzeigen show running-config flow monitor .
Wie im Beispiel gezeigt, hat sich der Flussmonitor an die Eingangsrichtung und die zugehörigen Komponenten gebunden:
Switch#show running-config flow monitor TAC-MONITOR-IN expand
Current configuration:
!
flow record TAC-RECORD-IN
 match ipv4 protocol
 match ipv4 source address
 match ipv4 destination address
 match interface input
 match flow direction
 collect transport tcp flags
 collect counter bytes long
 collect counter packets long
 collect timestamp absolute last
!
flow exporter TAC-EXPORT
 destination 192.168.69.2
 source Vlan69
!
flow monitor TAC-MONITOR-IN
 exporter TAC-EXPORT
 record TAC-RECORD-IN
!
Wie im Beispiel gezeigt, hat sich der Flussmonitor an die Ausgaberichtung und die zugehörigen Komponenten gebunden:
Switch#show run flow monitor TAC-MONITOR-OUT expand
Current configuration:
!
flow record TAC-RECORD-OUT
 match ipv4 protocol
 match ipv4 source address
 match ipv4 destination address
 match interface output
 match flow direction
 collect transport tcp flags
 collect counter bytes long
 collect counter packets long
 collect timestamp absolute last
!
flow exporter TAC-EXPORT
 destination 192.168.69.2
 source Vlan69
!
flow monitor TAC-MONITOR-OUT
 exporter TAC-EXPORT
 record TAC-RECORD-OUT
!
Führen Sie den Befehl show flow monitor aus. Diese Ausgabe ist hilfreich, um zu bestätigen, dass Daten aufgezeichnet werden:
Switch#show flow monitor TAC-MONITOR-IN statistics
  Cache type:                               Normal (Platform cache)
  Cache size:                                10000
  Current entries:                               1

  Flows added:                                   1
  Flows aged:                                    0
Führen Sie den Befehl aus, show flow monitor um sicherzustellen, dass der NetFlow-Cache ausgegeben wurde:
Switch#show flow monitor TAC-MONITOR-IN cache
  Cache type:                               Normal (Platform cache)
  Cache size:                                10000
  Current entries:                               1

  Flows added:                                   1
  Flows aged:                                    0

IPV4 SOURCE ADDRESS:       192.168.200.100
IPV4 DESTINATION ADDRESS:  192.168.100.100
INTERFACE INPUT:           Gi1/0/1
FLOW DIRECTION:            Input
IP PROTOCOL:               17
tcp flags:                 0x00
counter bytes long:        4606617470
counter packets long:      25311085
timestamp abs last:        22:44:48.579
Führen Sie den Befehl aus, show flow exporter um zu bestätigen, dass der Exporteur Pakete gesendet hat:
Switch#show flow exporter TAC-EXPORT statistics
Flow Exporter TAC-EXPORT:
  Packet send statistics (last cleared 00:08:38 ago):
    Successfully sent:         2                     (24 bytes)

  Client send statistics:
    Client: Flow Monitor TAC-MONITOR-IN
      Records added:           0
      Bytes added:             12
        - sent:                12

    Client: Flow Monitor TAC-MONITOR-OUT
      Records added:           0
      Bytes added:             12
        - sent:                12
Plattformabhängige Überprüfung
NetFlow-Initialisierung - NFL-Partitionstabelle
- NetFlow-Partitionen werden für verschiedene Funktionen mit 16 Partitionen pro Richtung initialisiert (Eingang/Ausgang).
- Die Konfiguration der NetFlow-Partitionstabelle wird in die globale Bankzuweisung unterteilt, die wiederum in die Eingangs- und Ausgangsdatenbanken unterteilt wird.
Schlüsselfelder
- Anzahl der Partitionen
- Aktivierungsstatus der Partition
- Partitionsgrenze
- Aktuelle Partitionsnutzung
Um die NetFlow-Partitionstabelle anzuzeigen, können Sie den Befehl show platform software fed switch active|standby|member| fnf sw-table-sizes asic ausführen.
Anmerkung: Erstellte Datenflüsse sind Switch- und Core-spezifisch, wenn sie erstellt werden. Die Switch-Nummer (aktiv, Standby usw.) muss entsprechend angegeben werden. Die eingegebene ASIC-Nummer ist mit der jeweiligen Schnittstelle verknüpft. Verwenden Sie diese, show platform software fed switch active|standby|member ifm mappings um den ASIC zu ermitteln, der der Schnittstelle entspricht. Verwenden Sie für die Schattenoption immer 0.
Switch#show platform software fed switch active fnf sw-table-sizes asic 0 shadow 0

---------------------------------
     Global Bank Allocation
---------------------------------
Ingress Banks : Bank 0 Bank 1
Egress Banks  : Bank 2 Bank 3
---------------------------------
    Global flow table Info                                   <--- Provides the number of entries used per direction
INGRESS    usedBankEntry           0  usedOvfTcamEntry     0
 EGRESS    usedBankEntry           0  usedOvfTcamEntry     0
---------------------------------
    Flows Statistics
INGRESS    TotalSeen=0 MaxEntries=0 MaxOverflow=0
EGRESS     TotalSeen=0 MaxEntries=0 MaxOverflow=0

---------------------------------
       Partition Table
---------------------------------
## Dir  Limit  CurrFlowCount  OverFlowCount  MonitoringEnabled
 0 ING      0          0               0           0
 1 ING  16640          0               0           1          <-- Current flow count in hardware
 2 ING      0          0               0           0
 3 ING  16640          0               0           0
 4 ING      0          0               0           0
 5 ING   8192          0               0           1
 6 ING      0          0               0           0
 7 ING      0          0               0           0
 8 ING      0          0               0           0
 9 ING      0          0               0           0
10 ING      0          0               0           0
11 ING      0          0               0           0
12 ING      0          0               0           0
13 ING      0          0               0           0
14 ING      0          0               0           0
15 ING      0          0               0           0
 0 EGR      0          0               0           0
 1 EGR  16640          0               0           1          <-- Current flow count in hardware
 2 EGR      0          0               0           0
 3 EGR  16640          0               0           0
 4 EGR      0          0               0           0
 5 EGR   8192          0               0           1
 6 EGR      0          0               0           0
 7 EGR      0          0               0           0
 8 EGR      0          0               0           0
 9 EGR      0          0               0           0
10 EGR      0          0               0           0
11 EGR      0          0               0           0
12 EGR      0          0               0           0
13 EGR      0          0               0           0
14 EGR      0          0               0           0
15 EGR      0          0               0           0
Datenflussüberwachung
Die Konfiguration des Datenflussmonitors umfasst Folgendes:
1. NetFlow-ACL-Konfiguration, die zur Erstellung eines Eintrags in der ACL-TCAM-Tabelle führt.
Der ACL TCAM-Eintrag umfasst:
- Übereinstimmende Schlüssel suchen
- Für die NetFlow-Suche verwendete Ergebnisparameter, einschließlich der folgenden:
- Profil-ID
- NetFlow-ID
2. Konfiguration der Flow-Maske, wodurch ein Eintrag in NflLookupTable und NflFlowMaskTable erstellt wird.
- Indiziert durch NetFlow-ACL-Ergebnisparameter zum Auffinden der Datenflussmaske für die NetFlow-Suche
NetFlow-ACL
Führen Sie den Befehl aus, um die NetFlow ACL-Konfiguration anzuzeigen show platform hardware fed switch active fwd-asic resource tcam table nfl_acl asic .
Tipp: Wenn eine Port-ACL (PACL) vorhanden ist, wird der Eintrag auf dem ASIC erstellt, dem die Schnittstelle zugeordnet ist. Bei einer Router-ACL (RACL) ist der Eintrag auf allen ASICs vorhanden.
- In dieser Ausgabe gibt es NFCMD0 und NFCMD1, die 4 Bit-Werte sind. Um die Profil-ID zu berechnen, konvertieren Sie die Werte in binär.
- In dieser Ausgabe ist NFCMD0 gleich 1, NFCMD1 gleich 2. Bei der Konvertierung in eine Binärdatei: 000100010
- In Cisco IOS XE 16.12 und höher ist innerhalb der kombinierten 8 Bit die erste 4 Bit die Profil-ID, und die 7. Bit gibt an, dass die Suche aktiviert ist. Im Beispiel 00010010 ist die Profil-ID 1.
- In Cisco IOS XE 16.11 und älteren Codeversionen sind innerhalb der kombinierten 8 Bit die ersten 6 Bit die Profil-ID, und das 7. Bit zeigt an, dass die Suche aktiviert ist. In diesem Beispiel, 00010010, ist die Profil-ID 4.
Switch#show platform hardware fed switch active fwd-asic resource tcam table nfl_acl asic 0
Printing entries for region INGRESS_NFL_ACL_CONTROL (308) type 6 asic 0
========================================================
Printing entries for region INGRESS_NFL_ACL_GACL (309) type 6 asic 0
========================================================
Printing entries for region INGRESS_NFL_ACL_PACL (310) type 6 asic 0
========================================================
TAQ-2 Index-32 (A:0,C:0) Valid StartF-1 StartA-1 SkipF-0 SkipA-0
Input IPv4 NFL PACL

Labels  Port   Vlan   L3If   Group
M:      00ff   0000   0000   0000
V:      0001   0000   0000   0000

   vcuResults l3Len l3Pro l3Tos SrcAddr  DstAddr  mtrid vrfid  SH
M:  00000000   0000  00    00  00000000 00000000  00   0000   0000
V:  00000000   0000  00    00  00000000 00000000  00   0000   0000

   RMAC RA MEn IPOPT MF NFF DF SO DPT TM DSEn  l3m
M:  0    0  0    0    0  0   0  0  0   0  0  0
V:  0    0  0    0    0  0   0  0  0   0  0  0

   SrcPort DstPortIITypeCode TCPFlags TTL ISBM QosLabel ReQOS S_P2P D_P2P
M:  0000    0000              00    00    0000    00      0     0     0
V:  0000    0000              00    00    0000    00      0     0     0

   SgEn SgLabel    AuthBehaviorTag  l2srcMiss  l2dstMiss ipTtl SgaclDeny
M:  0    000000    0  0   0 0     0
V:  0    000000    0  0   0 0     0

NFCMD0 NFCMD1 SMPLR LKP1 LKP2 PID QOSPRI MQLBL MPLPRO LUT0PRI CPUCOPY
     1      2     0    1    0   0      0     0      0 0x0000f       0
Start/Skip Word: 0x00000003
Start Feature, Terminate

-----------------------------------------
Printing entries for region INGRESS_NFL_ACL_VACL (311) type 6 asic 0
========================================================
Printing entries for region INGRESS_NFL_ACL_RACL (312) type 6 asic 0
========================================================
Printing entries for region INGRESS_NFL_ACL_SSID (313) type 6 asic 0
========================================================
Printing entries for region INGRESS_NFL_CATCHALL (314) type 6 asic 0
========================================================
TAQ-2 Index-224 (A:0,C:0) Valid StartF-1 StartA-1 SkipF-0 SkipA-0
Input IPv4 NFL RACL

Labels  Port   Vlan   L3If   Group
M:      0000   0000   0000   0000
V:      0000   0000   0000   0000

   vcuResults l3Len l3Pro l3Tos SrcAddr  DstAddr  mtrid vrfid  SH
M:  00000000   0000  00    00  00000000 00000000  00   0000   0000
V:  00000000   0000  00    00  00000000 00000000  00   0000   0000

   RMAC RA MEn IPOPT MF NFF DF SO DPT TM DSEn  l3m
M:  0    0  0    0    0  0   0  0  0   0  0  0
V:  0    0  0    0    0  0   0  0  0   0  0  0

   SrcPort DstPortIITypeCode TCPFlags TTL ISBM QosLabel ReQOS S_P2P D_P2P
M:  0000    0000              00    00    0000    00      0     0     0
V:  0000    0000              00    00    0000    00      0     0     0

   SgEn SgLabel    AuthBehaviorTag  l2srcMiss  l2dstMiss ipTtl SgaclDeny
M:  0    000000    0  0   0 0     0
V:  0    000000    0  0   0 0     0

NFCMD0 NFCMD1 SMPLR LKP1 LKP2 PID QOSPRI MQLBL MPLPRO LUT0PRI CPUCOPY
     0      0     0    0    0   0      0     0      0 0x00000       0
Start/Skip Word: 0x00000003
Start Feature, Terminate

-----------------------------------------
TAQ-2 Index-225 (A:0,C:0) Valid StartF-0 StartA-0 SkipF-0 SkipA-0
Input IPv4 NFL PACL

Labels  Port   Vlan   L3If   Group
M:      0000   0000   0000   0000
V:      0000   0000   0000   0000

   vcuResults l3Len l3Pro l3Tos SrcAddr  DstAddr  mtrid vrfid  SH
M:  00000000   0000  00    00  00000000 00000000  00   0000   0000
V:  00000000   0000  00    00  00000000 00000000  00   0000   0000

   RMAC RA MEn IPOPT MF NFF DF SO DPT TM DSEn  l3m
M:  0    0  0    0    0  0   0  0  0   0  0  0
V:  0    0  0    0    0  0   0  0  0   0  0  0

   SrcPort DstPortIITypeCode TCPFlags TTL ISBM QosLabel ReQOS S_P2P D_P2P
M:  0000    0000              00    00    0000    00      0     0     0
V:  0000    0000              00    00    0000    00      0     0     0

   SgEn SgLabel    AuthBehaviorTag  l2srcMiss  l2dstMiss ipTtl SgaclDeny
M:  0    000000    0  0   0 0     0
V:  0    000000    0  0   0 0     0

NFCMD0 NFCMD1 SMPLR LKP1 LKP2 PID QOSPRI MQLBL MPLPRO LUT0PRI CPUCOPY
     0      0     0    0    0   0      0     0      0 0x00000       0
Start/Skip Word: 0x00000000
No Start, Terminate

-----------------------------------------
TAQ-2 Index-226 (A:0,C:0) Valid StartF-0 StartA-0 SkipF-0 SkipA-0
Input IPv6 NFL PACL

Labels  Port   Vlan   L3If   Group
Mask    0x0000 0x0000 0x0000 0x0000
Value   0x0000 0x0000 0x0000 0x0000

vcuResult dstAddr0 dstAddr1 dstAddr2 dstAddr3 srcAddr0
00000000  00000000 00000000 00000000 00000000 00000000
00000000  00000000 00000000 00000000 00000000 00000000

srcAddr1 srcAddr2 srcAddr3 TC HL l3Len fLabel vrfId toUs
00000000 00000000 00000000 00 00  0000  00000  000   0
00000000 00000000 00000000 00 00  0000  00000  000   0

l3Pro mtrId AE FE RE HE MF NFF SO IPOPT RA MEn RMAC DPT TMP l3m
 00    00   0  0  0  0  0   0  0    0   0   0   0    0   0    0
 00    00   0  0  0  0  0   0  0    0   0   0   0    0   0    0

DSE srcPort dstPortIITypeCode tcpFlags IIPresent cZId dstZId
 0   0000    0000      00      00     00     00
 0   0000    0000      00      00     00     00

v6RT AH ESP mREn ReQOS QosLabel PRole VRole  AuthBehaviorTag
M: 0   0   0    0    0      00         0     0 0
V: 0   0   0    0    0      00         0     0 0

   SgEn SgLabel
M:  0    000000
V:  0    000000

NFCMD0 NFCMD1 SMPLR LKP1 LKP2 PID QOSPRI MQLBL MPLPRO LUT0PRI CPUCOPY
     0      0     0    0    0   0      0     0      0 0x00000       0
Start/Skip Word: 0x00000000
No Start, Terminate

-----------------------------------------
TAQ-2 Index-228 (A:0,C:0) Valid StartF-0 StartA-0 SkipF-0 SkipA-0
conversion to string vmr l2p not supported
-----------------------------------------
TAQ-2 Index-230 (A:0,C:0) Valid StartF-0 StartA-0 SkipF-0 SkipA-0
Input MAC NFL PACL

Labels  Port   Vlan   L3If   Group
M:      0000   0000   0000   0000
V:      0000   0000   0000   0000

   arpSrcHwAddr  arpDestHwAddr  arpSrcIpAddr  arpTargetIp  arpOperation
M: 000000000000  000000000000   00000000       00000000     0000
V: 000000000000  000000000000   00000000       00000000     0000


   TRUST  SNOOP  SVALID  DVALID
M:    0     0      0      0
V:    0     0      0      0


   arpHardwareLength  arpHardwareType  arpProtocolLength  arpProtocolType
M:   00000000          00000000            00000000          00000000
V:   00000000          00000000            00000000          00000000


   VlanId l2Encap l2Protocol cosCFI   srcMAC      dstMAC    ISBM  QosLabel
M:  000    0        0000     0     000000000000 000000000000 00     00
V:  000    0        0000     0     000000000000 000000000000 00     00


  ReQOS isSnap  isLLC  AuthBehaviorTag
M:  0     0      0       0
V:  0     0      0        0

NFCMD0 NFCMD1 SMPLR LKP1 LKP2 PID QOSPRI MQLBL MPLPRO LUT0PRI CPUCOPY
     0      0     0    0    0   0      0     0      0 0x00000       0
Start/Skip Word: 0x00000000
No Start, Terminate

-----------------------------------------
Datenflussmaske
Führen Sie den Befehl aus, um anzuzeigen,show platform software fed switch active|standby|member fnf fmask-entry asic dass die Datenflussmaske in der Hardware installiert ist. Die Anzahl der Schlüsselfelder finden Sie auch hier.
Switch#show platform software fed switch active fnf fmask-entry asic 1 entry 1

---------------------------------
mask0_valid : 1
Mask hdl0   : 1
Profile ID  : 0
Feature 0   : 148
Fmsk0 RefCnt: 1
Mask M1     :
[511:256] => :00000000 00000000 00000000 00000000 00000000 00000000 00000000 00000000
[255:000] => :FFFFFFFF 00000000 FFFFFFFF 03FF0000 00000000 00FF0000 00000000 C00000FF

Mask M2     :

Key Map     :

Source   Field-Id   Size   NumPFields   Pfields
 002       090       04        01       (0 1 1 1)
 002       091       04        01       (0 1 1 0)
 002       000       01        01       (0 1 0 7)
 000       056       08        01       (0 0 2 4)
 001       011       11        04       (0 0 0 1) (0 0 0 0) (0 1 0 6) (0 0 2 0)
 000       067       32        01       (0 1 12 0)
 000       068       32        01       (0 1 12 2)
Flussstatistiken und Zeitstempel-Offload-Daten
Führen Sie den Befehl show platform software fed switch active fnf flow-record asic aus, um NetFlow-Statistiken und Zeitstempel anzuzeigen.
Switch#show platform software fed switch active fnf flow-record asic 1 start-index 1 num-flows 1
1 flows starting at 1 for asic 1:-------------------------------------------------
Idx 996 :
{90, ALR_INGRESS_NET_FLOW_ACL_LOOKUP_TYPE1 = 0x01}
{91, ALR_INGRESS_NET_FLOW_ACL_LOOKUP_TYPE2 = 0x01}
{0, ALR_INGRESS_NFL_SPECIAL1 = 0x00}
{56, PHF_INGRESS_L3_PROTOCOL = 0x11}
{11 PAD-UNK = 0x0000}
{67, PHF_INGRESS_IPV4_DEST_ADDRESS = 0xc0a86464}
{68, PHF_INGRESS_IPV4_SRC_ADDRESS = 0xc0a8c864}
FirstSeen = 0x4b2f, LastSeen = 0x4c59, sysUptime = 0x4c9d
PKT Count = 0x000000000102d5df, L2ByteCount = 0x00000000ca371638


Switch#show platform software fed switch active fnf flow-record asic 1 start-index 1 num-flows 1
1 flows starting at 1 for asic 1:-------------------------------------------------
Idx 996 :
{90, ALR_INGRESS_NET_FLOW_ACL_LOOKUP_TYPE1 = 0x01}
{91, ALR_INGRESS_NET_FLOW_ACL_LOOKUP_TYPE2 = 0x01}
{0, ALR_INGRESS_NFL_SPECIAL1 = 0x00}
{56, PHF_INGRESS_L3_PROTOCOL = 0x11}
{11 PAD-UNK = 0x0000}
{67, PHF_INGRESS_IPV4_DEST_ADDRESS = 0xc0a86464}
{68, PHF_INGRESS_IPV4_SRC_ADDRESS = 0xc0a8c864}
FirstSeen = 0x4b2f, LastSeen = 0x4c5b, sysUptime = 0x4c9f
PKT Count = 0x0000000001050682, L2ByteCount = 0x00000000cbed1590
Application Visibility and Control (AVC)
Hintergrundinformationen
- Application Visibility and Control (AVC) ist eine Lösung, die Network-Based Recognition Version 2 (NBAR2), NetFlow V9 und verschiedene Berichts- und Verwaltungstools (Cisco Prime) nutzt, um Anwendungen mittels Deep Packet Inspection (DPI) zu klassifizieren.
- AVC kann für kabelgebundene Access Ports für Standalone-Switches oder Switch-Stacks konfiguriert werden.
- AVC kann auch auf Cisco Wireless-Controllern verwendet werden, um Anwendungen anhand von DPI zu identifizieren und sie dann mit einem bestimmten DSCP-Wert zu markieren. Darüber hinaus kann es verschiedene Leistungskennzahlen für Wireless-Netzwerke erfassen, z. B. die Bandbreitennutzung von Anwendungen und Clients.
Leistung und Skalierbarkeit
Leistung: Jeder Switch kann 500 Verbindungen pro Sekunde (Connections per Second, CPS) bei einer CPU-Auslastung von weniger als 50 % verarbeiten. Darüber hinaus ist der AVC-Service nicht garantiert.
Skalierung: Verarbeitung von bis zu 5.000 bidirektionalen Datenströmen pro 24 Access-Ports (ca. 200 Datenströme pro Access-Port).
Einschränkungen für kabelgebundene AVCs
- AVC und Encrypted Traffic Analytics (ETA) können nicht gleichzeitig auf derselben Schnittstelle konfiguriert werden.
- Die Paketklassifizierung wird nur für Unicast-IPv4-Datenverkehr (TCP/UDP) unterstützt.
- Die NBAR-basierte QoS-Richtlinienkonfiguration wird nur auf kabelgebundenen physischen Ports unterstützt. Dies umfasst Layer-2-Access- und Trunk-Ports sowie Layer-3-Routing-Ports.
- Die NBAR-basierte QoS-Richtlinienkonfiguration wird für Port-Channel-Mitglieder, Switch Virtual Interfaces (SVIs) oder Subschnittstellen nicht unterstützt.
- NBAR2-basierte Klassifizierungen (Übereinstimmungsprotokoll) unterstützen nur QoS-Aktionen für Marking und Richtlinienvergabe.
- Das Match-Protokoll ist in allen Richtlinien auf 255 verschiedene Protokolle beschränkt (8-Bit-Hardwarebeschränkung).
Anmerkung: Dies ist keine vollständige Liste aller Einschränkungen. Informationen zur Plattform und Codeversion finden Sie im entsprechenden AVC-Konfigurationsleitfaden.
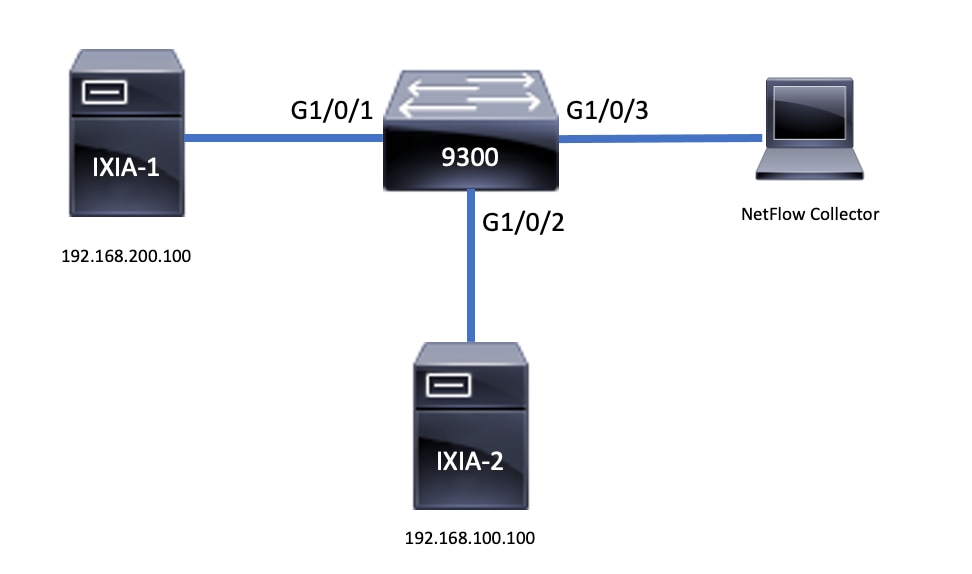
Netzwerkdiagramm
Komponenten
Die AVC-Konfiguration besteht aus drei Hauptkomponenten der Lösung:
Transparenz: Protokollerkennung
- Die Protokollerkennung erfolgt über NBAR und bietet Statistiken nach Schnittstelle, Richtung und Anwendung sowie Bytes/Pakete.
- Die Protokollerkennung wird für eine bestimmte Schnittstelle durch die Schnittstellenkonfiguration aktiviert:
ip nbar protocol-discovery.
Wie in der Ausgabe gezeigt, aktivieren Sie die Protokollerkennung:
Switch(config)#interface fi4/0/5
Switch(config-if)#ip nbar protocol-discovery
Switch(config-if)#exit

Switch#show run int fi4/0/5
Building configuration...

Current configuration : 70 bytes
!
interface FiveGigabitEthernet4/0/5
ip nbar protocol-discovery
end
Steuerung: Anwendungsbasierte QoS
Im Vergleich zu herkömmlicher QoS, die auf IP-Adresse und UDP-/TCP-Port abgestimmt ist, ermöglicht AVC eine feinere Kontrolle durch anwendungsbasierte QoS, sodass eine Übereinstimmung auf der Anwendung möglich ist, und bietet eine feinere Kontrolle durch QoS-Aktionen wie Marking und Richtlinienvergabe.
- Aktionen werden für aggregierten Datenverkehr (nicht pro Datenfluss) durchgeführt.
- Die anwendungsbasierte QoS wird durch die Erstellung einer Klassenzuordnung, die Übereinstimmung eines Protokolls und die anschließende Erstellung einer Richtlinienzuordnung erreicht.
- Die anwendungsbasierte QoS-Richtlinie ist mit einer Schnittstelle verknüpft.
Wie in der Ausgabe gezeigt, Beispielkonfiguration für anwendungsbasierte QoS:
Switch(config)#class-map WEBEX
Switch(config-cmap)#match protocol webex-media
Switch(config)#end

Switch(config)#policy-map WEBEX
Switch(config-pmap)#class WEBEX
Switch(config-pmap-c)#set dscp af41
Switch(config)#end

Switch(config)#interface fi4/0/5
Switch(config-if)#service-policy input WEBEX
Switch(config)#end

Switch#show run int fi4/0/5
Building configuration...

Current configuration : 98 bytes
!
interface FiveGigabitEthernet4/0/5
service-policy input WEBEX
ip nbar protocol-discovery
end
Anwendungsbasiertes Flexible NetFlow
Kabelgebundene AVC FNF unterstützt zwei Typen von vordefinierten Datenflussdatensätzen: ältere bidirektionale Datenflussaufzeichnungen und die neuen direktionalen Datenflussaufzeichnungen.
Bidirektionale Datenflussaufzeichnungen verfolgen die Client-/Server-Anwendungsstatistik.
Wie in der Ausgabe gezeigt, Beispielkonfiguration eines bidirektionalen Flow Record.
Switch(config)#flow record BIDIR-1
Switch(config-flow-record)#match ipv4 version
Switch(config-flow-record)#match ipv4 protocol
Switch(config-flow-record)#match application name
Switch(config-flow-record)#match connection client ipv4 address
Switch(config-flow-record)#match connection server ipv4 address
Switch(config-flow-record)#match connection server transport port
Switch(config-flow-record)#match flow observation point
Switch(config-flow-record)#collect flow direction
Switch(config-flow-record)#collect connection initiator
Switch(config-flow-record)#collect connection new-connections
Switch(config-flow-record)#collect connection client counter packets long
Switch(config-flow-record)#connection client counter bytes network long
Switch(config-flow-record)#collect connection server counter packets long
Switch(config-flow-record)#connection server counter bytes network long
Switch(config-flow-record)#collect timestamp absolute first
Switch(config-flow-record)#collect timestamp absolute last
Switch(config-flow-record)#end

Switch#show flow record BIDIR-1
flow record BIDIR-1:
Description: User defined
No. of users: 0
Total field space: 78 bytes
Fields:
match ipv4 version
match ipv4 protocol
match application name
match connection client ipv4 address
match connection server ipv4 address
match connection server transport port
match flow observation point
collect flow direction
collect timestamp absolute first
collect timestamp absolute last
collect connection initiator
collect connection new-connections
collect connection server counter packets long
collect connection client counter packets long
collect connection server counter bytes network long
collect connection client counter bytes network long
Richtungsaufzeichnungen sind Anwendungsstatistiken für Ein- und Ausgabe.
Wie in der Ausgabe dargestellt, werden Konfigurationsbeispiele für Eingabe- und Ausgabe-Richtungsdatensätze:
Hinweis: Der Befehl match interface input gibt eine Übereinstimmung mit der Eingabeschnittstelle an. Der Befehl match interface output gibt eine Übereinstimmung mit der Ausgabeschnittstelle an. Der Befehl match application name ist für die AVC-Unterstützung obligatorisch.
Switch(config)#flow record APP-IN
Switch(config-flow-record)#match ipv4 version
Switch(config-flow-record)#match ipv4 protocol
Switch(config-flow-record)#match ipv4 source address
Switch(config-flow-record)#match ipv4 destination address
Switch(config-flow-record)#match transport source-port
Switch(config-flow-record)#match transport destination-port
Switch(config-flow-record)#match interface input
Switch(config-flow-record)#match application name
Switch(config-flow-record)#collect interface output
Switch(config-flow-record)#collect counter bytes long
Switch(config-flow-record)#collect counter packets long
Switch(config-flow-record)#collect timestamp absolute first
Switch(config-flow-record)#collect timestamp absolute last
Switch(config-flow-record)#end

Switch#show flow record APP-IN
flow record APP-IN:
Description: User defined
No. of users: 0
Total field space: 58 bytes
Fields:
match ipv4 version
match ipv4 protocol
match ipv4 source address
match ipv4 destination address
match transport source-port
match transport destination-port
match interface input
match application name
collect interface output
collect counter bytes long
collect counter packets long
collect timestamp absolute first
collect timestamp absolute last

Switch(config)#flow record APP-OUT
Switch(config-flow-record)#match ipv4 version
Switch(config-flow-record)#match ipv4 protocol
Switch(config-flow-record)#match ipv4 source address
Switch(config-flow-record)#match ipv4 destination address
Switch(config-flow-record)#match transport source-port
Switch(config-flow-record)#match transport destination-port
Switch(config-flow-record)#match interface output
Switch(config-flow-record)#match application name
Switch(config-flow-record)#collect interface input
Switch(config-flow-record)#collect counter bytes long
Switch(config-flow-record)#collect counter packets long
Switch(config-flow-record)#collect timestamp absolute first
Switch(config-flow-record)#collect timestamp absolute last
Switch(config-flow-record)#end

Switch#show flow record APP-OUT
flow record APP-OUT:
Description: User defined
No. of users: 0
Total field space: 58 bytes
Fields:
match ipv4 version
match ipv4 protocol
match ipv4 source address
match ipv4 destination address
match transport source-port
match transport destination-port
match interface output
match application name
collect interface input
collect counter bytes long
collect counter packets long
collect timestamp absolute first
collect timestamp absolute last
Flow Exporter
Erstellen Sie einen Flow-Exporter, um Exportparameter zu definieren.
Wie in der Ausgabe gezeigt, Beispielkonfiguration des Flow-Exporteurs:
Switch(config)#flow exporter AVC
Switch(config-flow-exporter)#destination 192.168.69.2
Switch(config-flow-exporter)#source vlan69
Switch(config-flow-exporter)#end

Switch#show run flow exporter AVC
Current configuration:
!
flow exporter AVC
destination 192.168.69.2
source Vlan69
!
Datenflussüberwachung
Erstellen Sie einen Flow Monitor, um ihn einem Flow Record zuzuordnen.
Wie in der Ausgabe gezeigt, Beispielkonfiguration des Flussmonitors:
Switch(config)#flow monitor AVC-MONITOR
Switch(config-flow-monitor)#record APP-OUT
Switch(config-flow-monitor)#exporter AVC
Switch(config-flow-monitor)#end

Switch#show run flow monitor AVC-MONITOR
Current configuration:
!
flow monitor AVC-MONITOR
exporter AVC
record APP-OUT
Zuordnen des Datenflussmonitors zu einer Schnittstelle
Sie können bis zu zwei verschiedene AVC-Monitore mit verschiedenen vordefinierten Datensätzen gleichzeitig an eine Schnittstelle anschließen.
Wie in der Ausgabe gezeigt, Beispielkonfiguration des Flussmonitors:
Switch(config)#interface fi4/0/5
Switch(config-if)#ip flow monitor AVC-MONITOR out
Switch(config-if)#end

Switch#show run interface fi4/0/5
Building configuration...
Current configuration : 134 bytes
!
interface FiveGigabitEthernet4/0/5
ip flow monitor AVC-MONITOR output
service-policy input WEBEX
ip nbar protocol-discovery
end
NBAR2
NBAR2 Dynamic Hitless Protocol Pack-Upgrade
Protokollpakete sind Softwarepakete, die die NBAR2-Protokollunterstützung auf einem Gerät aktualisieren, ohne die Cisco Software auf dem Gerät zu ersetzen. Ein Protokollpaket enthält Informationen zu Anwendungen, die offiziell von NBAR2 unterstützt werden und kompiliert und gepackt werden. Für jede Anwendung enthält das Protokollpaket Informationen zu Anwendungssignaturen und Anwendungsattributen. Zu jeder Softwareversion gehört ein integriertes Protokollpaket.
- NBAR2 bietet die Möglichkeit, das Protokollpaket ohne Datenverkehr oder Serviceunterbrechung und ohne Modifizierung des Software-Images auf dem/den Gerät/en zu aktualisieren.
- NBAR2-Protokollpakete können über das Cisco Software Center unter folgender Adresse heruntergeladen werden: NBAR2 Protocol Pack Library.
NBAR2-Protokollpaket-Upgrade
Vor der Installation eines neuen Protokollpakets müssen Sie das Protokollpaket auf allen Switches in den Flash-Speicher kopieren. Um das neue Protokollpaket zu laden, verwenden Sie den Befehl ip nbar protocol-pack flash:.
Sie müssen die Switches nicht neu laden, damit das NBAR2-Upgrade durchgeführt werden kann.
Wie in der Ausgabe gezeigt, Beispielkonfiguration für das Laden des NBAR2-Protokollpakets:
Switch(config)#ip nbar protocol-pack flash:newProtocolPack
Um zum integrierten Protokollpaket zurückzukehren, verwenden Sie den Befehl default ip nbar protocol-pack.
Wie in der Ausgabe gezeigt, Beispielkonfiguration für die Rückkehr zum integrierten Protokollpaket:
Switch(config)#default ip nbar protocol-packNBAR2-Protokollpaketinformationen anzeigen
Verwenden Sie die folgenden Befehle, um Protokollpaketinformationen anzuzeigen:
show ip nbar versionshow ip nbar protocol-pack active detail
Wie in der Ausgabe gezeigt, Beispielausgabe dieser Befehle:
Switch#show ip nbar version
NBAR software version: 37
NBAR minimum backward compatible version: 37
NBAR change ID: 293126

Loaded Protocol Pack(s):
Name: Advanced Protocol Pack
Version: 43.0
Publisher: Cisco Systems Inc.
NBAR Engine Version: 37
State: Active

Switch#show ip nbar protocol-pack active detail
Active Protocol Pack:
Name: Advanced Protocol Pack
Version: 43.0
Publisher: Cisco Systems Inc.
NBAR Engine Version: 37
State: Active
Benutzerdefinierte NBAR2-Anwendungen
NBAR2 unterstützt die Verwendung benutzerdefinierter Protokolle zum Identifizieren benutzerdefinierter Anwendungen. Benutzerdefinierte Protokolle unterstützen Protokolle und Anwendungen, die NBAR2 derzeit nicht unterstützt.
Dazu können gehören:
- Spezifische Anwendung auf eine Organisation
- Geografische Anwendungen
NBAR2 bietet die Möglichkeit, Anwendungen über den Befehl manuell anzupassen ip nbar custom .
Anmerkung: Benutzerdefinierte Anwendungen haben Vorrang vor integrierten Protokollen.
Es gibt verschiedene Arten der Anwendungsanpassung:
Allgemeine Protokollanpassung
- HTTP
- SSL
- DNS
Zusammengesetzt: Anpassung basierend auf mehreren Protokollen - Servername.
Layer3-/Layer4-Anpassung
-
IPv4-Adresse
-
DSCP-Werte
-
TCP-/UDP-Ports
-
Flussquelle oder -zielrichtung
Byte-Offset:Anpassung auf Basis bestimmter Byte-Werte in der Nutzlast
HTTP-Anpassung
Die HTTP-Anpassung kann auf einer Kombination von HTTP-Feldern basieren von:
-
Cookie - HTTP-Cookie
-
host - Hostname des Ursprungsservers, der die Ressource enthält
-
method - HTTP-Methode
-
referrer - Adresse, von der die Ressourcenanforderung abgerufen wurde
-
url - Pfad für Uniform Resource Locator
-
user-agent - Die Software, die vom Agenten verwendet wird, der die Anforderung sendet.
-
Version - HTTP-Version
-
via - HTTP über Feld
Beispiel einer benutzerdefinierten Anwendung mit dem Namen MYHTTP, die den HTTP-Host *mydomain.com mit der Selector-ID 10 verwendet.
Switch(config)#ip nbar custom MYHTTP http host *mydomain.com id 10
SSL-Anpassung
Die Anpassung für SSL-verschlüsselten Datenverkehr kann mithilfe von Informationen erfolgen, die aus der SSL Server Name Indication (SNI) oder dem Common Name (CN) extrahiert werden.
Beispiel für eine benutzerdefinierte Anwendung mit dem Namen MYSSL, die den eindeutigen SSL-Namen mydomain.com mit der Selektor-ID 11 verwendet.
Switch(config)#ip nbar custom MYSSL ssl unique-name *mydomain.com id 11
DNS-Anpassung
NBAR2 untersucht den DNS-Anforderungs- und Antwortverkehr und kann die DNS-Antwort mit einer Anwendung korrelieren. Die von der DNS-Antwort zurückgegebene IP-Adresse wird zwischengespeichert und für die späteren Paketflüsse verwendet, die dieser spezifischen Anwendung zugeordnet sind.
Der Befehlip nbar customapplication-namedns domain-nameidapplication-id wird für die DNS-Anpassung verwendet. Um eine Anwendung zu erweitern, verwenden Sie den Befehlip nbar custom application-name dns domain-name domain-name extends existing-application.
Beispiel für eine benutzerdefinierte Anwendung mit dem Namen MYDNS, die den DNS-Domänennamen mydomain.com mit der Selektor-ID 12 verwendet.
Switch(config)#ip nbar custom MYDNS dns domain-name *mydomain.com id 12
Kombinierte Anpassung
NBAR2 bietet eine Möglichkeit, Anwendungen auf Basis von Domänennamen anzupassen, die in HTTP, SSL oder DNS angezeigt werden.
Beispiel für eine benutzerdefinierte Anwendung mit dem Namen MYDOMAIN, die den HTTP-, SSL- oder DNS-Domänennamen mydomain.com mit der Selektor-ID 13 verwendet.
L3/L4-Anpassung
Die Layer-3-/Layer-4-Anpassung basiert auf dem Paket-Tupel und wird immer beim ersten Paket eines Flows abgeglichen.
Beispiel für eine benutzerdefinierte Anwendung LAYER4CUSTOM, die die IP-Adressen 10.56.1.10 und 10.56.1.11, TCP und DSCP EF mit der Selektor-ID 14 vergleicht.
Switch(config)#ip nbar custom LAYER4CUSTOM transport tcp id 14
Switch(config-custom)#ip address 10.56.1.10 10.56.1.11
Switch(config-custom)#dscp ef
Switch(config-custom)#end
Benutzerdefinierte Anwendungen überwachen
Verwenden Sie zum Überwachen benutzerdefinierter Anwendungen die aufgeführten Befehle show:
show ip nbar, Protokoll-ID | inkl. benutzerdefiniert
Switch#show ip nbar protocol-id | inc Custom
LAYER4CUSTOM             14            Custom
MYDNS                    12            Custom
MYDOMAIN                 13            Custom
MYHTTP                   10            Custom
MYSSL                    11            Custom
show ip nbar, Protokoll-ID CUSTOM_APP
Switch#show ip nbar protocol-id MYSSL
Protocol Name             id            type
----------------------------------------------
MYSSL                    11            Custom
AVC überprüfen
Es gibt mehrere Schritte, um die AVC-Funktion zu validieren. In diesem Abschnitt werden Befehle und Beispielausgaben beschrieben.
Um zu überprüfen, ob NBAR aktiv ist, können Sie den Befehl control-plane show ip nbar ausführen.
Wichtigste Bereiche:
- Der NBAR-Status muss in einem richtigen Szenario aktiviert werden.
- Der NBAR-Konfigurationsstatus muss in einem richtigen Szenario bereit sein.
Switch#show ip nbar control-plane
NGCP Status:
============

graph sender info:
NBAR state is ACTIVATED
NBAR config send mode is ASYNC
NBAR config state is READY

NBAR update ID 3
NBAR batch ID ACK 3
NBAR last batch ID ACK clients 1 (ID: 4)
Active clients 1 (ID: 4)
NBAR max protocol ID ever 1935
NBAR Control-Plane Version: 37

<snip>
Mit dem folgenden Befehl können Sie überprüfen, ob alle Switches über eine aktive Datenebene verfügenshow platform software fed switch active|standby|member wdavc function wdavc_stile_cp_show_info_ui:
DP-aktiviert muss in einem korrekten Szenario TRUE sein.
Switch#show platform software fed switch active wdavc function wdavc_stile_cp_show_info_ui

Is DP activated : TRUE
MSG ID : 3
Maximum number of flows: 262144
Current number of graphs: 1
Requests queue state : WDAVC_STILE_REQ_QUEUE_STATE_UP
Number of requests in queue : 0
Max number of requests in queue (TBD): 1
Counters:
activate_msgs_rcvd : 1
graph_download_begin_msgs_rcvd : 3
stile_config_msgs_rcvd : 1584
graph_download_end_msgs_rcvd : 3
deactivate_msgs_rcvd : 0
intf_proto_disc_msgs_rcvd : 1
intf_attach_msgs_rcvd : 2
cfg_response_msgs_sent : 1593
num_of_handle_msg_from_fmanfp_events : 1594
num_of_handle_request_from_queue : 1594
num_of_handle_process_requests_events : 1594
Verwenden Sie den Befehl, show platform software fed switch active|standby|member wdavc flowsum die Schlüsselinformationen anzuzeigen:
Switch#show platform software fed switch active wdavc flows

CurrFlows=1, Watermark=1

IX |IP1           |IP2           |PORT1|PORT2|L3   |L4   |VRF |TIMEOUT|APP     |TUPLE|FLOW     |IS FIF  |BYPASS|FINAL |#PKTS |BYPASS
   |              |              |     |     |PROTO|PROTO|VLAN|SEC    |NAME    |TYPE |TYPE     |SWAPPED |      |      |      |PKT
--------------------------------------------------------------------------------------
1  |192.168.100.2 |192.168.200.2 |68   |67   |1    |17   |0   |360    |unknown |Full |Real Flow|Yes     |True |True   |40    |40
Schlüsselfelder:
CurrFlows: Zeigt an, wie viele aktive Flows von AVC verfolgt werden.
Wasserzeichen: Zeigt die größte Anzahl von Datenflüssen, die in der Vergangenheit von AVC verfolgt wurden.
ZEITÜBERSCHREITUNG SEK.: Timeout bei Inaktivität basierend auf der identifizierten Anwendung.
ANWENDUNGSNAME: Identifizierte Anwendung
FLUSSTYP: Real Flow zeigt an, dass dies als Ergebnis eingehender Daten erstellt wurde. "Pre Flow" gibt an, dass dieser Fluss als Ergebnis eingehender Daten erstellt wird. Vorläufe werden für erwartete Medienströme verwendet.
TUPELTYP: Echte Flüsse sind immer voller Tupel. Vorflüsse sind entweder Voll- oder Halbtupel.
UMGEHEN: Wenn TRUE eingestellt ist, bedeutet dies, dass die Software keine weiteren Pakete benötigt, um diesen Datenfluss zu identifizieren.
ENDGÜLTIGE VERSION: Wenn TRUE festgelegt ist, bedeutet dies, dass sich die Anwendung für diesen Fluss nicht mehr ändert.
BYPASS-PKT: Anzahl der Pakete, die für die endgültige Klassifizierung erforderlich waren
#PKTS: Wie viele Pakete wurden tatsächlich für diesen Fluss an die Software gesendet?
Zeigt zusätzliche Details zu aktuellen Datenflüssen an. Sie können den Befehl verwenden show platform software fed switch active wdavc function wdavc_ft_show_all_flows_seg_ui.
Switch#show platform software fed switch active wdavc function wdavc_ft_show_all_flows_seg_ui
CurrFlows=1, Watermark=1

IX |IP1           |IP2          |PORT1|PORT2|L3   |L4   |VRF |TIMEOUT|APP     |TUPLE |FLOW     |IS FIF  |BYPASS|FINAL |#PKTS |BYPASS
   |              |             |     |     |PROTO|PROTO|VLAN|SEC    |NAME    |TYPE  |TYPE     |SWAPPED |      |      |      |PKT
---------------------------------------------------------------------------------------------------------------------------------------------------------------------
1  |192.168.100.2 |192.168.200.2|68   |67   |1    |17   |0   |360    |unknown |Full  |Real Flow|Yes     |True  |True  |40    |40

   SEG IDX |I/F ID |OPST I/F |SEG DIR |FIF DIR |Is SET |DOP ID |NFL HDL  |BPS PND |APP PND |FRST TS  |LAST TS  |BYTES   |PKTS  |TCP FLGS
   ------------------------------------------------------------------------------------------------------------------------------------
   0       |9      |----     |Ingress |True    |True   |0      |50331823 |0       |0       |177403000|191422000|24252524|70094 |0
Schlüsselfelder
E/A-ID: Gibt die Schnittstellen-ID an.
SEG DIR: Gibt den Eingang der Ausgangsrichtung an.
FIF DIR: Bestimmt, ob dies die Flussinitiatorrichtung ist.
NFL HDL: Flow ID in der Hardware
Führen Sie den Befehl aus, um den Eintrag in der Hardware anzuzeigen show platform software fed switch active fnf flow-record asic .
Anmerkung: Um den ASIC auszuwählen, ist dies die ASIC-Instanz, der der Port zugeordnet ist. Verwenden Sie zum Identifizieren des ASIC die show platform software fed switch active|standby|member ifm Befehlszuordnungen. Der Startindex kann auf 0 gesetzt werden, wenn Sie nicht an einem bestimmten Fluss interessiert sind. Andernfalls muss der Startindex angegeben werden. Gibt für Num-Flows die Anzahl der Flows an, die angezeigt werden können, maximal 10.
Switch#show platform software fed switch active fnf flow-record asic 3 start-index 0 num-flows 1
1 flows starting at 0 for asic 3:-------------------------------------------------
Idx 175 :
{90, ALR_INGRESS_NET_FLOW_ACL_LOOKUP_TYPE1 = 0x01}
{91, ALR_INGRESS_NET_FLOW_ACL_LOOKUP_TYPE2 = 0x01}
{0, ALR_INGRESS_NFL_SPECIAL1 = 0x00}
{11 PAD-UNK = 0x0000}
{94, PHF_INGRESS_DEST_PORT_OR_ICMP_OR_IGMP_OR_PIM_FIRST16B = 0x0043}
{93, PHF_INGRESS_SRC_PORT = 0x0044}
{67, PHF_INGRESS_IPV4_DEST_ADDRESS = 0xc0a8c802}
{68, PHF_INGRESS_IPV4_SRC_ADDRESS = 0xc0a86402}
{56, PHF_INGRESS_L3_PROTOCOL = 0x11}
FirstSeen = 0x2b4fb, LastSeen = 0x2eede, sysUptime = 0x2ef1c
PKT Count = 0x000000000001216f, L2ByteCount = 0x0000000001873006
Suchen nach verschiedenen Fehlern und Warnungen im Datenpfad
Verwenden Sie den Befehl, um potenzielle Fehler in der Flow-Tabelle anzuzeigenshow platform software fed switch active|standby|member wdavc function wdavc_ft_show_stats_ui | inc err|warn|fail:
Switch#show platform software fed switch active wdavc function wdavc_ft_show_stats_ui | inc err|warn|fail
Bucket linked exceed max error : 0
extract_tuple_non_first_fragment_warn : 0
ft_client_err_alloc_fail : 0
ft_client_err_detach_fail : 0
ft_client_err_detach_fail_intf_attach : 0
ft_inst_nfl_clock_sync_err : 0
ft_ager_err_invalid_timeout : 0
ft_intf_err_alloc_fail : 0
ft_intf_err_detach_fail : 0
ft_inst_err_unreg_client_all : 0
ft_inst_err_inst_del_fail : 0
ft_flow_seg_sync_nfl_resp_pend_del_warn : 0
ager_sm_cb_bad_status_err : 0
ager_sm_cb_received_err : 0
ft_ager_to_time_no_mask_err : 0
ft_ager_to_time_latest_zero_ts_warn : 0
ft_ager_to_time_seg_zero_ts_warn : 0
ft_ager_to_time_ts_bigger_curr_warn : 0
ft_ager_to_ad_nfl_resp_error : 0
ft_ager_to_ad_req_all_recv_error : 0
ft_ager_to_ad_req_error : 0
ft_ager_to_ad_resp_error : 0
ft_ager_to_ad_req_restart_timer_due_err : 0
ft_ager_to_flow_del_nfl_resp_error : 0
ft_ager_to_flow_del_all_recv_error : 0
ft_ager_to_flow_del_req_error : 0
ft_ager_to_flow_del_resp_error : 0
ft_consumer_timer_start_error : 0
ft_consumer_tw_stop_error : 0
ft_consumer_memory_error : 0
ft_consumer_ad_resp_error : 0
ft_consumer_ad_resp_fc_error : 0
ft_consumer_cb_err : 0
ft_consumer_ad_resp_zero_ts_warn : 0
ft_consumer_ad_resp_zero_pkts_bytes_warn : 0
ft_consumer_remove_on_count_zero_err : 0
ft_ext_field_ref_cnt_zero_warn : 0
ft_ext_gen_ref_cnt_zero_warn : 0
Verwenden Sie den Befehl show platform software fed switch active wdavc function wdavc_stile_stats_show_ui | inc err , um mögliche NBAR-Fehler anzuzeigen:
Switch#show platform software fed switch active wdavc function wdavc_stile_stats_show_ui | inc err
find_flow_error : 0
add_flow_error : 0
remove_flow_error : 0
detach_fo_error : 0
is_forward_direction_error : 0
set_flow_aging_error : 0
ft_process_packet_error : 0
sys_meminfo_get_error : 0
Überprüfen, ob Pakete an die CPU geklont wurden
Verwenden Sie den Befehl show platform software fed switch active punt cpuq 21 | inc received , um sicherzustellen, dass Pakete für die NBAR-Verarbeitung auf die CPU geklont werden:
Anmerkung: In der Übung hat sich diese Zahl nicht erhöht.
Switch#show platform software fed switch active punt cpuq 21 | inc received
Packets received from ASIC : 63
Identifizieren von CPU-Überlastung
In Zeiten der Überlastung können Pakete verworfen werden, bevor sie an den WDAVC-Prozess gesendet werden. Verwenden Sie den Befehl, show platform software fed switch active wdavc function fed_wdavc_show_ots_stats_uium Folgendes zu überprüfen:
Switch#show platform software fed switch active wdavc function fed_wdavc_show_ots_stats_ui
OTS Limits
----------------------------------------------
ots_queue_max : 20000
emer_bypass_ots_queue_stress : 4000
emer_bypass_ots_queue_normal : 200
OTS Statistics
----------------------------------------------
total_requests : 40
total_non_wdavc_requests : 0
request_empty_field_data_error : 0
request_invalid_di_error : 0
request_buf_coalesce_error : 0
request_invalid_format_error : 0
request_ip_version_error : 0
request_empty_packet_error : 0
memory_allocation_error : 0
emergency_bypass_requests_warn : 0
dropped_requests : 0
enqueued_requests : 40
max_ots_queue : 0
Tipp: Verwenden Sie den Befehl show platform software fed switch active wdavc function fed_wdavc_clear_ots_stats_ui, um den Zähler für das Ablegen von Einstichen zu löschen.
Identifizierung von Skalierungsproblemen
Wenn keine freien FNF-Einträge in der Hardware vorhanden sind, unterliegt der Datenverkehr nicht der NBAR2-Klassifizierung. Verwenden Sie den Befehlshow platform software fed switch active fnf sw-table-sizes asic zur Bestätigung:
Anmerkung: Erstellte Datenflüsse sind Switch- und Core-spezifisch, wenn sie erstellt werden. Die Switch-Nummer (aktiv, Standby usw.) muss entsprechend angegeben werden. Die eingegebene ASIC-Nummer ist mit der jeweiligen Schnittstelle verknüpft. Verwenden Sie diese, um die ASIC zu ermitteln,show platform software fed switch active|standby|member ifm mappingsdie der Schnittstelle entspricht. Verwenden Sie für die Schattenoption immer 0.
Switch#show platform software fed switch active fnf sw-table-sizes asic 3 shadow 0

---------------------------------
Global Bank Allocation
---------------------------------
Ingress Banks : Bank 0
Egress Banks : Bank 1
---------------------------------
Global flow table Info
INGRESS usedBankEntry 1 usedOvfTcamEntry 0
EGRESS usedBankEntry 0 usedOvfTcamEntry 0 <-- 256 means TCAM entries are full
---------------------------------
Flows Statistics
INGRESS TotalSeen=1 MaxEntries=1 MaxOverflow=0
EGRESS TotalSeen=0 MaxEntries=0 MaxOverflow=0

---------------------------------
Partition Table
---------------------------------
## Dir  Limit CurrFlowCount OverFlowCount MonitoringEnabled
 0 ING      0         0             0           0
 1 ING  16640         1             0           1
 2 ING      0         0             0           0
 3 ING  16640         0             0           0
 4 ING      0         0             0           0
 5 ING   8192         0             0           1
 6 ING      0         0             0           0
 7 ING      0         0             0           0
 8 ING      0         0             0           0
 9 ING      0         0             0           0
10 ING      0         0             0           0
11 ING      0         0             0           0
12 ING      0         0             0           0
13 ING      0         0             0           0
14 ING      0         0             0           0
15 ING      0         0             0           0
 0 EGR      0         0             0           0
 1 EGR  16640         0             0           1
 2 EGR      0         0             0           0
 3 EGR  16640         0             0           0
 4 EGR      0         0             0           0
 5 EGR   8192         0             0           1
 6 EGR      0         0             0           0
 7 EGR      0         0             0           0
 8 EGR      0         0             0           0
 9 EGR      0         0             0           0
10 EGR      0         0             0           0
11 EGR      0         0             0           0
12 EGR      0         0             0           0
13 EGR      0         0             0           0
14 EGR      0         0             0           0
15 EGR      0         0             0           0
Verschlüsselte Datenverkehrsanalysen (ETA)
Hintergrundinformationen
- ETA konzentriert sich auf die Identifizierung von Malware-Kommunikation im verschlüsselten Verkehr durch passive Überwachung, Extraktion relevanter Datenelemente und eine Kombination aus Verhaltensmodellen und maschinellem Lernen mit Cloud-basierter globaler Sicherheit.
- ETA nutzt Telemetriedaten von NetFlow sowie verschlüsselte Malware-Erkennung und kryptografische Compliance und sendet diese Daten an Cisco Stealthwatch.
- ETA extrahiert zwei Hauptdatenelemente: Initial Data Packet (IDP) und Sequence of Packet Length and Time (SPLT).
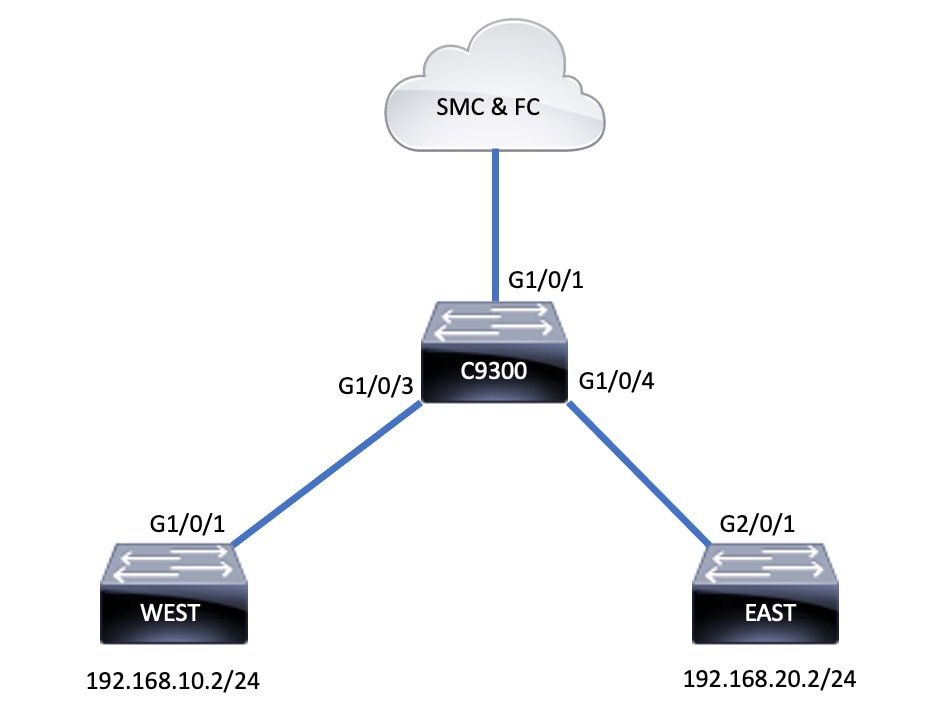
Netzwerkdiagramm
Komponenten
ETA besteht aus verschiedenen Komponenten, die zusammen für die Erstellung der ETA-Lösung verwendet werden:
- NetFlow - Standard, der von Netzwerkgeräten exportierte Datenelemente definiert, die die Datenflüsse im Netzwerk beschreiben.
- Cisco StealthWatch - Nutzt die Leistungsfähigkeit von Netzwerktelemetrie, die NetFlow, IPFIX, Proxy-Protokolle und Deep Packet Inspection von Rohpaketen umfasst, um erweiterte Netzwerktransparenz, Sicherheitsinformationen und Analysen bereitzustellen.
- Cisco Cognitive Intelligence - Erkennt schädliche Aktivitäten, die Sicherheitskontrollen umgangen oder über nicht überwachte Kanäle in eine Unternehmensumgebung gelangt sind.
- Verschlüsselte Datenverkehrsanalysen: Die Cisco IOS XE-Funktion, die mittels fortschrittlicher Verhaltensalgorithmen schädliche Datenverkehrsmuster durch Analyse von Intraflow-Metadaten des verschlüsselten Datenverkehrs identifiziert, erkennt potenzielle Bedrohungen, die im verschlüsselten Datenverkehr verborgen sind.
Anmerkung: Dieser Teil des Dokuments konzentriert sich nur auf die Konfiguration und Verifizierung von ETA und NetFlow auf Switches der Serie Catalyst 9000. Er behandelt nicht die Bereitstellung der StealthWatch Management Console (SMC) und Flow Collector (FC) in der Cognitive Intelligence Cloud.
Einschränkungen
- Bereitstellung von ETA erfordert Cisco DNA Advantage
- ETA und ein Transmit (TX) Switched Port Analyzer (SPAN) werden nicht auf derselben Schnittstelle unterstützt.
Dies ist keine vollständige Liste. Weitere Informationen zu allen Einschränkungen finden Sie im entsprechenden Konfigurationsleitfaden für den Switch und in der entsprechenden Codeversion.
Konfiguration
Wie in der Ausgabe gezeigt, aktivieren Sie auf dem Switch global ETA, und definieren Sie das Exportziel für den Datenfluss:
C9300(config)#et-analytics
C9300(config-et-analytics)#ip flow-export destination 172.16.18.1 2055
Tipp: Sie MÜSSEN Port 2055 verwenden. Verwenden Sie keine andere Portnummer.
Konfigurieren Sie als Nächstes Flexible NetFlow, wie in der Ausgabe gezeigt:
Flow-Datensatz konfigurieren
C9300(config)#flow record FNF-RECORD
C9300(config-flow-record)#match ipv4 protocol
C9300(config-flow-record)#match ipv4 source address
C9300(config-flow-record)#match ipv4 destination address
C9300(config-flow-record)#match transport source-port
C9300(config-flow-record)#match transport destination-port
C9300(config-flow-record)#collect counter bytes long
C9300(config-flow-record)#collect counter packets long
C9300(config-flow-record)#collect timestamp absolute first
C9300(config-flow-record)#collect timestamp absolute last
Konfigurieren des Flussmonitors
C9300(config)#flow exporter FNF-EXPORTER
C9300(config-flow-exporter)#destination 172.16.18.1
C9300(config-flow-exporter)#transport udp 2055
C9300(config-flow-exporter)#template data timeout 30
C9300(config-flow-exporter)#option interface-table
C9300(config-flow-exporter)#option application-table timeout 10
C9300(config-flow-exporter)#exit
Flow-Datensatz konfigurieren
C9300(config)#flow monitor FNF-MONITOR
C9300(config-flow-monitor)#exporter FNF-EXPORTER
C9300(config-flow-monitor)#record FNF-RECORD
C9300(config-flow-monitor)#end
Flow Monitor anwenden
C9300(config)#int range g1/0/3-4
C9300(config-if-range)#ip flow mon FNF-MONITOR in
C9300(config-if-range)#ip flow mon FNF-MONITOR out
C9300(config-if-range)#end
ETA auf Switch-Schnittstelle(n) aktivieren
C9300(config)#interface range g1/0/3-4
C9300(config-if-range)#et-analytics enable
Überprüfung
Überprüfen Sie, ob der ETA-Monitor eta-mon aktiv ist. Bestätigen Sie, dass der Status über den Befehl show flow monitor eta-monzugewiesen wird.
C9300#show flow monitor eta-mon
Flow Monitor eta-mon:
Description: User defined
Flow Record: eta-rec
Flow Exporter: eta-exp
Cache:
Type: normal (Platform cache)
Status: allocated
Size: 10000 entries
Inactive Timeout: 15 secs
Active Timeout: 1800 secs
Überprüfen Sie, ob der ETA-Cache belegt ist. Wenn NetFlow und ETA auf derselben Schnittstelle konfiguriert sind, verwenden Sie show flow monitor anstatt show flow monitor eta-mon cache , da die Ausgabe von leer show flow monitor eta-mon cache ist:
C9300#show flow monitor FNF-MONITOR cache
Cache type: Normal (Platform cache)
Cache size: 10000
Current entries: 4

Flows added: 8
Flows aged: 4
- Inactive timeout ( 15 secs) 4

IPV4 SOURCE ADDRESS: 192.168.10.2
IPV4 DESTINATION ADDRESS: 192.168.20.2
TRNS SOURCE PORT: 0
TRNS DESTINATION PORT: 0
IP PROTOCOL: 1
counter bytes long: 500
counter packets long: 5
timestamp abs first: 21:53:23.390
timestamp abs last: 21:53:23.390

IPV4 SOURCE ADDRESS: 192.168.20.2
IPV4 DESTINATION ADDRESS: 192.168.10.2
TRNS SOURCE PORT: 0
TRNS DESTINATION PORT: 0
IP PROTOCOL: 1
counter bytes long: 500
counter packets long: 5
timestamp abs first: 21:53:23.390
timestamp abs last: 21:53:23.390

IPV4 SOURCE ADDRESS: 192.168.20.2
IPV4 DESTINATION ADDRESS: 192.168.10.2
TRNS SOURCE PORT: 0
TRNS DESTINATION PORT: 0
IP PROTOCOL: 1
counter bytes long: 500
counter packets long: 5
timestamp abs first: 21:53:23.390
timestamp abs last: 21:53:23.390

IPV4 SOURCE ADDRESS: 192.168.10.2
IPV4 DESTINATION ADDRESS: 192.168.20.2
TRNS SOURCE PORT: 0
TRNS DESTINATION PORT: 0
IP PROTOCOL: 1
counter bytes long: 500
counter packets long: 5
timestamp abs first: 21:53:23.390
timestamp abs last: 21:53:23.390
Überprüfen Sie mit dem Befehl show flow exporter eta-exp statistics, ob Flows in Richtung SMC und FC exportiert werden.
C9300#show flow exporter eta-exp statistics
Flow Exporter eta-exp:
Packet send statistics (last cleared 03:05:32 ago):
Successfully sent: 3 (3266 bytes)

Client send statistics:
Client: Flow Monitor eta-mon
Records added: 4
- sent: 4
Bytes added: 3266
- sent: 3266
Bestätigen Sie mit dem Befehl show platform software fed switch active fnf et-analytics-flows, dass SPLT und IDP in die FC exportiert werden.
C9300#show platform software fed switch active fnf et-analytics-flows

ET Analytics Flow dump

=================
Total packets received : 20
Excess packets received : 0
Excess syn received : 0
Total eta records added : 4
Current eta records : 0
Total eta splt exported : 2
Total eta IDP exported : 2
Überprüfen Sie mit dem Befehl show platform software et-analytics interfaces, welche Schnittstellen für Net-Analytics konfiguriert sind.
C9300#show platform software et-analytics interfaces
ET-Analytics interfaces
GigabitEthernet1/0/3
GigabitEthernet1/0/4

ET-Analytics VLANs
Verwenden Sie den Befehl show platform software et-analytics global , um den globalen Status von ETA anzuzeigen:
C9300#show plat soft et-analytics global
ET-Analytics Global state
=========================
All Interfaces : Off
IP Flow-record Destination : 10.31.126.233 : 2055
Inactive timer : 15

ET-Analytics interfaces
GigabitEthernet1/0/3
GigabitEthernet1/0/4

ET-Analytics VLANs
Revisionsverlauf
| Überarbeitung | Veröffentlichungsdatum | Kommentare |
|---|---|---|
3.0 |
13-Nov-2025
|
Formatierung aktualisiert, um den Richtlinien von Cisco zu entsprechen. |
2.0 |
19-Dec-2023
|
Rezertifizierung |
1.0 |
07-Oct-2022
|
Erstveröffentlichung |
Beiträge von Cisco Ingenieuren
- Nathan PanCustomer Delivery Engineering Technical Leader
- Richard FurrPrincipal Engineer
 Feedback
Cisco kontaktieren
- Eine Supportanfrage öffnen

- (Erfordert einen Cisco Servicevertrag)