Contents
Introduction
High network availability is a mission-critical requirement within large enterprise and service provider networks. Network managers face increasing challenges to providing higher availability, including unscheduled down time, lack of expertise, insufficient tools, complex technologies, business consolidation, and competing markets. Capacity and performance management helps network managers achieve new world business objectives and consistent network availability and performance.
This document examines the following topics:
-
General capacity and performance issues, including the risks and potential capacity issues within networks.
-
Capacity and performance management best practices, including what-if analyses, baselining, trending, exception management, and QoS management.
-
How to develop a capacity planning strategy, including common techniques, tools, MIB variables, and thresholds used in capacity planning.
Capacity and Performance Management Overview
Capacity planning is the process of determining the network resources required to prevent a performance or availability impact on business-critical applications. Performance management is the practice of managing network service response time, consistency, and quality for individual and overall services.
Note: Performance problems are usually related to capacity. Applications are slower because bandwidth and data must wait in queues before being transmitted through the network. In voice applications, problems like delay and jitter directly affect the quality of the voice call.
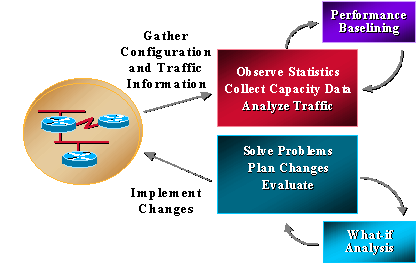
Most organizations already collect some capacity-related information and work consistently to solve problems, plan changes, and implement new capacity and performance functionality. However, organizations do not routinely perform trending and what-if analyses. What-if analysis is the process of determining the affect of a network change. Trending is the process of performing consist baselines of network capacity and performance issues and reviewing the baselines for network trends to understand future upgrade requirements. Capacity and performance management should also include exception management where problems are identified and resolved before users call in, and QoS management where network administrators plan, manage, and identify individual service performance issues. The following graphic illustrates capacity and performance management processes.
Capacity and performance management also has its limitations, typically related to CPU and memory. The following are potential areas for concern:
-
CPU
-
Backplane or I/O
-
Memory and buffers
-
Interface and pipe sizes
-
Queuing, latency, and jitter
-
Speed and distance
-
Application characteristics
Some references to capacity planning and performance management also mention something called the "data plane" and the "control plane". The data plane is simply capacity and performance issues involved with the data traversing the network while the control plane means resources required to maintain proper functionality of the data plane. Control plane functionality includes service overhead such as routing, spanning tree, interface keep-alives, and SNMP management of the device. These control plane requirements use CPU, memory, buffering, queuing, and bandwidth just like the traffic that traverses the network. Many of the control plane requirements are also essential to the overall functionality of the system. If they don’t have the resources they need, the network fails.
CPU
CPU is typically used by both the control plane and data plane on any network device. In capacity and performance management, you must ensure that the device and network have sufficient CPU to function at all times. Insufficient CPU can often collapse a network because inadequate resources on one device may impact the entire network. Insufficient CPU can also increase latency since the data must wait to be processed when there is no hardware switching without the main CPU.
Backplane or I/O
Backplane or I/O refers to the total amount of traffic that a device can handle, usually described in terms of BUS size or backplane capability. Insufficient backplane normally results in dropped packets, which can lead to re-transmissions and additional traffic.
Memory
Memory is another resource that has data plane and control plane requirements. Memory is required for information such as routing tables, ARP tables, and other data structures. When devices run out of memory, some operations on the device can fail. The operation could affect control plane processes or data plane processes, depending on the situation. If control plane processes fail, the entire network can degrade. For example, this can happen when extra memory is required for routing convergence.
Interface and Pipe Sizes
Interface and pipe sizes refer to the amount of data that can be sent simultaneously on any one connection. This is often incorrectly referred to as the speed of a connection, but the data really doesn't travel at different speeds from one device to another. Silicon speed and hardware capability help determine the available bandwidth based on the media. In addition, software mechanisms can "throttle" data to conform to specific bandwidth allocations for a service. You typically see this in service provider networks for frame-relay or ATM that inherently have speed capabilities of 1.54kpbs to 155mbs and higher. When there are bandwidth limitations, data is queued in a transmit queue. A transmit queue may have different software mechanisms to prioritize data within the queue; however, when there is data in the queue, it must wait for existing data before it can forward the data out the interface.
Queuing, Latency, and Jitter
Queuing, latency, and jitter also affect performance. You can tune the transmit queue to affect performance in different ways. For instance, if the queue is large, then the data waits longer. When queues are small, data is dropped. This is called taildrop and is acceptable for TCP applications since the data will be re-transmitted. However, voice and video don't perform well with queue drop or even significant queue latency requiring special attention to bandwidth or pipe sizes. Queue delay can also occur with input queues if the device doesn’t have sufficient resources to immediately forward the packet. This can be due to CPU, memory, or buffers.
Latency describes the normal processing time from the time it is received until the time the packet is forwarded. Normal modern data switches and routers have extremely low latency (< 1ms) under normal conditions without resource constraints. Modern devices with Digital Signal Processors to convert and compress analog voice packets may take longer, even up to 20ms.
Jitter describes the inter-packet gap for streaming applications, including voice and video. If packets arrive at different times with different inter-packet gap timing, then jitter is high and voice quality degrades. Jitter is mainly a factor of queuing delay.
Speed and Distance
Speed and distance is also a factor in network performance. Data Networks have a consistent data forwarding speed based on the speed of light. This is approximately 100 miles per millisecond. If an organization is running a client-server application internationally, then they can expect a corresponding packet-forwarding delay. Speed and distance can be a tremendous factor in application performance when applications are not optimized for network performance.
Application Characteristics
Application characteristics is the last area that affects capacity and performance. Issues such as small window sizes, application keepalives, and the amount of data sent over the network versus what is required can affect the performance of an application in many environments, especially WANs.
Capacity and Performance Management Best Practices
This section discusses the five main capacity and performance management best practices in detail:
Service Level Management
Service level management defines and regulates other required capacity and performance management processes. Network managers understand that they need capacity planning, but they face budgeting and staffing constraints that prevent a complete solution. Service level management is a proven methodology that helps with resource issues by defining a deliverable and creating two-way accountability for a service tied to that deliverable. You can accomplish this in two ways:
-
Create a service level agreement between users and the network organization for a service that includes capacity and performance management. The service would include reports and recommendations to maintain service quality. However, the users must be prepared to fund the service and any required upgrades.
-
The network organization defines their capacity and performance management service and then attempts funding for that service and upgrades on a case-by-case basis.
In any event, the network organization should start by defining a capacity planning and performance management service that includes what aspects of the service they can currently provide and what is planned in the future. A complete service would include a what-if analysis for network changes and application changes, baselining and trending for defined performance variables, exception management for defined capacity and performance variables, and QoS management.
Network and Application What-if Analysis
Perform a network and application what-if analysis to determine the outcome of a planned change. Without a what-if analysis, organizations take significant risks to change success and overall network availability. In many cases, network changes have resulted in congestive collapse causing many hours of production down time. In addition, a startling amount of application introductions fail and cause impact to other users and applications. These failures continue in many network organizations, yet they are completely preventable with a few tools and some additional planning steps.
You normally need a few new processes to perform a quality what-if analysis. The first step is to identify risk levels for all changes and to require a more in-depth what-if analysis for higher risk changes. Risk level can be a required field for all change submissions. Higher risk level changes would then require a defined what-if analysis of the change. A network what-if analysis determines the affect of network changes on network utilization and network control-plane resource issues. An application what-if analysis would determine project application success, bandwidth requirements, and any network resources issues. The following tables are examples of risk level assignment and corresponding testing requirements:
| Risk Level | Definition | Change Planning Recommendations |
|---|---|---|
| 1 |
|
|
| 2 |
|
|
| 3 |
|
|
| 4 |
|
|
| 5 |
|
|
Once you define where you need the what-if analysis, you can define the service.
You can perform a network what-if analysis with modeling tools or with a lab that mimics the production environment. Modeling tools are limited by how well the application understands the device resource issues and since most network changes are new devices, the application may not understand the effect of the change. The best method is to build some representation of the production network in a lab and to test the desired software, feature, hardware, or configuration under load by using traffic generators. Leaking routes (or other control information) from the production network into the lab also enhances the lab environment. Test additional resource requirements with different traffic types, including SNMP, broadcast, multicast, encrypted, or compressed traffic. With all of these different methodologies, analyze the device resource requirements during potential stress situations such as route convergence, link flapping, and device re-starts. Resource utilization issues include normal capacity resource areas such as CPU, memory, backplane utilization, buffers, and queuing.
New applications should also perform a what-if analysis to determine application success and bandwidth requirements. You normally perform this analysis in a lab environment using a protocol analyzer and a WAN delay simulator to understand the effect of distance. You only need a PC, hub, WAN delay device, and lab router connected into the production network. You can simulate bandwidth in the lab by throttling traffic using generic traffic shaping or rate-limiting on the test router. The network administrator can work in conjunction with the application group to understand bandwidth requirements, windowing issues, and potential performance issues for the application in both LAN and WAN environments.
Perform an application what-if analysis before deploying any business application. If you do not do this, the application group blames the network for poor performance. If you can somehow require an application what-if analysis for new deployments via the change management process, you can help prevent unsuccessful deployments and better understand sudden increases in bandwidth consumption for both client-server and batch requirements.
Baselining and Trending
Baselining and trending allow network administrators to plan and complete network upgrades before a capacity problem causes network down time or performance problems. Compare resource utilization during successive time periods or distill information down over time in a database and allow planners to view resource utilization parameters for the last hour, day, week, month, and year. In either case, someone must review the information on a weekly, bi-weekly, or monthly basis. The problem with baselining and trending is that it requires an overwhelming amount of information to review in large networks.
You can resolve this problem is several ways:
-
Build plenty of capacity and switching into the LAN environment so capacity is a not an issue.
-
Divide the trend information into groups and concentrate on high-availability or critical areas of the network, such as critical WAN sites or Data Center LANs.
-
Reporting mechanisms can highlight areas that fall above a certain threshold for special attention. If you implement critical availability areas first, you can significantly reduce the amount of information required for review.
With all of the previous methods, you still need to review the information on a periodic basis. Baselining and trending is a proactive effort and if the organization only has resources for reactive support, individuals will not read the reports.
Many network management solutions provide information and graphs on capacity resource variables. Unfortunately, most people only use these tools for reactive support to an existing problem; this defeats the purpose of baselining and trending. Two tools that are effective in providing Capacity trend information for Cisco networks are the Concord Network Health product and the INS EnterprisePRO products. In many cases, network organizations run simple scripting languages to collect capacity information. Below are some example reports that were collected via Script for link utilization, CPU utilization, and ping performance. Other resource variables that may be important to trend include memory, queue depth, broadcast volume, buffer, frame relay congestion notification, and backplane utilization. Refer to these table for information on link utilization and CPU utilization:
Link Utilization
| Resource | Address | Segment | Average Utilization (%) | Peak Utilization (%) |
|---|---|---|---|---|
| JTKR01S2 | 10.2.6.1 | 128 Kbps | 66.3 | 97.6 |
| JYKR01S0 | 10.2.6.2 | 128 Kbps | 66.3 | 97.8 |
| FMCR18S4/4 | 10.2.5.1 | 384 Kbps | 51.3 | 109.7 |
| PACR01S3/1 | 10.2.5.2 | 384 Kbps | 51.1 | 98.4 |
CPU Utilization
| Resource | Polling Address | Average Utilization (%) | Peak Utilization (%) |
|---|---|---|---|
| FSTR01 | 10.28.142.1 | 60.4 | 80 |
| NERT06 | 10.170.2.1 | 47 | 86 |
| NORR01 | 10.73.200.1 | 47 | 99 |
| RTCR01 | 10.49.136.1 | 42 | 98 |
Link Utilization
| Resource | Address | AvResT (mS) 09-09-98 | AvResT (mS) 09-09-98 | AvResT (mS) 09-09-98 | AvResT (mS) 10-01-98 |
|---|---|---|---|---|---|
| AADR01 | 10.190.56.1 | 469.1 | 852.4 | 461.1 | 873.2 |
| ABNR01 | 10.190.52.1 | 486.1 | 869.2 | 489.5 | 880.2 |
| APRR01 | 10.190.54.1 | 490.7 | 883.4 | 485.2 | 892.5 |
| ASAR01 | 10.196.170.1 | 619.6 | 912.3 | 613.5 | 902.2 |
| ASRR01 | 10.196.178.1 | 667.7 | 976.4 | 655.5 | 948.6 |
| ASYR01S | 503.4 | ||||
| AZWRT01 | 10.177.32.1 | 460.1 | 444.7 | ||
| BEJR01 | 10.195.18.1 | 1023.7 | 1064.6 | 1184 | 1021.9 |
Exception Management
Exception management is a valuable methodology for identifying and resolving capacity and performance issues. The idea is to receive notification of capacity and performance threshold violations in order to immediately investigate and fix the problem. For example, a network administrator might receive an alarm for high CPU on a router. The network administrator can log into the router to determine why the CPU is so high. She can then perform some remedial configuration that reduces the CPU or create an access-list preventing the traffic that causes the problem, especially if the traffic does not appear to be business-critical.
You can configure exception management for more critical issues fairly simply using RMON configuration commands on a router or using more advanced tools such as Netsys service level manager in conjunction with SNMP, RMON or Netflow data. Most network management tools have the capability to set thresholds and alarms on violations. The important aspect of the exception management process is to provide near real-time notification of the issue. Otherwise, the problem may vanish before anyone noticed that notification was received. This can be done within a NOC if the organization has consistent monitoring. Otherwise, we recommend pager notification.
The following configuration example provides rising and falling threshold notification for router CPU to a log file that may be reviewed on a consistent basis. You can set up similar RMON commands for critical link utilization threshold violations or other SNMP thresholds.
rmon event 1 trap CPUtrap description
  "CPU Util >75%"rmon event 2 trap CPUtrap description
  "CPU Util <75%"rmon event 3 trap CPUtrap description
  "CPU Util >90%"rmon event 4 trap CPUtrap description
  "CPU Util <90%"rmon alarm 75 lsystem.56.0 10 absolute rising-threshold
  75 1 falling-threshold 75 2rmon alarm 90 lsystem.56.0 10 absolute rising-threshold
  90 3 falling-threshold 90 4
QoS Management
Quality of service management involves creating and monitoring specific traffic classes within the network. A traffic provides more consistent performance for specific application groups (defined within traffic classes). Traffic shaping parameters provide significant flexibility in the prioritization and traffic-shaping for specific classes of traffic. These features include capabilities such as committed access rate (CAR), weighted random early detection (WRED), and class based fair weighted queuing. Traffic classes are normally created based on performance SLAs for more business critical applications and specific application requirements such as voice. Non-critical or non-business traffic would also be controlled in a way that it can not affect higher priority applications and services.
Creating traffic classes requires a baseline understanding of network utilization, specific application requirements, and business application priorities. Application requirements include knowledge of packet sizes, time-out issues, jitter requirements, burst requirements, batch requirements, and overall performance issues. With this knowledge, network administrators can create traffic-shaping plans and configurations that provide more consistent application performance across a variety of LAN/WAN topologies.
For instance, one organization has a 10-megabit ATM connection between two major sites. The link sometimes becomes congested from large file transfers, which causes performance degradation for online transaction processing and poor or unusable voice quality.
The organization set up four different traffic classes. Voice was given the highest priority and allowed to maintain that priority even if it burst over estimated traffic volume rate. The critical application class was given the next highest priority but it was not allowed to burst over total link size less the estimated voice bandwidth requirements. When it does burst, it will be dropped. File transfer traffic was simply given a lower priority and all other traffic fit somewhere in the middle.
The organization now has to perform QoS management on this link to determine how much traffic each class is taking and measure the performance within each class. If the organization fails to do this, starvation may occur for some classes or performance SLAs may not be met within a particular class.
Managing QOS configurations is still a difficult task because of the lack of tools. One method is to use Cisco's Internet performance manager (IPM) to send different traffic across the link that falls into each of the traffic classes. You could then monitor performance for each class and IPM provides trending, real-time analysis, and hop-by-hop analysis to pinpoint problem areas. Others may still rely on a more manual method like investigating the queuing and dropped packets within each traffic class based on interface statistics. In some organizations, this data may be collected via SNMP or parsed into a database for baselines and trending. Some tools also exist in the market that send specific traffic types across the network to determine performance for a particular service or application.
Collecting and Reporting Capacity Information
Collecting and reporting capacity information should be linked to the three recommended areas of capacity management:
-
What-if analysis, which centers around network change and how the change affects the environment
-
Baselining and trending
-
Exception management
Within each of these areas, develop an information collection plan. In the case of network or application what-if analyses, you need tools to mimic the network environment and to understand the affect of the change relative to potential resource issues within the device control plane or the data plane. In the case of baselining and trending, you need snapshots for devices and links showing current resource utilization. You then review the data over time to understand potential upgrade requirements. This allows network administrators to properly plan upgrades before capacity or performance problems arise. When problems do arise, you need exception management to alert the network administrators so they can tune the network or fix the problem.
This process can be divided into the following steps:
-
Determine your needs.
-
Define a process.
-
Define capacity areas.
-
Define the capacity variables.
-
Interpret the data.
Determine your Needs
Developing a capacity and performance management plan requires understanding the information you need and the purpose of that information. Split the plan into three required areas: one each for what-if analysis, baselining/trending, and exception management. Within each of these areas, discover what resources and tools are available and what is needed. Many organization fail with tool deployments because they consider the technology and features of the tools but don't consider the people and expertise needed to manage the tools. Include the required people and expertise in your plan, as well as process improvements. These people may include system administrators to manage the network management stations, data base administrators to help with database administration, trained administrators to use and monitor the tools, and higher level network administrators to determine policies, thresholds, and information collection requirements.
Define a Process
You also need a process to ensure that the tool is used successfully and consistently. You may require process improvements to define what network administrators should do when threshold violations occur or what process to follow for baselining, trending, and upgrading the network. Once you determine the requirements and resources for successful capacity planning, you can consider the methodology. Many organizations choose to outsource this type of functionality to a network services organization such as INS or build the expertise in-house because they consider the service a core competency.
Define Capacity Areas
The plan for capacity planning should also include a definition of capacity areas. These are areas of the network that can share a common capacity planning strategy: for example, the corporate LAN, WAN field offices, critical WAN sites, and dial-in access. Defining different areas is helpful for several reasons:
-
Different areas may have different thresholds. For example, LAN bandwidth is much cheaper than WAN bandwidth so utilization thresholds should be lower.
-
Different areas may require monitoring different MIB variables. For instance, FECN and BECN counters in Frame Relay are critical in understanding frame-relay capacity problems.
-
It may be more difficult or time consuming to upgrade some areas of the network. For example, international circuits can have much longer lead times and need a corresponding higher level of planning.
Define the Capacity Variables
The next important area is defining the variables to monitor and the threshold values that require action. Defining the capacity variables significantly depends on the devices and media used within the network. In general parameters such as CPU, memory and link utilization are valuable. However, other areas may be important for specific technologies or requirements. These may include queue depths, performance, frame-relay congestion notification, backplane utilization, buffer utilization, netflow statistics, broadcast volume, and RMON data. Keep in mind your long term plans, but start with only a few key areas to help ensure success.
Interpret the Data
Understanding the collected data is also key to providing a high-quality service. For instance, many organizations don't fully understand peak and average utilization levels. The following diagram shows a capacity parameter peak based on a 5 minute SNMP collection interval, (shown in green).
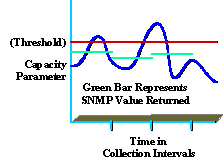
Even though the reported value was less than the threshold (shown in red) peaks still can occur within the collection interval that are above the threshold value (shown in blue). This is significant because during the collection interval, the organization may be experiencing peak values that affect performance or capacity of the network. Be careful to select a meaningful collection interval that is useful and that does not cause excessive overhead.
Another example is average utilization. If employees are only in the office from eight to five, but the average utilization is 7X24, the information may be misleading.