Cisco SAN Analytics and SAN Telemetry Streaming Solution Overview
Available Languages
Bias-Free Language
The documentation set for this product strives to use bias-free language. For the purposes of this documentation set, bias-free is defined as language that does not imply discrimination based on age, disability, gender, racial identity, ethnic identity, sexual orientation, socioeconomic status, and intersectionality. Exceptions may be present in the documentation due to language that is hardcoded in the user interfaces of the product software, language used based on RFP documentation, or language that is used by a referenced third-party product. Learn more about how Cisco is using Inclusive Language.
A deeper look at enterprise storage infrastructure
The enterprise storage industry is going through a historic transformation. On one end, deep adoption of
all-flash arrays, and on the other end, technologies like NVMe (nonvolatile memory express) and NVMe over fabrics are changing the landscape forever. High performance is the key motivation for these storage trends. Millions of Input/Output Operations Per Second (IOPS) and response times in microseconds are the new norms. However, lab certified results does not always represent what you see in your production environments. It’s a question of known versus unknown, controlled versus uncontrolled, low-risk versus high-risk.
In production, every single operational change must be backed by data and thoroughly approved. There is no hit-and-trial. A production environment is like a multidimensional equation. While every single variable in that equation may work on its own, bringing together multiple variables requires deep visibility and understanding of the way these components interact. Without that visibility, a production environment is a best-effort solution.
Challenges in getting visibility into enterprise storage infrastructure
Chief Information Officers (CIOs) and Chief Technology Officers (CTOs) understand the importance of deep visibility and analytics. However, achieving it often becomes challenging in production environments due to:
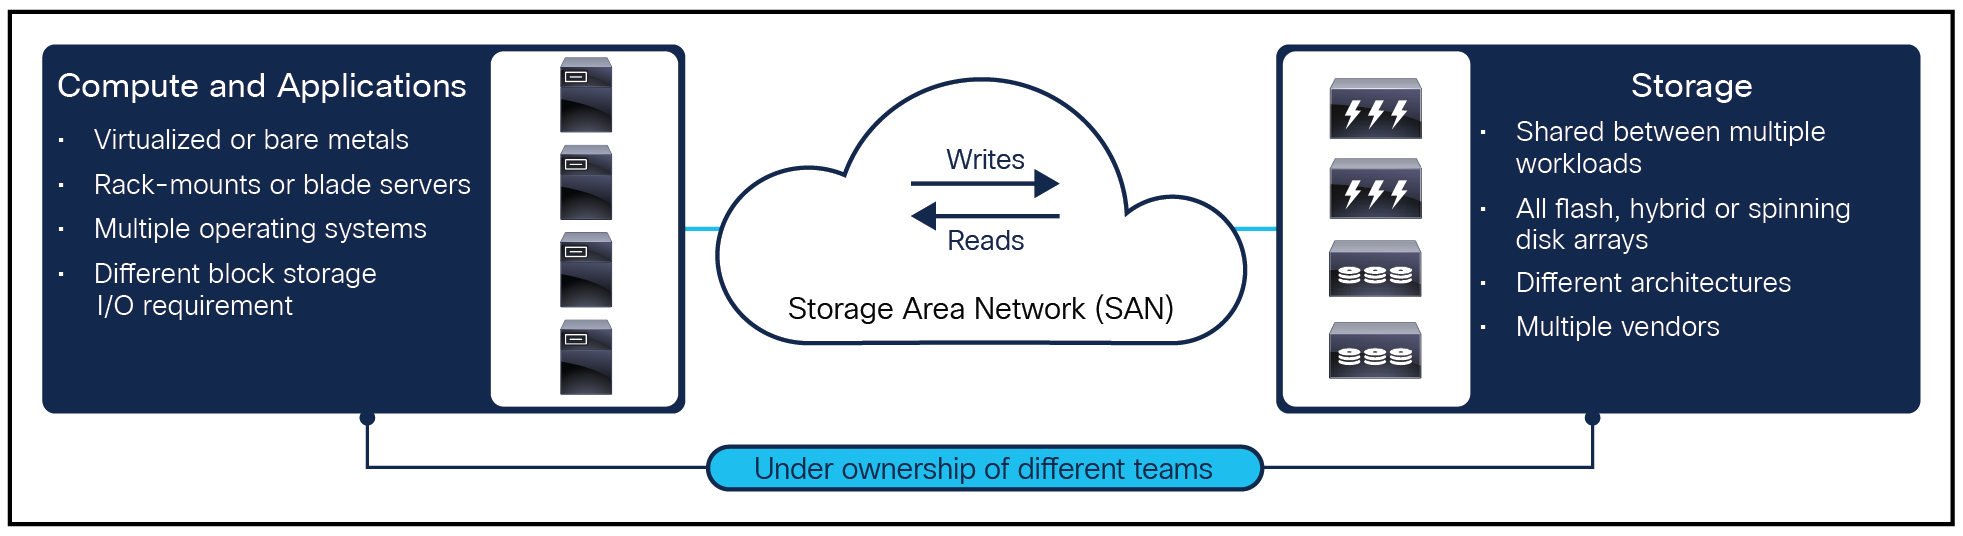
● Lack of unified visibility: Getting a unified view of compute, storage, and Storage Area Network (SAN) under a single umbrella is often complex. Visibility at few endpoints is possible today, but the complete visibility of storage traffic becomes complex with the currently available industry offerings.
● Hybrid infrastructure: Enterprises have to deal with multiple architectures at the same time. For example, the compute layer itself may be running different types of hypervisors and virtual machines. These hypervisors and the guest virtual machines may be developed by different vendors and based on different architectures. Similarly, the storage infrastructure may include different types of storage arrays. These arrays might be all-flash, hybrid, or nonflash arrays. The storage arrays may be based on different architectures—even if they are sourced from the same vendor.
● Organizational silos: Many organizations have assigned the ownership of different components to different teams. Often these teams work in silos. Even if the coordination is very well maintained, the process and compliance guidelines may slow down the cross-team interaction. Organizational silos are also one of the key reasons for delayed detection of issues and troubleshooting.
● Lack of simplicity: Professionals who own the infrastructure already deal with multiple tools and architectures today. It is not practically feasible for them to become expert in many different technologies at the same time.
As a result, they require information in a simple and intuitive format that can be directly converted into actionable insight.
The following sections provide an overview of Cisco SAN Analytics and SAN Telemetry Streaming: A first-of-its-kind industry solution to resolve the above-mentioned challenges.
Introducing Cisco SAN Analytics
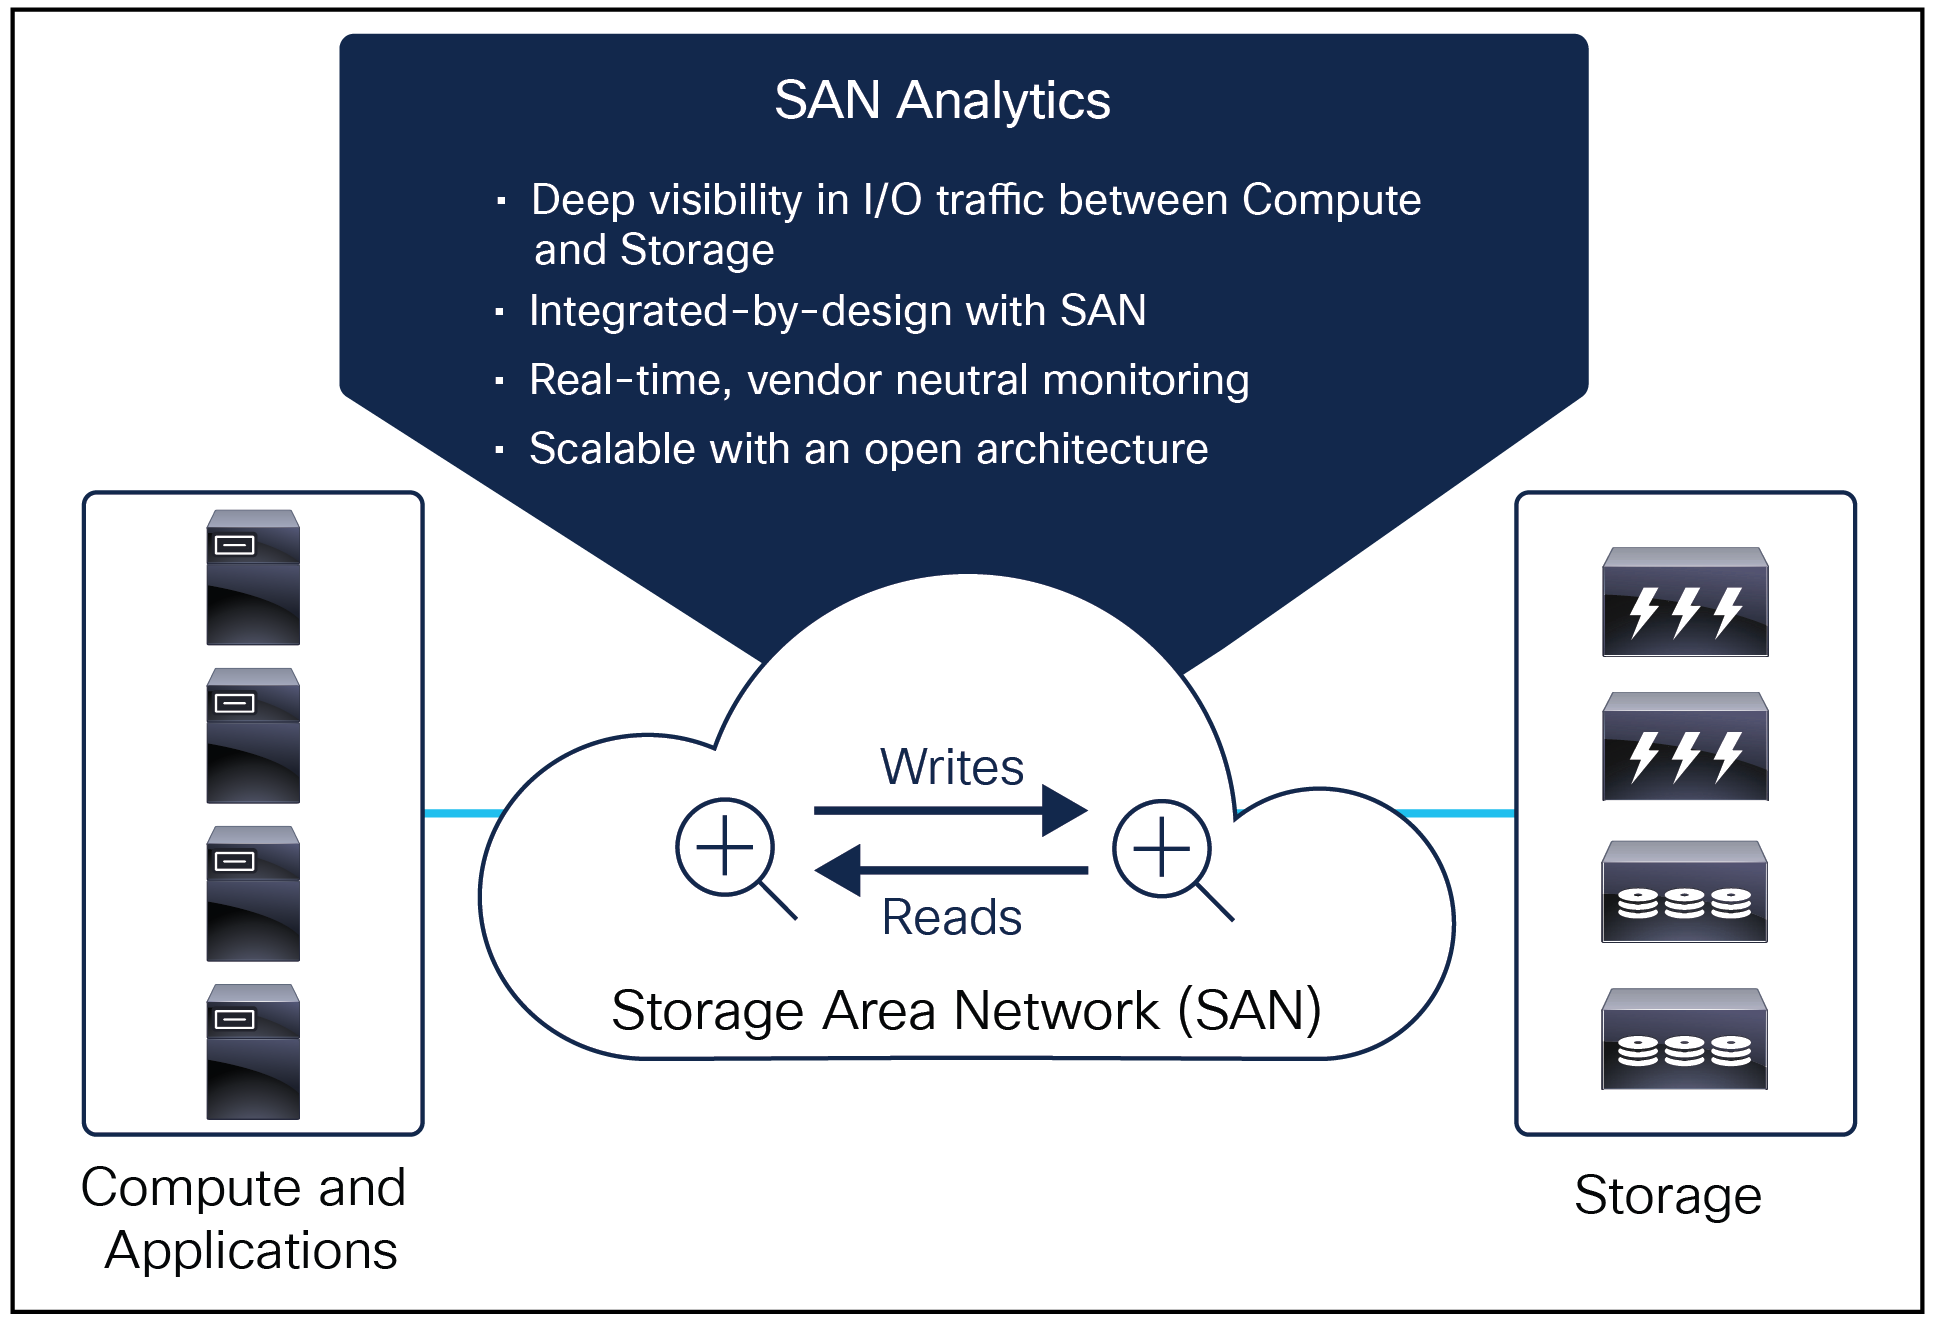
The Cisco SAN Analytics solution offers end-to-end visibility into Fibre Channel block storage traffic. The solution is natively available on the storage area network due to its integrated-by-design architecture with the Cisco MDS 9000 switch family. Cisco SAN Analytics delivers deep visibility into I/O traffic between the compute and the storage infrastructure. This information is in addition to the already-available visibility obtained from individual ports, switches, servers, virtual machines, and storage arrays.
Cisco SAN Telemetry Streaming overview
Cisco SAN Analytics and SAN Telemetry Streaming works on the following design principles as shown in
Table 1.
Table 1. Cisco SAN Analytics and SAN Telemetry design principles
| Principle |
How it works |
What it delivers to you |
| Integrated by design |
Compute and storage layers in a data center interact with each other using a SAN. Cisco SAN Analytics is fully integrated by design into the SAN layer. |
● You can continue to maintain your operations under the existing well-known layers of compute, storage and SAN.
● You do not need to introduce any new traffic inspecting components to your data center floor.
|
| Simple |
The deployment of Cisco SAN Analytics is integrated into your existing Cisco MDS 9000 switches. The capability can be enabled by a single command within seconds. |
● Problems in the environment can be resolved faster.
● You can make your operations more proactive leading to improved user experience.
|
| Affordable |
Due to the integrated-by-design architecture, no new traffic inspecting components are introduced into your data center. Simple and flexible licensing can enable the functionality to provide end-to-end visibility. |
● Eliminate CapEx and OpEx associated with managing dedicated appliances.
● Flexible licensing helps you to enable this feature where you want and when you want.
|
| Scalable |
Cisco SAN Analytics natively scales up with the size of your SAN. Whether it is a small SAN of a single switch or a large SAN with thousands of ports, you get visibility as end devices are connected to your SAN. |
● You can deploy it everywhere to get full coverage of your storage traffic.
● Analytics scale grows with the size of your fabric.
|
| Always on |
Cisco SAN Telemetry Streaming has been designed to be always on. |
● You can profile and baseline the storage traffic of your applications under normal conditions.
● You do not have to find the tipping points of your environment manually because the always-on monitoring is doing that for you proactively.
|
| Open and programmable |
Cisco SAN Telemetry Streaming has been designed to be open and programmable. The intelligent metrics are accessible to third-party tools using industry-leading formats. It is based on a programmable architecture. |
● Support of additional metrics and protocols with firmware upgrade.
● Build your own analytics apps to solve specific use cases or integrate with existing third-party apps for organization-wide uniform visibility.
|
Cisco SAN Analytics and SAN Telemetry Streaming resolves existing and new challenges. Table 2 lists existing limitations and how Cisco is addressing them.
Table 2. How Cisco SAN Analytics and SAN Telemetry Streaming addresses challenges
| Existing challenges |
How Cisco SAN Analytics and SAN Telemetry Streaming helps |
| Lack of unified visibility |
Cisco SAN Analytics is integrated by design into the SAN. It inspects I/O flows to bring out a unified view of the infrastructure irrespective of the architecture or vendor of storage arrays, servers or operating systems. |
| Hybrid infrastructure |
Cisco SAN Analytics is agnostic to the compute or storage infrastructure’s vendor or architecture. The visibility is obtained from the traffic flow on the SAN. Cisco SAN Telemetry Streaming has little or no dependency on hardware or software versions of the end devices connected to the SAN. |
| Organization silos |
Cisco SAN Telemetry Streaming exports data in industry-leading formats. This information can be remotely accessed by different teams at the same time with complete independence. Different organizations can continue to use the tools they prefer by integrating the exported information from Cisco SAN Telemetry Streaming. |
| Lack of simplicity |
Cisco SAN Analytics is extremely simple to deploy due to its integrated-by-design principle. The functionality can be enabled within seconds on the Cisco MDS 9000 series switches. |
Cisco SAN Analytics and SAN Telemetry Streaming use cases
Table 3 describes several Cisco SAN Analytics and SAN Telemetry Streaming use cases.
Table 3. Cisco SAN Telemetry Streaming use cases
| Use case |
How it is delivered |
Why it matters |
| Storage performance insight |
Cisco SAN Analytics solution quantifies the performance of the storage infrastructure using a holistic approach. Performance metrics are calculated for the flows between host port (initiator), storage port (target), and the Logical Unit Numbers (LUNs). This unique combination is known as ITL (Initiator-Target-LUN) flow. For NVMe traffic, the same concept is represented by ITN, N representing a Namespace ID. The performance metrics are calculated in real time and can be exported to an external receiver. |
Complete visibility into your infrastructure reduces risks and helps maintain optimum performance. |
| Faster troubleshooting |
The information generated by Cisco SAN Analytics solution can be used to maintain a performance baseline. A deviation from the historic trend can be used to generate automated alarms, resulting into proactive troubleshooting. This monitoring also provides insight into why the performance degraded and where may be the root cause of the problem. |
Proactive and predictive troubleshooting helps to meet strict Service-Level Agreements (SLAs) and reduce downtimes. |
| Infrastructure optimization |
Cisco SAN Analytics can help to make scale-up versus scale-out decisions by monitoring storage traffic between ITL/ITN pairs. For example, it may be possible that a host is running multiple virtual machines, or a particular storage port is used to access multiple LUNs, either or which can lead to heavy storage traffic. Cisco SAN Analytics can help you to find such conditions. To resolve, you can optimize the distribution of the components, such as moving some of the virtual machines to a less-utilized host or moving some of the LUNs to a less-utilized storage port. |
Optimum utilization of your infrastructure can lead to CapEx and OpEx savings. |
| Application deployment recommendation |
Cisco SAN Analytics can be used to monitor storage traffic patterns for extended durations. This information can be used to profile the applications for their storage needs. Future expansion of the same application to other virtual machines or hosts can be recommended based on storage traffic requirements. For example, consider an existing application A. If another instance of application A needs to be deployed, knowing the storage traffic throughput can help when choosing a new host that has the resources available to sustain the throughput requirement. |
Data-driven decisions help to deploy applications faster.
Eliminate hit-and-trial to ensure optimum performance. |
| Storage provisioning recommendation |
Cisco SAN Analytics provides performance metrics of the available LUNs/Namespaces. This information can be used to enhance the storage provisioning. For example, LUNs can be distributed across different storage ports to meet their throughput requirements. If a LUN is showing no activity for an extended duration, it can be inspected further for possible errors or can be un provisioned. |
Optimized utilization of storage arrays and the overall storage infrastructure improves efficiency. |
| Change Management |
Cisco SAN Analytics collects performance metrics at ITL/ITN granularity which can be used to generate trends and baselines. If a particular component needs to be changed, the insight generated by Cisco SAN Analytics before and after the change can be monitored and compared to ensure that the change was successful. |
Proactive SLA assurance during change of components lends peace of mind. |
| Auditability |
Cisco SAN Analytics generates multiple performance and error metrics for the complete storage fabric using a holistic approach. This information can be used to perform audits of the infrastructure. |
Get the information you need to ensure compliance. |
| Health report |
Cisco SAN Analytics monitors ITL/ITN flows between the compute and storage layers, including the read and the write transactions between a host and the backend storage. This information is available in addition to already-existing device- and port-level metrics. All these metrics can be used to generate health reports. This report goes beyond the health of the SAN by revealing the health of the overall storage infrastructure and applications. |
Simplify operations and proactively resolve problems. |
Cisco SAN Analytics solution architecture
Cisco SAN Analytics is integrated by design into the SAN between the compute and the storage layers. This is made possible by recent innovations in the Cisco MDS 9000 switch family. The overall architecture can be logically divided into three components.
● Traffic inspection by port ASICs.
● Traffic processing and flow metric calculation by an on-board Network Processing Unit (NPU).
● Streaming of flow metrics to an external analytics and visualization engine for end-to-end visibility.
Traffic inspection
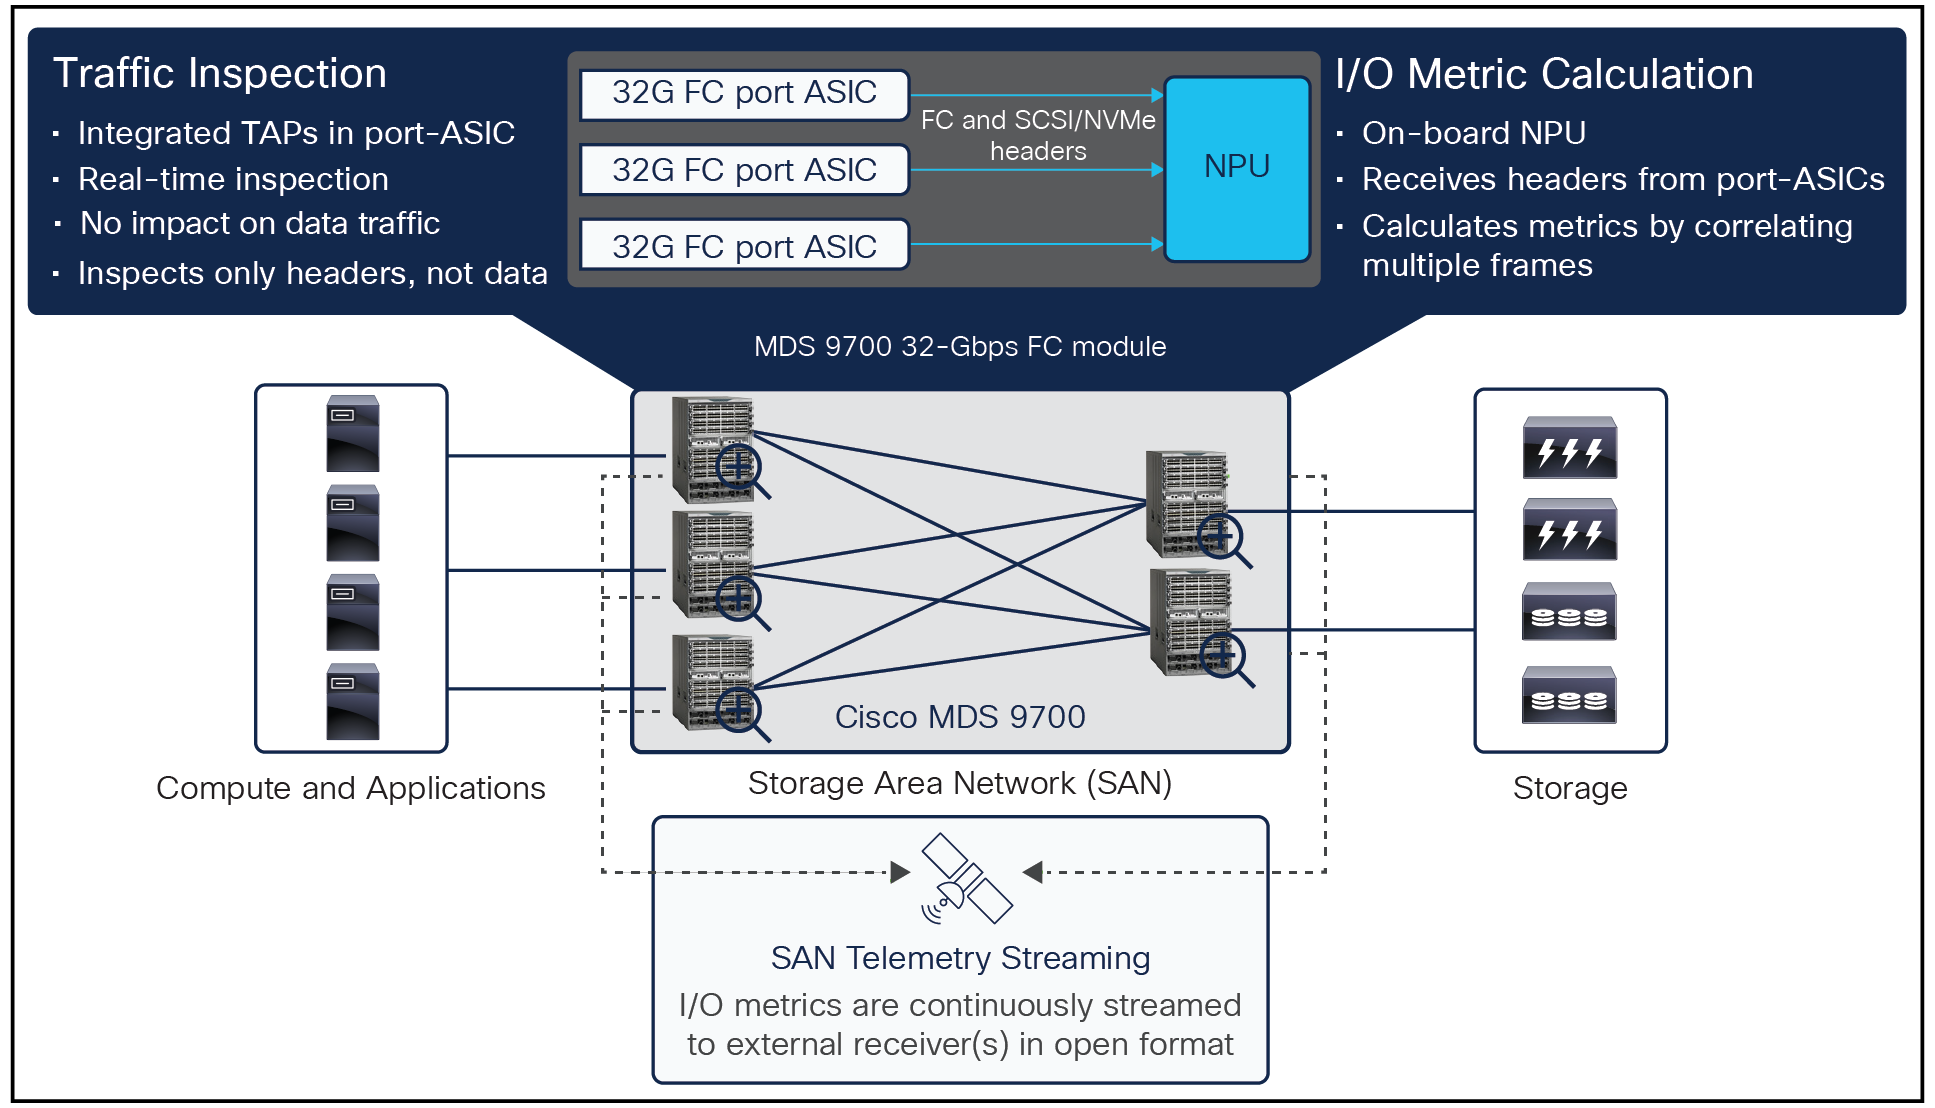
Traffic inspection is integrated with the latest generation Fibre Channel port ASICs available on Cisco MDS 9000 switches. Frames in ingress or egress direction can be inspected without any performance or feature penalty. In other words, Traffic Access Points (TAPs) are inbuilt on the port ASICs.
Block I/O transactions between initiators and targets are facilitated by SCSI or NVMe protocol utilizing an underlying Fibre Channel connection. The application data (reads or writes) is encapsulated within Fibre Channel and SCSI/NVMe headers. The port ASICs, after inspection of the frames, capture Fibre Channel and SCSI/NVMe headers of the relevant frames. Cisco MDS 9000 switches make no attempt to inspect or capture underlying application data. Only headers are inspected, which is enough to gather the information.
I/O metric calculation
Flow metric calculation is performed on the switch itself with the help of an on-board Network Processing Unit (NPU). A NPU is a programmable processor optimized for packet processing. On Cisco MDS 9000 switches, the NPU receives frames from the port ASICs, truncated up to the Fibre Channel and SCSI/NVMe headers. The frame headers are then subjected to a specialized low-level microcode which generates the flow metrics by correlating multiple frames with common attributes (for example same I/O transaction (or Exchange) and same ITL/ITN flow). The metrics are stored in a hierarchical and relational database maintained in the memory associated with the NPU.
The availability of a programmable NPU on the switches enable tremendous possibilities. New capabilities can be added by a non-disruptive software upgrade. For example, support for NVMe/FC and other additional metrics was added later. In future, more metrics can be added without any hardware changes.
As the size of the fabric grows, the resources for traffic inspection and metric calculation also grows because of the integrated-by-design architecture.
Streaming of I/O metrics to an external receiver (SAN Telemetry Streaming)
Cisco MDS 9000 switches stream the flow metrics to an external receiver in industry leading open formats. An external receiver can bring the fabric-wide and end-to-end visibility into a single pane of glass. The external receiver can also provide long term metric storage, trending, correlation, predictions, etc. The implementation of the external receiver has been de-coupled from the on-switch SAN Analytics architecture for development flexibility. The receiver can aim to solve very specific use-cases based on the metrics received from Cisco MDS 9000 switches. For example, an external receiver can receive metrics from multiple switches at the same time and can also correlate with the information generated from initiators and targets.
Cisco SAN Telemetry Streaming architecture on MDS 32G switches
Cisco SAN Analytics on MDS 64G switches
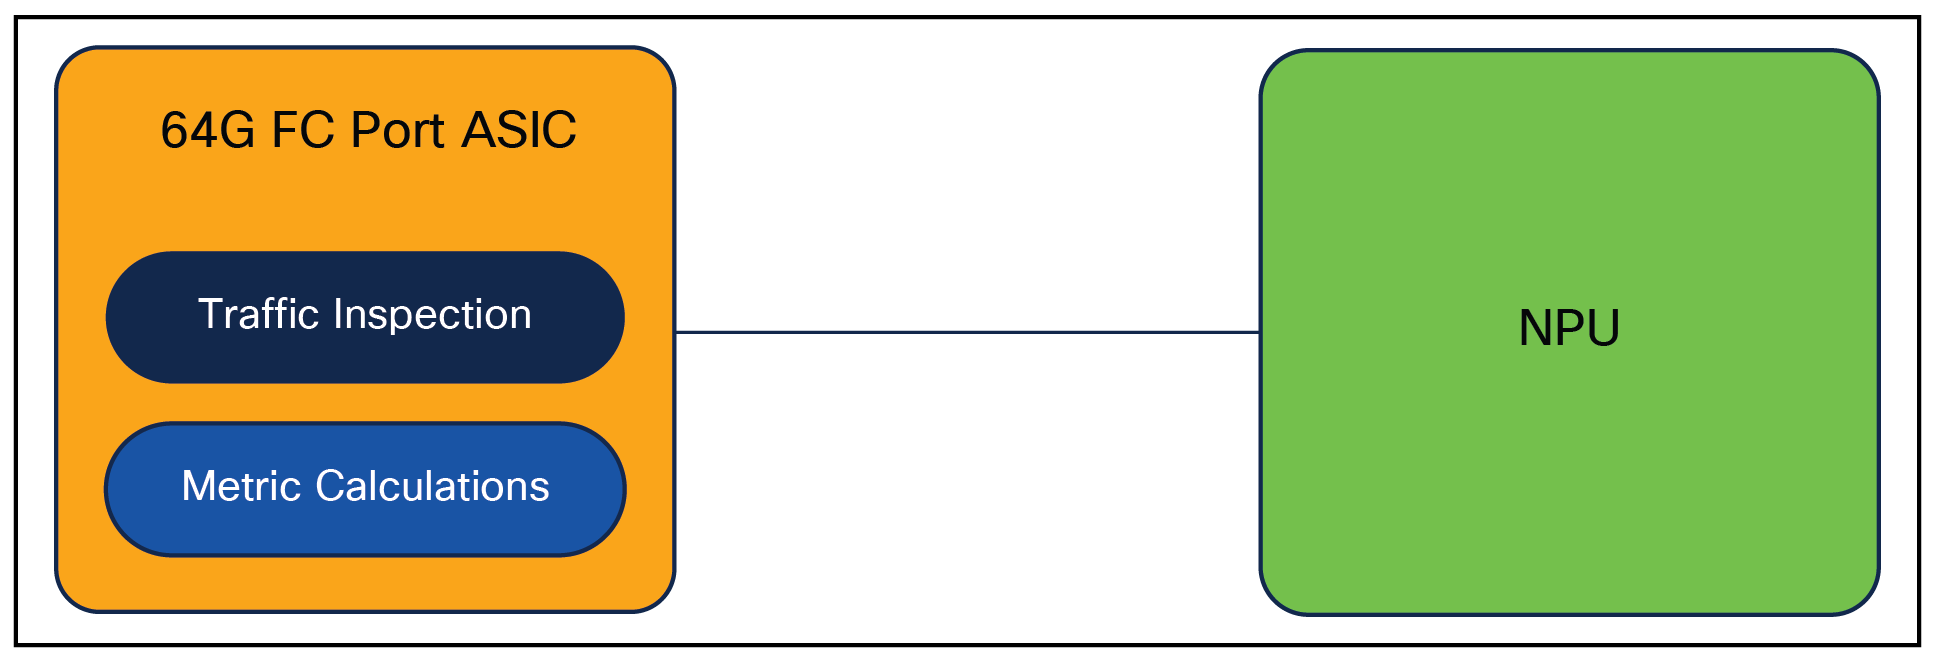
With the introduction of the new Cisco MDS 64G module and fabric switches which has the latest 64G ASIC, significant changes have been made to the SAN Analytics Architecture, leveraging the latest ASIC capabilities.
This new Cisco 64G ASIC can analyze every SCSI or NVMe I/O being switched on all the 48 ports simultaneously at line rate and in real time. It can calculate 80+ metrics on a per flow basis without involving the NPU. Essentially, the 64G ASIC handles both traffic inspection and I/O metric calculation, while retaining the software programmable NPU for potential future use.
Furthermore, there are 10 new metrics with the Cisco MDS 64G Module and fabric switches compared to Cisco MDS 32G Module and fabric switches that offer deeper insights into I/O behaviors.
Cisco SAN Telemetry Streaming architecture on MDS 64G switches
I/O metrics calculated on Cisco MDS 9000 in NX-OS 9.3(2)
Following is a non-exhaustive list of I/O metrics calculated by the Cisco MDS 9000 32-Gbps and 64-Gbps switches in NX-OS 9.3(2). These metrics are calculated for up to 100,000 ITL/ITN flows per Cisco MDS 9700 director (for SCSI and NVMe traffic), and are in addition to the already existing port level metrics.
● Initiator ID: Fibre Channel ID (FCID) of the initiator.
● Target ID: Fibre Channel ID (FCID) of the target.
● LUN/NSID: Logical-Unit-Number (LUN) or Namespace ID associated with the target.
● I/O Per Second (IOPS): Number of read or write commands per second.
● Throughput: Read or write command bandwidth in bytes per second.
● Exchange Completion Time: Time taken to complete read or write command (or Exchange) in microseconds.
● Data Access Latency: Time between the read or write command and the response from storage array in microseconds.
● Host Response Latency: Time between receiving the write transfer ready and sending the data by a host.
● Outstanding IO: Number of read or write commands yet to be completed.
● Error counters like aborts, failure, timeouts, etc.
The Cisco MDS 9700 32-Gbps Fibre Channel module and the MDS 9000 32-Gbps Fibre Channel fabric switches support SAN Telemetry Streaming powered by the advanced port-ASIC and on-board NPU.
Cisco SAN Analytics is the industry’s first solution to provide visibility into Fibre Channel block storage traffic by inspecting frames natively on Fibre Channel switches without any external taps, probes, or appliances. It seamlessly scales to every end device of your fabric using a simple and affordable approach. The open and programmable architecture helps you to work across organization silos. Overall, The real time visibility and analytics offered by Cisco SAN Analytics helps you to maintain peak performance and troubleshoot problems proactively.
Cisco MDS 9000 Series NX-OS SAN Analytics and SAN Telemetry Streaming Configuration Guide
Cisco MDS 9700 64-Gbps Fibre Channel module data sheet
Cisco MDS 9700 32-Gbps Fibre Channel module data sheet
Cisco MDS NX-OS Configuration Limits