Feedback
Contents
- Troubleshooting
- Interpreting LEDs
- Information About Interpreting LEDs
- Interpreting Controller LEDs
- Interpreting Lightweight Access Point LEDs
- System Messages
- Information About System Messages
- Viewing System Resources
- Information About Viewing System Resources
- Guidelines and Limitations
- Viewing System Resources (GUI)
- Viewing System Resources (CLI)
- Using the CLI to Troubleshoot Problems
- Configuring System and Message Logging
- Information About System and Message Logging
- Configuring System and Message Logging (GUI)
- Viewing Message Logs (GUI)
- Configuring System and Message Logging (CLI)
- Viewing System and Message Logs (CLI)
- Viewing Access Point Event Logs
- Information About Access Point Event Logs
- Viewing Access Point Event Logs (CLI)
- Uploading Logs and Crash Files
- Prerequisites to Upload Logs and Crash Files
- Uploading Logs and Crash Files (GUI)
- Uploading Logs and Crash Files (CLI)
- Uploading Core Dumps from the Controller
- Information About Uploading Core Dumps from the Controller
- Configuring the Controller to Automatically Upload Core Dumps to an FTP Server (GUI)
- Configuring the Controller to Automatically Upload Core Dumps to an FTP Server (CLI)
- Uploading Core Dumps from Controller to a Server (CLI)
- Uploading Packet Capture Files
- Information About Uploading Packet Capture Files
- Guidelines and Limitations
- Uploading Packet Capture Files (GUI)
- Uploading Packet Capture Files (CLI)
- Monitoring Memory Leaks
- Monitoring Memory Leaks (CLI)
- Troubleshooting CCXv5 Client Devices
- Information About Troubleshooting CCXv5 Client Devices
- Guidelines and Limitations
- Configuring Diagnostic Channel
- Configuring the Diagnostic Channel (GUI)
- Configuring the Diagnostic Channel (CLI)
- Configuring Client Reporting
- Configuring Client Reporting (GUI)
- Configuring Client Reporting (CLI)
- Configuring Roaming and Real-Time Diagnostics
- Configuring Roaming and Real-Time Diagnostics (CLI)
- Using the Debug Facility
- Information About Using the Debug Facility
- Configuring the Debug Facility (CLI)
- Configuring Wireless Sniffing
- Information About Wireless Sniffing
- Guidelines and Limitations
- Configuring Sniffing on an Access Point (GUI)
- Configuring Sniffing on an Access Point (CLI)
- Troubleshooting Access Points Using Telnet or SSH
- Guidelines and Limitations
- Troubleshooting Access Points Using Telnet or SSH (GUI)
- Troubleshooting Access Points Using Telnet or SSH (CLI)
- Debugging the Access Point Monitor Service
- Information About Debugging the Access Point Monitor Service
- Debugging Access Point Monitor Service Issues (CLI)
- Troubleshooting OfficeExtend Access Points
- Information About Troubleshooting OfficeExtend Access Points
- Interpreting OfficeExtend LEDs
- Positioning OfficeExtend Access Points for Optimal RF Coverage
- Troubleshooting Common Problems
Troubleshooting
Interpreting LEDs
Information About Interpreting LEDs
Interpreting Controller LEDs
See the quick start guide for your specific controller for a description of the LED patterns. See the list of controllers and the respective documentation at http://www.cisco.com/en/US/products/hw/wireless/index.html.
Interpreting Lightweight Access Point LEDs
See the quick start guide or hardware installation guide for your specific access point for a description of the LED patterns. See the list of access points and the respective documentation at http://www.cisco.com/en/US/products/hw/wireless/index.html.
System Messages
Information About System Messages
Viewing System Resources
Using the CLI to Troubleshoot Problems
If you experience any problems with your controller, you can use the commands in this section to gather information and debug issues.
Configuring System and Message Logging
Information About System and Message Logging
System logging allows controllers to log their system events to up to three remote syslog servers. The controller sends a copy of each syslog message as it is logged to each syslog server configured on the controller. Being able to send the syslog messages to multiple servers ensures that the messages are not lost due to the temporary unavailability of one syslog server. Message logging allows system messages to be logged to the controller buffer or console.
Configuring System and Message Logging (GUI)
Step 1 Choose Management > Logs > Config. The Syslog Configuration page appears. Step 2 In the Syslog Server IP Address text box, enter the IP address of the server to which to send the syslog messages and click Add. You can add up to three syslog servers to the controller. The list of syslog servers that have already been added to the controller appears below this text box.
Note If you want to remove a syslog server from the controller, click Remove to the right of the desired server.
Step 3 To set the severity level for filtering syslog messages to the syslog servers, choose one of the following options from the Syslog Level drop-down list:
- Emergencies = Severity level 0
Alerts = Severity level 1 (default value)
Critical = Severity level 2
Errors = Severity level 3
Warnings = Severity level 4
Notifications = Severity level 5
Informational = Severity level 6
Debugging = Severity level 7
If you set a syslog level, only those messages whose severity is equal to or less than that level are sent to the syslog servers. For example, if you set the syslog level to Warnings (severity level 4), only those messages whose severity is between 0 and 4 are sent to the syslog servers.
Step 4 To set the facility for outgoing syslog messages to the syslog servers, choose one of the following options from the Syslog Facility drop-down list :
- USENET = Facility level 7
- Unix-to-Unix Copy = Facility level 8
- Cron = Facility level 9
- FTP Daemon = Facility level 11
- System Use 1 = Facility level 12
- System Use 2 = Facility level 13
- System Use 3 = Facility level 14
- System Use 4 = Facility level 15
- Local Use 0 = Facility level 16
- Local Use 2 = Facility level 17
- Local Use 3 = Facility level 18
- Local Use 4 = Facility level 19
- Local Use 5 = Facility level 20
- Local Use 5 = Facility level 21
- Local Use 5 = Facility level 22
- Local Use 5 = Facility level 23
Step 5 Click Apply to commit your changes. Step 6 To set the severity level for logging messages to the controller buffer and console, choose one of the following options from both the Buffered Log Level and Console Log Level drop-down lists:
- Emergencies = Severity level 0
- Alerts = Severity level 1
- Critical = Severity level 2
- Errors = Severity level 3 (default value)
- Warnings = Severity level 4
- Notifications = Severity level 5
- Informational = Severity level 6
- Debugging = Severity level 7
- Disable— This option is available only for Console Log level. Select this option to disable console logging.
If you set a logging level, only those messages whose severity is equal to or less than that level are logged by the controller. For example, if you set the logging level to Warnings (severity level 4), only those messages whose severity is between 0 and 4 are logged.
Step 7 Select the File Info check box if you want the message logs to include information about the source file. The default value is enabled. Step 8 Select the Trace Info check box if you want the message logs to include traceback information. The default is disabled. Step 9 Click Apply to commit your changes. Step 10 Click Save Configuration to save your changes.
Configuring System and Message Logging (CLI)
Step 1 To enable system logging and set the IP address of the syslog server to which to send the syslog messages, enter this command: config logging syslog host server_IP_address
You can add up to three syslog servers to the controller.
Note To remove a syslog server from the controller, enter this command: config logging syslog host server_IP_address delete
Step 2 To set the severity level for filtering syslog messages to the syslog server, enter this command: config logging syslog level severity_level
where severity_level is one of the following:
- emergencies = Severity level 0
- alerts = Severity level 1
- critical = Severity level 2
- errors = Severity level 3
- warnings = Severity level 4
- notifications = Severity level 5
- informational = Severity level 6
- debugging = Severity level 7
Note As an alternative, you can enter a number from 0 through 7 for the severity_level parameter.
Note If you set a syslog level, only those messages whose severity is equal to or less than that level are sent to the syslog server. For example, if you set the syslog level to Warnings (severity level 4), only those messages whose severity is between 0 and 4 are sent to the syslog server.
Step 3 To set the severity level for filtering syslog messages for a particular access point or for all access points, enter this command: config ap logging syslog level severity_level {Cisco_AP | all}
where severity_level is one of the following:
- emergencies = Severity level 0
- alerts = Severity level 1
- critical = Severity level 2
- errors = Severity level 3
- warnings = Severity level 4
- notifications = Severity level 5
- informational = Severity level 6
- debugging = Severity level 7
Note If you set a syslog level, only those messages whose severity is equal to or less than that level are sent to the access point. For example, if you set the syslog level to Warnings (severity level 4), only those messages whose severity is between 0 and 4 are sent to the access point.
Step 4 To set the facility for outgoing syslog messages to the syslog server, enter this command: config logging syslog facility facility_code
where facility_code is one of the following:
- auth-private = Authorization system (private). Facility level = 10.
- cron = Cron/at facility. Facility level = 9.
- daemon = System daemons. Facility level = 3.
- ftp = FTP daemon. Facility level = 11.
- kern = Kernel. Facility level = 0.
- local0 = Local use. Facility level = 16.
- local1 = Local use. Facility level = 17.
- local2 = Local use. Facility level = 18.
- local3 = Local use. Facility level = 19.
- local4 = Local use. Facility level = 20.
- local5 = Local use. Facility level = 21.
- local6 = Local use. Facility level = 22.
- local7 = Local use. Facility level = 23.
- lpr = Line printer system. Facility level = 6.
- mail = Mail system. Facility level = 2.
- news = USENET news. Facility level = 7.
- sys12 = System use. Facility level = 12.
- sys13 = System use. Facility level = 13.
- sys14 = System use. Facility level = 14.
- sys15 = System use. Facility level = 15.
- syslog = The syslog itself. Facility level = 5.
- user = User process. Facility level = 1.
- uucp = Unix-to-Unix copy system. Facility level = 8.
Step 5 To set the severity level for logging messages to the controller buffer and console, enter these commands: where severity_level is one of the following:
- emergencies = Severity level 0
- alerts = Severity level 1
- critical = Severity level 2
- errors = Severity level 3
- warnings = Severity level 4
- notifications = Severity level 5
- informational = Severity level 6
- debugging = Severity level 7
Note As an alternative, you can enter a number from 0 through 7 for the severity_level parameter.
Note If you set a logging level, only those messages whose severity is equal to or less than that level are logged by the controller. For example, if you set the logging level to Warnings (severity level 4), only those messages whose severity is between 0 and 4 are logged.
Step 6 To save debug messages to the controller buffer, the controller console, or a syslog server, enter these commands: Step 7 To cause the controller to include information about the source file in the message logs or to prevent the controller from displaying this information, enter this command: Step 8 To cause the controller to include process information in the message logs or to prevent the controller from displaying this information, enter this command: Step 9 To cause the controller to include traceback information in the message logs or to prevent the controller from displaying this information, enter this command: Step 10 To enable or disable timestamps in log messages and debug messages, enter these commands: Step 11 To save your changes, enter this command:
Viewing Access Point Event Logs
Information About Access Point Event Logs
Access points log all system messages (with a severity level greater than or equal to notifications) to the access point event log. The event log can contain up to 1024 lines of messages, with up to 128 characters per line. When the event log becomes filled, the oldest message is removed to accommodate a new event message. The event log is saved in a file on the access point flash, which ensures that it is saved through a reboot cycle. To minimize the number of writes to the access point flash, the contents of the event log are written to the event log file during normal reload and crash scenarios only.
Viewing Access Point Event Logs (CLI)
Use these CLI commands to view or clear the access point event log from the controller:
- To see the contents of the event log file for an access point that is joined to the controller, enter this command: show ap eventlog Cisco_AP Information similar to the following appears:
AP event log download has been initiated Waiting for download to complete AP event log download completed. ======================= AP Event log Contents ===================== *Sep 22 11:44:00.573: %CAPWAP-5-CHANGED: CAPWAP changed state to IMAGE *Sep 22 11:44:01.514: %LINEPROTO-5-UPDOWN: Line protocol on Interface Dot11Radio0, changed state to down *Sep 22 11:44:01.519: %LINEPROTO-5-UPDOWN: Line protocol on Interface Dot11Radio1, changed state to down *Sep 22 11:44:53.539: *** Access point reloading. Reason: NEW IMAGE DOWNLOAD *** *Mar 1 00:00:39.078: %CAPWAP-3-ERRORLOG: Did not get log server settings from DHCP. *Mar 1 00:00:42.142: %CDP_PD-4-POWER_OK: Full power - NEGOTIATED inline power source *Mar 1 00:00:42.151: %LINK-3-UPDOWN: Interface Dot11Radio1, changed state to up *Mar 1 00:00:42.158: %LINK-3-UPDOWN: Interface Dot11Radio0, changed state to up *Mar 1 00:00:43.143: %LINEPROTO-5-UPDOWN: Line protocol on Interface Dot11Radio1, changed state to up *Mar 1 00:00:43.151: %LINEPROTO-5-UPDOWN: Line protocol on Interface Dot11Radio0, changed state to up *Mar 1 00:00:48.078: %CAPWAP-3-ERRORLOG: Could Not resolve CISCO-CAPWAP-CONTROLLER *Mar 1 00:01:42.144: %CDP_PD-4-POWER_OK: Full power - NEGOTIATED inline power source *Mar 1 00:01:48.121: %CAPWAP-3-CLIENTERRORLOG: Set Transport Address: no more AP manager IP addresses remain *Mar 1 00:01:48.122: %CAPWAP-5-CHANGED: CAPWAP changed state to JOIN *Mar 1 00:01:48.122: %LINK-5-CHANGED: Interface Dot11Radio0, changed state to administratively down *Mar 1 00:01:48.122: %LINK-5-CHANGED: Interface Dot11Radio1, changed state to administratively down- To delete the existing event log and create an empty event log file for a specific access point or for all access points joined to the controller, enter this command: clear ap-eventlog {specific Cisco_AP | all}
Uploading Logs and Crash Files
Prerequisites to Upload Logs and Crash Files
- Follow the instructions in this section to upload logs and crash files from the controller. However, before you begin, ensure you have a TFTP or FTP server available for the file upload. Follow these guidelines when setting up a TFTP or FTP server:
- If you are uploading through the service port, the TFTP or FTP server must be on the same subnet as the service port because the service port is not routable, or you must create static routes on the controller.
- If you are uploading through the distribution system network port, the TFTP or FTP server can be on the same or a different subnet because the distribution system port is routable.
- A third-party TFTP or FTP server cannot run on the same computer as WCS because the WCS built-in TFTP or FTP server and the third-party TFTP or FTP server require the same communication port.
Uploading Logs and Crash Files (GUI)
Step 1 Choose Command > Upload File. The Upload File from Controller page appears. Step 2 From the File Type drop-down list, choose one of the following: Step 3 From the Transfer Mode drop-down list, choose from the following options: Step 4 In the IP Address text box, enter the IP address of the server. Step 5 In the File Path text box, enter the directory path of the log or crash file. Step 6 In the File Name text box, enter the name of the log or crash file. Step 7 If you chose FTP as the Transfer Mode, follow these steps: Step 8 Click Upload to upload the log or crash file from the controller. A message appears indicating the status of the upload.
Uploading Logs and Crash Files (CLI)
Step 1 To transfer the file from the controller to a server, enter this command: Step 2 To specify the type of file to be uploaded, enter this command: transfer upload datatype datatype
where datatype is one of the following options:
panic-crash-file—Uploads the kernel panic information if a kernel panic occurs.
watchdog-crash-file—Uploads the console dump resulting from a software-watchdog-initiated reboot of the controller following a crash. The software watchdog module periodically checks the integrity of the internal software and makes sure that the system does not stay in an inconsistent or nonoperational state for a long period of time.
Step 3 To specify the path to the file, enter these commands: Step 4 If you are using an FTP server, also enter these commands: Step 5 To see the updated settings, enter this command: Step 6 When prompted to confirm the current settings and start the software upload, answer y.
Uploading Core Dumps from the Controller
Information About Uploading Core Dumps from the Controller
To help troubleshoot controller crashes, you can configure the controller to automatically upload its core dump file to an FTP server after experiencing a crash. You cannot upload the core dump file directly to an FTP or TFTP server but you can upload a crash file to an FTP or TFTP server. The controllers save the core dump file to flash memory following a crash.
Configuring the Controller to Automatically Upload Core Dumps to an FTP Server (GUI)
Step 1 Choose Management > Tech Support > Core Dump to open the Core Dump page. Step 2 To enable the controller to generate a core dump file following a crash, select the Core Dump Transfer check box. Step 3 To specify the type of server to which the core dump file is uploaded, choose FTP from the Transfer Mode drop-down list. Step 4 In the IP Address text box, enter the IP address of the FTP server.
Note Step 5 In the File Name text box, enter the name that the controller uses to label the core dump file. Step 6 In the User Name text box, enter the username for FTP login. Step 7 In the Password text box, enter the password for FTP login. Step 8 Click Apply to commit your changes. Step 9 Click Save Configuration to save your changes.
Configuring the Controller to Automatically Upload Core Dumps to an FTP Server (CLI)
Step 1 To enable or disable the controller to generate a core dump file following a crash, enter this command: Step 2 To specify the FTP server to which the core dump file is uploaded, enter this command: Step 3 To specify the username and password for FTP login, enter this command: config coredump username ftp_username password ftp_password Step 4 To save your changes, enter this command: save config Step 5 To see a summary of the controller’s core dump file, enter this command:
Example:Information similar to the following appears:
Information similar to the following appears:
Core Dump is enabled

FTP Server IP.................................... 10.10.10.17
FTP Filename..................................... file1
FTP Username..................................... ftpuser
FTP Password.................................. *********
Uploading Core Dumps from Controller to a Server (CLI)
Step 1 To see information about the core dump file in flash memory, enter this command: Information similar to the following appears:
Core Dump is disabled

Core Dump file is saved on flash

Sw Version.................................... 6.0.83.0
Time Stamp.................................... Wed Feb  4 13:23:11 2009
File Size..................................... 9081788
File Name Suffix........................... filename.gz
Step 2 To transfer the file from the controller to a server, enter these commands: Step 3 If you are using an FTP server, also enter these commands: Step 4 To view the updated settings, enter this command: Step 5 When prompted to confirm the current settings and start the software upload, answer y.
Uploading Packet Capture Files
Information About Uploading Packet Capture Files
When a Cisco 5500 Series Controller’s data plane crashes, it stores the last 50 packets that the controller received in flash memory. This information can be useful in troubleshooting the crash.
When a crash occurs, the controller generates a new packet capture file (*.pcap) file, and a message similar to the following appears in the controller crash file:
Last 5 packets processed at each core are stored in
 "last_received_pkts.pcap" captured file.
   - Frame 36,38,43,47,49, processed at core #0.
   - Frame 14,27,30,42,45, processed at core #1.
   - Frame 15,18,20,32,48, processed at core #2.
   - Frame 11,29,34,37,46, processed at core #3.
   - Frame 7,8,12,31,35, processed at core #4.
   - Frame 21,25,39,41,50, processed at core #5.
   - Frame 16,17,19,22,33, processed at core #6.
   - Frame 6,10,13,23,26, processed at core #7.
   - Frame 9,24,28,40,44, processed at core #8.
   - Frame 1,2,3,4,5, processed at core #9.
You can use the controller GUI or CLI to upload the packet capture file from the controller. You can then use Wireshark or another standard packet capture tool to view and analyze the contents of the file.
Guidelines and Limitations
- Only Cisco 5500 Series Controllers generate packet capture files. This feature is not available on other controller platforms.
- Ensure that you have a TFTP or FTP server available for the file upload. Follow these guidelines when setting up a TFTP or FTP server:
- If you are uploading through the service port, the TFTP or FTP server must be on the same subnet as the service port because the service port is not routable, or you must create static routes on the controller.
- If you are uploading through the distribution system network port, the TFTP or FTP server can be on the same or a different subnet because the distribution system port is routable.
- A third-party TFTP or FTP server cannot run on the same computer as WCS because the WCS built-in TFTP or FTP server and the third-party TFTP or FTP server require the same communication port.
Uploading Packet Capture Files (GUI)
Step 1 Choose Commands > Upload File to open the Upload File from Controller page. Step 2 From the File Type drop-down list, choose Packet Capture. Step 3 From the Transfer Mode drop-down list, choose from the following options: Step 4 In the IP Address text box, enter the IP address of the server. Step 5 In the File Path text box, enter the directory path of the packet capture file. Step 6 In the File Name text box, enter the name of the packet capture file. These files have a .pcap extension. Step 7 If you are using an FTP server, follow these steps:
- In the Server Login Username text box, enter the username to log into the FTP server.
- In the Server Login Password text box, enter the password to log into the FTP server.
- In the Server Port Number text box, enter the port number on the FTP server through which the upload occurs. The default value is 21.
Step 8 Click Upload to upload the packet capture file from the controller. A message appears indicating the status of the upload. Step 9 Use Wireshark or another standard packet capture tool to open the packet capture file and see the last 50 packets that were received by the controller.
Uploading Packet Capture Files (CLI)
Step 1 Log on to the controller CLI. Step 2 Enter the transfer upload mode {tftp | ftp | sftp} command. Step 3 Enter the transfer upload datatype packet-capture command. Step 4 Enter the transfer upload serverip server-ip-address command. Step 5 Enter the transfer upload path server-path-to-file command. Step 6 Enter the transfer upload filename last_received_pkts.pcap command. Step 7 If you are using an FTP server, enter these commands: Step 8 Enter the transfer upload start command to see the updated settings and then answer y when prompted to confirm the current settings and start the upload process. This example shows the upload command output: Step 9 Use Wireshark or another standard packet capture tool to open the packet capture file and see the last 50 packets that were received by the controller.
Monitoring Memory Leaks
This section provides instructions for troubleshooting hard-to-solve or hard-to-reproduce memory problems.
CautionThe commands in this section can be disruptive to your system and should be run only when you are advised to do so by the Cisco Technical Assistance Center (TAC).
Monitoring Memory Leaks (CLI)
Step 1 To enable or disable monitoring for memory errors and leaks, enter this command: config memory monitor errors {enable | disable}
The default value is disabled.
Note Your changes are not saved across reboots. After the controller reboots, it uses the default setting for this feature.
Step 2 If you suspect that a memory leak has occurred, enter this command to configure the controller to perform an auto-leak analysis between two memory thresholds (in kilobytes): config memory monitor leaks low_thresh high_thresh
If the free memory is lower than the low_thresh threshold, the system crashes, generating a crash file. The default value for this parameter is 10000 kilobytes, and you cannot set it below this value.
Set the high_thresh threshold to the current free memory level or higher so that the system enters auto-leak-analysis mode. After the free memory reaches a level lower than the specified high_thresh threshold, the process of tracking and freeing memory allocation begins. As a result, the debug memory events enable command shows all allocations and frees, and the show memory monitor detail command starts to detect any suspected memory leaks. The default value for this parameter is 30000 kilobytes.
Step 3 To see a summary of any discovered memory issues, enter this command: Information similar to the following appears:
Memory Leak Monitor Status:
low_threshold(10000), high_threshold(30000), current status(disabled)

-------------------------------------------

Memory Error Monitor Status:
Crash-on-error flag currently set to (disabled)
No memory error detected.
Step 4 To see the details of any memory leaks or corruption, enter this command: Information similar to the following appears:
Memory error detected. Details:
------------------------------------------------
-  Corruption detected at pmalloc entry address:        (0x179a7ec0)
-  Corrupt entry:headerMagic(0xdeadf00d),trailer(0xabcd),poison(0xreadceef),
entrysize(128),bytes(100),thread(Unknown task name, task id = (332096592)),
file(pmalloc.c),line(1736),time(1027)

Previous 1K memory dump from error location.
------------------------------------------------
(179a7ac0): 00000000 00000000 00000000 ceeff00d readf00d 00000080 00000000 00000000
(179a7ae0): 17958b20 00000000 1175608c 00000078 00000000 readceef 179a7afc 00000001
(179a7b00): 00000003 00000006 00000001 00000004 00000001 00000009 00000009 0000020d
(179a7b20): 00000001 00000002 00000002 00000001 00000004 00000000 00000000 5d7b9aba
(179a7b40): cbddf004 192f465e 7791acc8 e5032242 5365788c a1b7cee6 00000000 00000000
(179a7b60): 00000000 00000000 00000000 00000000 00000000 ceeff00d readf00d 00000080
(179a7b80): 00000000 00000000 17958dc0 00000000 1175608c 00000078 00000000 readceef
(179a7ba0): 179a7ba4 00000001 00000003 00000006 00000001 00000004 00000001 00003763
(179a7bc0): 00000002 00000002 00000010 00000001 00000002 00000000 0000001e 00000013
(179a7be0): 0000001a 00000089 00000000 00000000 000000d8 00000000 00000000 17222194
(179a7c00): 1722246c 1722246c 00000000 00000000 00000000 00000000 00000000 ceeff00d
(179a7c20): readf00d 00000080 00000000 00000000 179a7b78 00000000 1175608c 00000078
Step 5 If a memory leak occurs, enter this command to enable debugging of errors or events during memory allocation: debug memory {errors | events} {enable | disable}
Troubleshooting CCXv5 Client Devices
Configuring Diagnostic Channel
You can choose a diagnostic channel to troubleshoot why the client is having communication problems with a WLAN. You can test the client and access points to identify the difficulties that the client is experiencing and allow corrective measures to be taken to make the client operational on the network. You can use the controller GUI or CLI to enable the diagnostic channel, and you can use the controller CLI to run the diagnostic tests.
NoteWe recommend that you enable the diagnostic channel feature only for nonanchored SSIDs that use the management interface.
Configuring the Diagnostic Channel (GUI)
Step 1 Choose WLANs to open the WLANs page. Step 2 Create a new WLAN or click the ID number of an existing WLAN.
Note We recommend that you create a new WLAN on which to run the diagnostic tests.
Step 3 When the WLANs > Edit page appears, choose the Advanced tab to open the WLANs > Edit (Advanced) page. Step 4 If you want to enable diagnostic channel troubleshooting on this WLAN, select the Diagnostic Channel check box. Otherwise, leave this check box unselected, which is the default value.
Note You can use the CLI to initiate diagnostic tests on the client.
Step 5 Click Apply to commit your changes. Step 6 Click Save Configuration to save your changes.
Configuring the Diagnostic Channel (CLI)
Step 1 To enable diagnostic channel troubleshooting on a particular WLAN, enter this command: Step 2 To verify that your change has been made, enter this command: Information similar to the following appears:
WLAN Identifier.................................. 1
Profile Name..................................... employee1
Network Name (SSID).............................. employee
Status........................................... Disabled
MAC Filtering.................................... Disabled
Broadcast SSID................................... Enabled
AAA Policy Override.............................. Disabled
Number of Active Clients......................... 0
Exclusionlist Timeout............................ 60 seconds
Session Timeout.................................. Infinity
Interface........................................ virtual
WLAN ACL......................................... unconfigured
DHCP Server...................................... Default
DHCP Address Assignment Required................. Disabled
Quality of Service............................... Silver (best effort)
WMM.............................................. Disabled
CCX - AironetIe Support.......................... Enabled
CCX - Gratuitous ProbeResponse (GPR)............. Disabled
CCX - Diagnostics Channel Capability............. Enabled
...
Step 3 To send a request to the client to perform the DHCP test, enter this command: config client ccx dhcp-test client_mac_address
Note This test does not require the client to use the diagnostic channel.
Step 4 To send a request to the client to perform the default gateway ping test, enter this command: config client ccx default-gw-ping client_mac_address
Note This test does not require the client to use the diagnostic channel.
Step 5 To send a request to the client to perform the DNS server IP address ping test, enter this command: config client ccx dns-ping client_mac_address
Note This test does not require the client to use the diagnostic channel.
Step 6 To send a request to the client to perform the DNS name resolution test to the specified host name, enter this command: config client ccx dns-resolve client_mac_address host_name
Note This test does not require the client to use the diagnostic channel.
Step 7 To send a request to the client to perform the association test, enter this command: config client ccx test-association client_mac_address ssid bssid {802.11a | 802.11b | 802.11g} channel
Step 8 To send a request to the client to perform the 802.1X test, enter this command: config client ccx test-dot1x client_mac_address profile_id bssid {802.11a | 802.11b | 802.11g} channel
Step 9 To send a request to the client to perform the profile redirect test, enter this command: config client ccx test-profile client_mac_address profile_id
The profile_id should be from one of the client profiles for which client reporting is enabled.
Note Users are redirected back to the parent WLAN, not to any other profile. The only profile shown is the user’s parent profile. Note however that parent WLAN profiles can have one child diagnostic WLAN.
Step 10 Use these commands if necessary to abort or clear a test:
- To send a request to the client to abort the current test, enter this command: config client ccx test-abort client_mac_address Only one test can be pending at a time, so this command aborts the current pending test.
- To clear the test results on the controller, enter this command: config client ccx clear-results client_mac_address
Step 11 To send a message to the client, enter this command:
Example: config client ccx send-message client_mac_address message_idwhere message_id is one of the following:
1 = The SSID is invalid.
2 = The network settings are invalid.
3 = There is a WLAN credibility mismatch.
4 = The user credentials are incorrect.
5 = Please call support.
6 = The problem is resolved.
7 = The problem has not been resolved.
8 = Please try again later.
24 = Cancel diagnostic channel operation or select a WLAN profile to resume normal operation.
Step 12 To see the status of the last test, enter this command: show client ccx last-test-status client_mac_address Information similar to the following appears for the default gateway ping test:
Test Type........................................ Gateway Ping Test
Test Status...................................... Pending/Success/Timeout

Dialog Token..................................... 15
Timeout.......................................... 15000 ms
Request Time..................................... 1329 seconds since system boot
Step 13 To see the status of the last test response, enter this command: show client ccx last-response-status client_mac_address
Information similar to the following appears for the 802.1X authentication test:
Test Status...................................... Success

Response Dialog Token............................ 87
Response Status.................................. Successful
Response Test Type............................... 802.1x Authentication Test
Response Time.................................... 3476 seconds since system boot
Step 14 To see the results from the last successful diagnostics test, enter this command: show client ccx results client_mac_address
Information similar to the following appears for the 802.1X authentication test:
dot1x Complete................................... Success
EAP Method....................................... *1,Host OS Login Credentials
dot1x Status.................................. 255
Step 15 To see the relevant data frames captured by the client during the previous test, enter this command: show client ccx frame-data client_mac_address
Information similar to the following appears:
LOG Frames:

Frame Number:.................................... 1
Last Frame Number:............................... 1120
Direction:....................................... 1
Timestamp:....................................... 0d 00h 50m 39s 863954us
Frame Length:.................................... 197
Frame Data:
00000000: 80 00 00 00 ff ff ff ff  ff ff 00 12 44 bd bd b0  ............D...
00000010: 00 12 44 bd bd b0 f0 af  43 70 00 f2 82 01 00 00  ..D.....Cp......
00000020: 64 00 11 08 00 01 00 01  08 8c 12 98 24 b0 48 60  d...........$.H`
00000030: 6c 05 04 01 02 00 00 85  1e 00 00 89 00 0f 00 ff  l...............
00000040: 03 19 00 41 50 32 33 2d  31 30 00 00 00 00 00 00  ...AP23-10......
00000050: 00 00 00 00 00 00 26 96  06 00 40 96 00 ff ff dd  ......&...@.....
00000060: 18 00 50 f2 01 01 00 00  50 f2 05 01 00 00 50 f2  ..P.....P.....P.
00000070: 05 01 00 00 40 96 00 28  00 dd 06 00 40 96 01 01  ....@..(....@...

00000080: 00 dd 05 00 40 96 03 04  dd 16 00 40 96 04 00 02  ....@......@....
00000090: 07 a4 00 00 23 a4 00 00  42 43 00 00 62 32 00 00  ....#...BC..b2..
000000a0: dd 05 00 40 96 0b 01 dd  18 00 50 f2 02 01 01 82  ...@......P.....
000000b0: 00 03 a4 00 00 27 a4 00  00 42 43 5e 00 62 32 2f  .....'...BC^.b2/

LOG Frames:

Frame Number:.................................... 2
Last Frame Number:............................... 1120
Direction:....................................... 1
Timestamp:....................................... 0d 00h 50m 39s 878289us
Frame Length:.................................... 147
Frame Data:
00000000: 80 00 00 00 ff ff ff ff  ff ff 00 0d ed c3 a0 22  ..............."
00000010: 00 0d ed c3 a0 22 00 bd  4d 50 a5 f7 78 08 00 00  ....."..MP..x...
00000020: 64 00 01 00 00 01 00 01  08 8c 12 98 24 b0 48 60  d...........$.H`
00000030: 6c 05 04 01 02 00 00 85  1e 00 00 84 00 0f 00 ff  l...............
00000040: 03 19 00 72 6f 67 75 65  2d 74 65 73 74 31 00 00  ...rogue-test1..
00000050: 00 00 00 00 00 00 23 96  06 00 40 96 00 10 00 dd  ......#...@.....
00000060: 06 00 40 96 01 01 00 dd  05 00 40 96 03 04 dd 05  ..@.......@.....
00000070: 00 40 96 0b 01 dd 18 00  50 f2 02 01 01 81 00 03  .@......P.......

00000080: a4 00 00 27 a4 00 00 42  43 5e 00 62 32 2f 00 d2  ...'...BC^.b2/..
00000090: b4 ab 84                                          ...

LOG Frames:

Frame Number:.................................... 3
Last Frame Number:............................... 1120
Direction:....................................... 1
Timestamp:....................................... 0d 00h 50m 39s 881513us
Frame Length:.................................... 189
Frame Data:
00000000: 80 00 00 00 ff ff ff ff  ff ff 00 12 44 bd 80 30  ............D..0
00000010: 00 12 44 bd 80 30 60 f7  46 c0 8b 4b d1 05 00 00  ..D..0`.F..K....
00000020: 64 00 11 08 00 01 00 01  08 8c 12 98 24 b0 48 60  d...........$.H`
00000030: 6c 05 04 00 02 00 00 85  1e 00 00 89 00 0f 00 ff  l...............
00000040: 03 19 00 41 50 34 30 2d  31 37 00 00 00 00 00 00  ...AP40-17......
00000050: 00 00 00 00 00 00 26 dd  18 00 50 f2 01 01 00 00  ......&...P.....
00000060: 50 f2 05 01 00 00 50 f2  05 01 00 00 40 96 00 28  P.....P.....@..(
00000070: 00 dd 06 00 40 96 01 01  00 dd 05 00 40 96 03 04  ....@.......@...

00000080: dd 16 00 40 96 04 00 05  07 a4 00 00 23 a4 00 00  ...@........#...
00000090: 42 43 00 00 62 32 00 00  dd 05 00 40 96 0b 01 dd  BC..b2.....@....
000000a0: 18 00 50 f2 02 01 01 85  00 03 a4 00 00 27 a4 00  ..P..........'..
000000b0: 00 42 43 5e 00 62 32 2f  00 0b 9a 1d 6f           .BC^.b2/....o
...
Configuring Client Reporting
The client reporting protocol is used by the client and the access point to exchange client information. Client reports are collected automatically when the client associates. You can use the controller GUI or CLI to send a client report request to any CCXv5 client any time after the client associates. There are four types of client reports:
- Client profile—Provides information about the configuration of the client.
- Operating parameters—Provides the details of the client’s current operational modes.
- Manufacturers’ information—Provides data about the wireless LAN client adapter in use.
- Client capabilities—Provides information about the client’s capabilities.
Configuring Client Reporting (GUI)
Step 1 Choose Monitor > Clients to open the Clients page. Step 2 Click the MAC address of the desired client. The Clients > Detail page appears. Step 3 To send a report request to the client, click Send CCXV5 Req.
Note You must create a Trusted Profile using ACAU for Cisco CB21AG or equivalent software from your CCXv5 vendor.
Step 4 To view the parameters from the client, click Display. The Client Reporting page appears. This page lists the client profiles and indicates if they are currently in use. It also provides information on the client’s operating parameters, manufacturer, and capabilities.
Step 5 Click the link for the desired client profile. The Profile Details page appears displaying the client profile details, including the SSID, power save mode, radio channel, data rates, and 802.11 security settings.
Configuring Client Reporting (CLI)
Step 1 To send a request to the client to send its profiles, enter this command: Step 2 To send a request to the client to send its current operating parameters, enter this command: config client ccx get-operating-parameters client_mac_address
Step 3 To send a request to the client to send the manufacturer’s information, enter this command: Step 4 To send a request to the client to send its capability information, enter this command: Step 5 To clear the client reporting information, enter this command: Step 6 To see the client profiles, enter this command: Step 7 To see the client operating parameters, enter this command: Step 8 To see the client manufacturer information, enter this command: Step 9 To see the client’s capability information, enter this command: show client ccx client-capability client_mac_address
Note This command displays the client’s available capabilities, not current settings for the capabilities.
Configuring Roaming and Real-Time Diagnostics
You can use roaming and real-time logs and statistics to solve system problems. The event log enables you to identify and track the behavior of a client device. It is especially useful when attempting to diagnose difficulties that a user may be having on a WLAN. The event log provides a log of events and reports them to the access point. There are three categories of event logs:
- Roaming log—This log provides a historical view of the roaming events for a given client. The client maintains a minimum of five previous roaming events including failed attempts and successful roams.
- Robust Security Network Association ( RSNA) log—This log provides a historical view of the authentication events for a given client. The client maintains a minimum of five previous authentication attempts including failed attempts and successful ones.
- Syslog—This log provides internal system information from the client. For example, it may indicate problems with 802.11 operation, system operation, and so on.
The statistics report provides 802.1X and security information for the client. You can use the controller CLI to send the event log and statistics request to any CCXv5 client any time after the client associates.
Configuring Roaming and Real-Time Diagnostics (CLI)
Step 1 To send a log request, enter this command: Step 2 To view a log response, enter this command: show client ccx log-response log_type client_mac_address
where log_type is roam, rsna, or syslog.
Information similar to the following appears for a log response with a log_type of roam:
Tue Jun 26 18:28:48 2007  Roaming Response LogID=133: Status=Successful
                          Event Timestamp=0d 00h 00m 13s 322396us
                          Source BSSID=00:0b:85:81:06:c2, Target BSSID=00:0b:85:81:06:c2, Transition Time=3125(ms)
                          Transition Reason: Normal roam, poor link
                          Transition Result: Success
Tue Jun 26 18:28:48 2007  Roaming Response LogID=133: Status=Successful
                          Event Timestamp=0d 00h 00m 16s 599006us
                          Source BSSID=00:0b:85:81:06:c2, Target BSSID=00:0b:85:81:06:c2, Transition Time=3235(ms)
                          Transition Reason: Normal roam, poor link
                          Transition Result: Success
                          Event Timestamp=0d 00h 00m 19s 882921us
                          Source BSSID=00:0b:85:81:06:c2, Target BSSID=00:0b:85:81:06:c2, Transition Time=3234(ms)
                          Transition Reason: Normal roam, poor link
                          Transition Result: Success
Tue Jun 26 18:28:48 2007  Roaming Response LogID=133: Status=Successful
                          Event Timestamp=0d 00h 00m 08s 815477us
                          Source BSSID=00:0b:85:81:06:c2, Target BSSID=00:0b:85:81:06:d2, Transition Time=3281(ms)
                          Transition Reason: First association to WLAN
                          Transition Result: Success
                          Event Timestamp=0d 00h 00m 26s 637084us
                          Source BSSID=00:0b:85:81:06:d2, Target BSSID=00:0b:85:81:06:c2, Transition Time=3313(ms)
Information similar to the following appears for a log response with a log_type of rsna:
Tue Jun 26 18:24:09 2007  RSNA Response LogID=132: Status=Successful
                          Event Timestamp=0d 00h 00m 00s 246578us
                          Target BSSID=00:14:1b:58:86:cd
                          RSNA Version=1
                          Group Cipher Suite=00-0f-ac-02
                          Pairwise Cipher Suite Count = 1
                              Pairwise Cipher Suite 0 = 00-0f-ac-04
                          AKM Suite Count = 1
                              AKM Suite 0 = 00-0f-ac-01
                          RSN Capability = 0x0
                          RSNA Result: Success
Tue Jun 26 18:24:09 2007  RSNA Response LogID=132: Status=Successful
                          Event Timestamp=0d 00h 00m 00s 246625us
                          Target BSSID=00:14:1b:58:86:cd
                          RSNA Version=1
                          Group Cipher Suite=00-0f-ac-02
                          Pairwise Cipher Suite Count = 1
                              Pairwise Cipher Suite 0 = 00-0f-ac-04
                          AKM Suite Count = 1
                              AKM Suite 0 = 00-0f-ac-01
                          RSN Capability = 0x0
                          RSNA Result: Success
Tue Jun 26 18:24:09 2007  RSNA Response LogID=132: Status=Successful
                          Event Timestamp=0d 00h 00m 01s 624375us
                          Target BSSID=00:14:1b:58:86:cd
                          RSNA Version=1
                          Group Cipher Suite=00-0f-ac-02
                          Pairwise Cipher Suite Count = 1
                              Pairwise Cipher Suite 0 = 00-0f-ac-04
                          AKM Suite Count = 1
                              AKM Suite 0 = 00-0f-ac-01
                          RSN Capability = 0x0
	 	 	 	 	 	 RSNA Result: Success
Information similar to the following appears for a log response with a log_type of syslog:
Tue Jun 26 18:07:48 2007  SysLog Response LogID=131: Status=Successful
                          Event Timestamp=0d 00h 19m 42s 278987us
                          Client SysLog = '<11> Jun 19 11:49:47 uraval3777 Mandatory elements missing in the OID response'
                          Event Timestamp=0d 00h 19m 42s 278990us
                          Client SysLog = '<11> Jun 19 11:49:50 uraval3777 Mandatory elements missing in the OID response'
Tue Jun 26 18:07:48 2007  SysLog Response LogID=131: Status=Successful
                          Event Timestamp=0d 00h 19m 42s 278993us
                          Client SysLog = '<11> Jun 19 11:49:53 uraval3777 Mandatory elements missing in the OID response'
                          Event Timestamp=0d 00h 19m 42s 278996us
                          Client SysLog = '<11> Jun 19 11:49:56 uraval3777 Mandatory elements missing in the OID response'
Tue Jun 26 18:07:48 2007  SysLog Response LogID=131: Status=Successful
                          Event Timestamp=0d 00h 19m 42s 279000us
                          Client SysLog = '<11> Jun 19 11:50:00 uraval3777 Mandatory elements missing in the OID response'
                          Event Timestamp=0d 00h 19m 42s 279003us
                          Client SysLog = '<11> Jun 19 11:50:03 uraval3777 Mandatory elements missing in the OID response'
Tue Jun 26 18:07:48 2007  SysLog Response LogID=131: Status=Successful
                          Event Timestamp=0d 00h 19m 42s 279009us
                          Client SysLog = '<11> Jun 19 11:50:09 uraval3777 Mandatory elements missing in the OID response'
                          Event Timestamp=0d 00h 19m 42s 279012us
                          Client SysLog = '<11> Jun 19 11:50:12 uraval3777 Mandatory elements missing in the OID response'
Step 3 To send a request for statistics, enter this command: config client ccx stats-request measurement_duration stats_name client_mac_address
Step 4 To view the statistics response, enter this command: show client ccx stats-report client_mac_address
Information similar to the following appears:
Measurement duration = 1

     dot11TransmittedFragmentCount       = 1
     dot11MulticastTransmittedFrameCount = 2
     dot11FailedCount                    = 3
     dot11RetryCount                     = 4
     dot11MultipleRetryCount             = 5
     dot11FrameDuplicateCount            = 6
     dot11RTSSuccessCount                = 7
     dot11RTSFailureCount                = 8
     dot11ACKFailureCount                = 9
     dot11ReceivedFragmentCount          = 10
     dot11MulticastReceivedFrameCount    = 11
     dot11FCSErrorCount                  = 12
     dot11TransmittedFrameCount  	 	 	 	 = 13
Using the Debug Facility
Information About Using the Debug Facility
The debug facility enables you to display all packets going to and from the controller CPU. You can enable it for received packets, transmitted packets, or both. By default, all packets received by the debug facility are displayed. However, you can define access control lists (ACLs) to filter packets before they are displayed. Packets not passing the ACLs are discarded without being displayed.
Each ACL includes an action (permit, deny, or disable) and one or more fields that can be used to match the packet. The debug facility provides ACLs that operate at the following levels and on the following values:
- Driver ACL
- Ethernet header ACL
- IP header ACL
- EoIP payload Ethernet header ACL
- EoIP payload IP header ACL
- CAPWAP payload 802.11 header ACL
- CAPWAP payload IP header ACL
At each level, you can define multiple ACLs. The first ACL that matches the packet is the one that is selected.
Configuring the Debug Facility (CLI)
Step 1 To enable the debug facility, enter this command:
- debug packet logging enable {rx | tx | all} packet_count display_size where
- rx displays all received packets, tx displays all transmitted packets, and all displays both transmitted and received packets.
- packet_count is the maximum number of packets to log. You can enter a value between 1 and 65535 packets, and the default value is 25 packets.
- display_size is the number of bytes to display when printing a packet. By default, the entire packet is displayed.
Note To disable the debug facility, enter this command: debug packet logging disable.
- debug packet logging acl driver rule_index action npu_encap port where
- rule_index is a value between 1 and 6 (inclusive).
- action is permit, deny, or disable.
- npu_encap specifies the NPU encapsulation type, which determines how packets are filtered. The possible values include dhcp, dot11-mgmt, dot11-probe, dot1x, eoip-ping, iapp, ip, lwapp, multicast, orphan-from-sta, orphan-to-sta, rbcp, wired-guest, or any.
- port is the physical port for packet transmission or reception.
- Use these commands to configure packet-logging ACLs: debug packet logging acl eth rule_index action dst src type vlan where
- rule_index is a value between 1 and 6 (inclusive).
- action is permit, deny, or disable.
- dst is the destination MAC address.
- src is the source MAC address.
- type is the two-byte type code (such as 0x800 for IP, 0x806 for ARP). This parameter also accepts a few common string values such as “ip” (for 0x800) or “arp” (for 0x806).
- vlan is the two-byte VLAN ID.
- debug packet logging acl ip rule_index action src dst proto src_port dst_port where
- proto is a numeric or any string recognized by getprotobyname(). The controller supports the following strings: ip, icmp, igmp, ggp, ipencap, st, tcp, egp, pup, udp, hmp, xns-idp, rdp, iso-tp4, xtp, ddp, idpr-cmtp, rspf, vmtp, ospf, ipip, and encap.
- src_port is the UDP/TCP two-byte source port (for example, telnet, 23) or “any.” The controller accepts a numeric or any string recognized by getservbyname(). The controller supports the following strings: tcpmux, echo, discard, systat, daytime, netstat, qotd, msp, chargen, ftp-data, ftp, fsp, ssh, telnet, smtp, time, rlp, nameserver, whois, re-mail-ck, domain, mtp, bootps, bootpc, tftp, gopher, rje, finger, www, link, kerberos, supdup, hostnames, iso-tsap, csnet-ns, 3com-tsmux, rtelnet, pop-2, pop-3, sunrpc, auth, sftp, uucp-path, nntp, ntp, netbios-ns, netbios-dgm, netbios-ssn, imap2, snmp, snmp-trap, cmip-man, cmip-agent, xdmcp, nextstep, bgp, prospero, irc, smux, at-rtmp, at-nbp, at-echo, at-zis, qmtp, z3950, ipx, imap3, ulistserv, https, snpp, saft, npmp-local, npmp-gui, and hmmp-ind.
- dst_port is the UDP/TCP two-byte destination port (for example, telnet, 23) or “any.” The controller accepts a numeric or any string recognized by getservbyname(). The controller supports the same strings as those for the src_port.
- debug packet logging acl eoip-eth rule_index action dst src type vlan
- debug packet logging acl eoip-ip rule_index action src dst proto src_port dst_port
- debug packet logging acl lwapp-dot11 rule_index action dst src bssid snap_type where
- debug packet logging acl lwapp-ip rule_index action src dst proto src_port dst_port
Note To remove all configured ACLs, enter this command: debug packet logging acl clear-all.
Step 2 To configure the format of the debug output, enter this command: The debug facility supports two output formats: hex2pcap and text2pcap. The standard format used by IOS supports the use of hex2pcap and can be decoded using an HTML front end. The text2pcap option is provided as an alternative so that a sequence of packets can be decoded from the same console log file. Step 3 To determine why packets might not be displayed, enter this command: debug packet error {enable | disable} Step 4 To display the status of packet debugging, enter this command: Information similar to the following appears:
Status........................................... disabled
Number of packets to display..................... 25
Bytes/packet to display.......................... 0
Packet display format............................ text2pcap

Driver ACL:
      [1]: disabled
      [2]: disabled
      [3]: disabled
      [4]: disabled
      [5]: disabled
      [6]: disabled
   Ethernet ACL:
      [1]: disabled
      [2]: disabled
      [3]: disabled
      [4]: disabled
      [5]: disabled
      [6]: disabled
   IP ACL:
      [1]: disabled
      [2]: disabled
      [3]: disabled
      [4]: disabled
      [5]: disabled
      [6]: disabled
   EoIP-Ethernet ACL:
      [1]: disabled
      [2]: disabled
      [3]: disabled
      [4]: disabled
      [5]: disabled
      [6]: disabled
   EoIP-IP ACL:
      [1]: disabled
      [2]: disabled
      [3]: disabled
      [4]: disabled
      [5]: disabled
      [6]: disabled
   LWAPP-Dot11 ACL:
      [1]: disabled
      [2]: disabled
      [3]: disabled
      [4]: disabled
      [5]: disabled
      [6]: disabled
   LWAPP-IP ACL:
      [1]: disabled
      [2]: disabled
      [3]: disabled
      [4]: disabled
      [5]: disabled
      [6]: disabled?
Configuring Wireless Sniffing
Information About Wireless Sniffing
The controller enables you to configure an access point as a network “sniffer,” which captures and forwards all the packets on a particular channel to a remote machine that runs packet analyzer software. These packets contain information on time stamps, signal strength, packet sizes, and so on. Sniffers allow you to monitor and record network activity and to detect problems.
Guidelines and Limitations
- Supported third-party network analyzer software applications are as follows:
- The latest version of Wireshark can decode the packets by going to the Analyze mode. Select decode as, and switch UDP5555 to decode as AIROPEEK.
- You must disable IP-MAC address binding in order to use an access point in sniffer mode if the access point is joined to a Cisco 5500 Series Controller. To disable IP-MAC address binding, enter the config network ip-mac-binding disable command in the controller CLI.
- You must enable WLAN 1 in order to use an access point in sniffer mode if the access point is joined to a Cisco 5500 Series Controller. If WLAN 1 is disabled, the access point cannot send packets. Prerequisites for Wireless Sniffing
To perform wireless sniffing, you need the following hardware and software:
- A dedicated access point—An access point configured as a sniffer cannot simultaneously provide wireless access service on the network. To avoid disrupting coverage, use an access point that is not part of your existing wireless network.
- A remote monitoring device—A computer capable of running the analyzer software.
- Windows XP or Linux operating system—The controller supports sniffing on both Windows XP and Linux machines.
- Software and supporting files, plug-ins, or adapters—Your analyzer software may require specialized files before you can successfully enable
Configuring Sniffing on an Access Point (GUI)
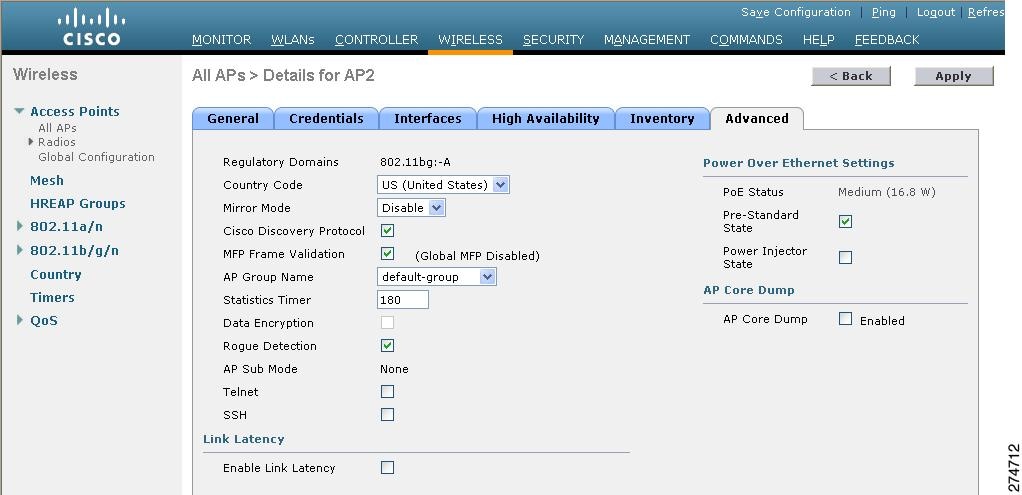
Step 1 Choose Wireless > Access Points > All APs to open the All APs page. Step 2 Click the name of the access point that you want to configure as the sniffer. The All APs > Details for page appears. Step 3 From the AP Mode drop-down list, choose Sniffer. Step 4 Click Apply to commit your changes. Step 5 Click OK when warned that the access point will be rebooted. Step 6 Choose Wireless > Access Points > Radios > 802.11a/n (or 802.11b/g/n) to open the 802.11a/n (or 802.11b/g/n) Radios page. Step 7 Hover your cursor over the blue drop-down arrow for the desired access point and choose Configure. The 802.11a/n (or 802.11b/g/n) Cisco APs > Configure page appears. Step 8 Select the Sniff check box to enable sniffing on this access point, or leave it unselected to disable sniffing. The default value is unchecked. Step 9 If you enabled sniffing in Step 8, follow these steps: Step 10 Click Apply to commit your changes. Step 11 Click Save Configuration to save your changes.
Configuring Sniffing on an Access Point (CLI)
Step 1 To configure the access point as a sniffer, enter this command: config ap mode sniffer Cisco_AP
where Cisco_AP is the access point configured as the sniffer.
Step 2 When warned that the access point will be rebooted and asked if you want to continue, enter Y. The access point reboots in sniffer mode. Step 3 To enable sniffing on the access point, enter this command: config ap sniff {802.11a | 802.11b} enable channel server_IP_address Cisco_AP
- channel is the radio channel on which the access point sniffs for packets. The default values are 36 (802.11a/n) and 1 (802.11b/g/n).
- server_IP_address is the IP address of the remote machine running Omnipeek, Airopeek, AirMagnet, or Wireshark.
- Cisco_AP is the access point configured as the sniffer.
Note To disable sniffing on the access point, enter the config ap sniff {802.11a | 802.11b} disable Cisco_AP command.
Step 4 To save your changes, enter this command: Step 5 To view the sniffer configuration settings for an access point, enter this command:
Troubleshooting Access Points Using Telnet or SSH
Information About Troubleshooting Access Points Using Telnet or SSH
The controller supports the use of the Telnet and Secure Shell (SSH) protocols to troubleshoot lightweight access points. Using these protocols makes debugging easier, especially when the access point is unable to connect to the controller.
- To avoid potential conflicts and security threats to the network, the following commands are unavailable while a Telnet or SSH session is enabled: config terminal, telnet, ssh, rsh, ping, traceroute, clear, clock, crypto, delete, fsck, lwapp, mkdir, radius, release, reload, rename, renew, rmdir, save, set, test, upgrade.
Note
For instructions on configuring Telnet or SSH SSH sessions on the controller, see the Configuring Telnet and SSH Sessions section.
- Guidelines and Limitations
- Troubleshooting Access Points Using Telnet or SSH (GUI)
- Troubleshooting Access Points Using Telnet or SSH (CLI)
Troubleshooting Access Points Using Telnet or SSH (GUI)
Step 1 Choose Wireless > Access Points > All APs to open the All APs page. Step 2 Click the name of the access point for which you want to enable Telnet or SSH. Step 3 Choose the Advanced tab to open the All APs > Details for (Advanced) page. Step 4 To enable Telnet connectivity on this access point, select the Telnet check box. The default value is unchecked. Step 5 To enable SSH connectivity on this access point, select the SSH check box. The default value is unchecked. Step 6 Click Apply to commit your changes. Step 7 Click Save Configuration to save your changes.
Troubleshooting Access Points Using Telnet or SSH (CLI)
Step 1 To enable Telnet or SSH connectivity on an access point, enter this command: config ap {telnet | ssh} enable Cisco_AP
The default value is disabled.
Note To disable Telnet or SSH connectivity on an access point, enter this command: config ap {telnet | ssh} disable Cisco_AP
Step 2 To save your changes, enter this command: Step 3 To see whether Telnet or SSH is enabled on an access point, enter this command: show ap config general Cisco_AP
Information similar to the following appears:
Cisco AP Identifier.............................. 5
Cisco AP Name.................................... AP33
Country code..................................... Multiple Countries:US,AE,AR,AT,AU,BH
Reg. Domain allowed by Country................... 802.11bg:-ABCENR 802.11a:-ABCEN
AP Country code.................................. US - United States
AP Regulatory Domain............................. 802.11bg:-A 802.11a:-A
Switch Port Number .............................. 2
MAC Address...................................... 00:19:2f:11:16:7a
IP Address Configuration......................... Static IP assigned
IP Address....................................... 10.22.8.133
IP NetMask....................................... 255.255.248.0
Gateway IP Addr.................................. 10.22.8.1
Domain...........................................
Name Server......................................
Telnet State..................................... Enabled
Ssh State........................................ Enabled
...
Debugging the Access Point Monitor Service
Information About Debugging the Access Point Monitor Service
The controller sends access point status information to the Cisco 3300 Series Mobility Services Engine (MSE) using the access point monitor service.
The MSE sends a service subscription and an access point monitor service request to get the status of all access points currently known to the controller. When any change is made in the status of an access point, a notification is sent to the MSE.
Debugging Access Point Monitor Service Issues (CLI)
If you experience any problems with the access point monitor service, enter this command:
debug service ap-monitor {all | error | event | nmsp | packet} {enable | disable}
- all configures debugging of all access point status messages.
- error configures debugging of access point monitor error events.
- event configures debugging of access point monitor events.
- nmsp configures debugging of access point monitor NMSP events.
- packet configures debugging of access point monitor packets.
- enable enables the debub service ap-monitor mode.
- disable disables the debug service ap-monitor mode.
Troubleshooting OfficeExtend Access Points
Information About Troubleshooting OfficeExtend Access Points
This section provides troubleshooting information if you experience any problems with your OfficeExtend access points.
Interpreting OfficeExtend LEDs
The LED patterns are different for 1130 series and 1140 series OfficeExtend access points. See the Cisco OfficeExtend Access Point Quick Start Guide for a description of the LED patterns. You can find this guide at this URL:
http://www.cisco.com/en/US/products/hw/wireless/index.html
Troubleshooting Common Problems
Most of the problems experienced with OfficeExtend access points are one of the following:
- The access point cannot join the controller because of network or firewall issues.Resolution: Follow the instructions in the Viewing Access Point Join Information section to see join statistics for the OfficeExtend access point, or find the access point’s public IP address and perform pings of different packet sizes from inside the company.
- The access point joins but keeps dropping off. This behavior usually occurs because of network problems or when the network address translation (NAT) or firewall ports close because of short timeouts. Resolution: Ask the teleworker for the LED status.
- Clients cannot associate because of NAT issues. Resolution: Ask the teleworker to perform a speed test and a ping test. Some servers do not return big packet pings.
- Clients keep dropping data. This behavior usually occurs because the home router closes the port because of short timeouts. Resolution: Perform client troubleshooting in WCS to determine if the problem is related to the OfficeExtend access point or the client.
- The access point is not broadcasting the enterprise WLAN. Resolution: Ask the teleworker to check the cables, power supply, and LED status. If you still cannot identify the problem, ask the teleworker to try the following:
- Connect to the home router directly and see if the PC is able to connect to an Internet website such as http://www.cisco.com/. If the PC cannot connect to the Internet, check the router or modem. If the PC can connect to the Internet, check the home router configuration to see if a firewall or MAC-based filter is enabled that is blocking the access point from reaching the Internet.
- Log on to the home router and check to see if the access point has obtained an IP address. If it has, the access point’s LED normally blinks orange.
- The access point cannot join the controller, and you cannot identify the problem. Resolution: A problem could exist with the home router. Ask the teleworker to check the router manual and try the following:
- Assign the access point a static IP address based on the access point’s MAC address.
- Put the access point in a demilitarized zone (DMZ), which is a small network inserted as a neutral zone between a company’s private network and the outside public network. It prevents outside users from getting direct access to a server that has company data.
- If problems still occur, contact your company’s IT department for assistance.
- The teleworker experiences problems while configuring a personal SSID on the access point. Resolution: Clear the access point configuration and return it to factory default settings by clicking Clear Config on the access point GUI or by entering the clear ap config Cisco_AP command and then configuring a personal SSID on an OfficeExtend Access Point. If problems still occur, contact your company’s IT department for assistance.
- The home network needs to be rebooted. Resolution: Ask the teleworker to follow these steps: Leave all devices networked and connected, and then power down all the devices. Turn on the cable or DSL modem, and then wait for 2 minutes. (Check the LED status.) Turn on the home router, and then wait for 2 minutes. (Check the LED status.) Turn on the access point, and then wait for 5 minutes. (Check the LED status.) Turn on the client.