Cisco CallManager Serviceability System Guide, Release 4.1(3)
Serviceability Reports Archive

Table Of Contents

Serviceability Reports Archive

Serviceability Reporter Service Parameters

Device Statistics Report

Server Statistics Report

Service Statistics Report

Call Activities Report

Alert Summary Report

Where to Find More Information


Serviceability Reports Archive


The Cisco Serviceability Reporter, an NT service, generates five daily reports in Cisco Serviceability Administration: Device Statistics, Server Statistics, Service Statistics, Call Activities, and Alert. Each report provides a summary that comprises different charts that display the statistics for that particular report. This service gets installed on all the Cisco CallManager nodes in the cluster. Reporter generates reports once a day on the basis of logged information.

See the following sections for detailed information about each report that Serviceability Reporter generates:

Device Statistics Report

Server Statistics Report

Service Statistics Report

Call Activities Report

Alert Summary Report

Where to Find More Information


Note Because the Cisco Serviceability Reporter is only active on the Cisco CallManager publisher, at any time, Reporter generates reports only on the publisher, not the subscriber.


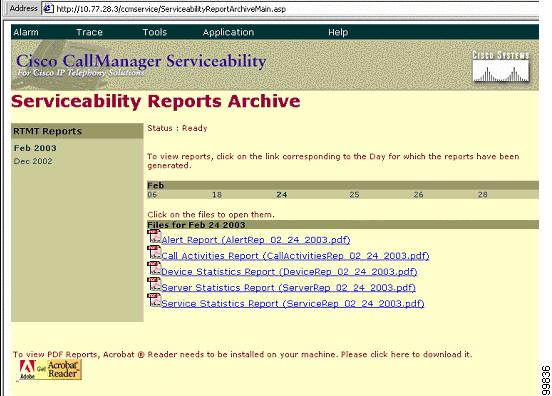
You can view reports from Cisco CallManager Serviceability > Tools > Serviceability Reports Archive.

Figure 11-1 and Figure 11-2 show examples of the Serviceability Reports Archive windows.

Figure 11-1 Cisco CallManager Serviceability Administration

Figure 11-2 Serviceability Reports Archive

You can use the Serviceability Reports Archive pages to view the Serviceability Reports that Serviceability Reporter generates. The left side pane displays the month and year for which the reports are available. You can click on the link for the month and year to view the date(s) for which reports are available. The dates for which the reports are available display as links on the right side pane. You can view all the reports that are available for the chosen date.


Note To view PDF reports, you must install Acrobat ® Reader on your machine. To download Acrobat Reader, click the link in the bottom, left corner of the pane.


The reports contain 24-hour data for the previous day. A suffix that is added to the report names shows the date for which Reporter generated them; for example, AlertRep_mm_dd_yyyy.pdf. The Serviceability Reports Archive web page uses this date to display the reports for the relevant date only. The reports generate from the data that is present in the log files, with the timestamp for the previous day. The system considers log files for the current date and the previous two days for collecting data to take into account the time zone differences between the server locations.


Note Log files can be picked up from all the Cisco CallManager nodes in the cluster while generating reports.


The time that is shown in the report reflects the publisher "System Time." If the publisher and subscriber(s) are in different time zones, the publisher "System Time" shows in the report.

Serviceability Reporter Service Parameters

Cisco Serviceability Reporter uses the following two service parameters:

Report Generation Time—The number of minutes after midnight. Reports generate at this time for the most recent day. The minimum value is 0 and the maximum value is 1439.

Report Deletion Age—The number of days that the report must be kept in the disk. The system deletes reports that are older than the specified age. The minimum value is 0 and the maximum value is 30.

For more information about service parameter configuration, refer to the Cisco CallManager Administration Guide.


Note If a server gets removed completely from the network (the server should be removed from the network and also from the list of servers in Cisco CallManager Administration), Reporter does not consider this server while generating reports, even if the log file contains the data for that server.


Device Statistics Report

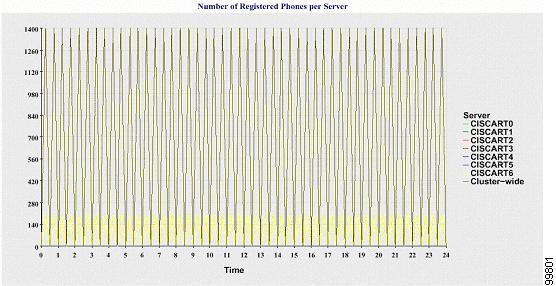
The Device Statistics Report provides the following line charts:

Number of Registered Phones per Server—A line chart displays the number of registered phones for each Cisco CallManager server and cluster. Each line in the chart represents the data for each server in the cluster (for which data is available), and one extra line displays the clusterwide data. Each data value in the chart represents the average number of phones that are registered for a 15-minute duration. In any server shows no data, Reporter does not generate the line representing that server. If no data exists for all servers, for registered phones, Reporter does not generate the chart. The message "No data for Device Statistics report available" displays.


Note You can disable reports by setting the service parameter Report Deletion Time to a value of 0.


Figure 11-3 shows an example of a line chart that represents the number of registered phones per Cisco CallManager server.

Figure 11-3 Line Chart Depicting Number of Registered Phones per Server

Number of MGCP Gateways Registered in the Cluster—A line chart displays the number of registered MGCP FXO, FXS, PRI, and T1CAS gateways. Each line represents data only for the Cisco CallManager cluster; so, there are four lines showing clusterwide details for each gateway type. Each data value in the chart represents the average number of MGCP gateways that are registered for a 15-minute duration. If no data exists for a gateway for all the servers, Reporter does not generate the line that represents data for that particular gateway. If no data exists for all gateways for all servers, Reporter does not generate the chart.

Figure 11-4 shows an example of a line chart that represents the number of registered gateways per Cisco CallManager cluster.

Figure 11-4 Line Chart Depicting Number of Registered Gateways per Cluster
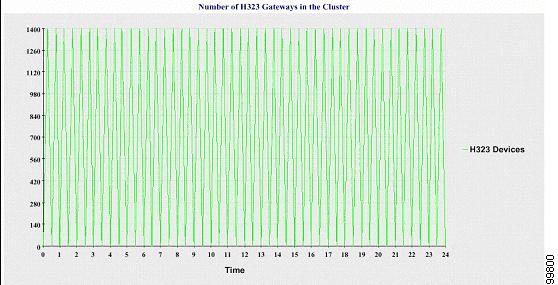
Number of of H.323 Gateways in the Cluster—A line chart displays the number of H.323 gateways. One line represents the clusterwide details of the H.323 gateways. Each data value in the chart represents the average number of H.323 gateways for a 15-minute duration. If no data exists for H.323 gateways for all servers, Reporter does not generate the chart.

Figure 11-5 shows example line chart that represents the number of H.323 gateways per Cisco CallManager cluster.

Figure 11-5 Line Chart Depicting Number of Registered H.323 Gateways per Cluster
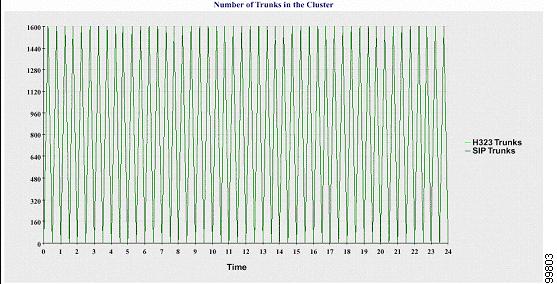
Number of Trunks in the Cluster—A line chart displays the number of H.323 and SIP trunks. Two lines represent the clusterwide details of the H.323 trunks and SIP trunks. Each data value in the chart represents the average number of H.323 and SIP trunks for a 15-minute duration. If no data exists for H.323 trunks for all servers, Reporter does not generate the line that represents data for the H.323 trunks. If no data exists for SIP trunks for all servers, Reporter does not generate the line that represents data for SIP trunks. If no data exists for trunks for all servers, Reporter does not generate the chart.

Figure 11-6 shows example line chart that represents the number of trunks per Cisco CallManager cluster.

Figure 11-6 Line Chart Depicting Number of Trunks per Cluster

You can read information from the log files from all servers in the Cisco CallManager cluster that match the file name pattern DeviceLog_mm_dd_yyyy_hh_mm.csv. The information that is read from the file for the Device Statistics report includes:

Number of registered phones on each server

Number of registered MGCP FXO, FXS, PRI, and T1CAS gateways on each server

Number of registered H.323 gateways on each server

Number of SIP trunks and H.323 trunks

Server Statistics Report

The Server Statistics Report provides the following line charts:

Percentage of CPU per Server—A line chart displays the percentage CPU usage per Cisco CallManager server. Each line in the chart represents the data for each server in the Cisco CallManager cluster (for which data is available). Each data value in the chart represents the average CPU Usage for a 15-minute duration. If no data exists for any one server, Reporter does not generate the line that represents that server. If no data exists for all servers, Reporter does not generate the chart. The message "No data for Server Statistics report available" displays.

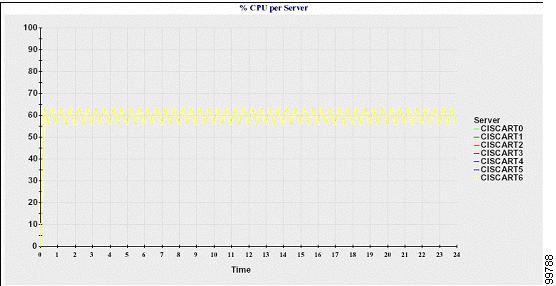
Figure 11-7 shows a line chart example that represents the percentage of CPU usage per Cisco CallManager server.

Figure 11-7 Line Chart Depicting the Percentage of CPU per Server

Percentage of Memory Usage per Server—A line chart displays the percentage Memory Usage per Cisco CallManager server (%MemoryInUse). Each line in the chart represents the data for each server in the Cisco CallManager cluster (for which data is available). Each data value in the chart represents the average memory usage for a 15-minute duraion. If no data exists for any server, Reporter does not generate the line that represents that server. If no data exists for all servers, Reporter does not generate the chart.

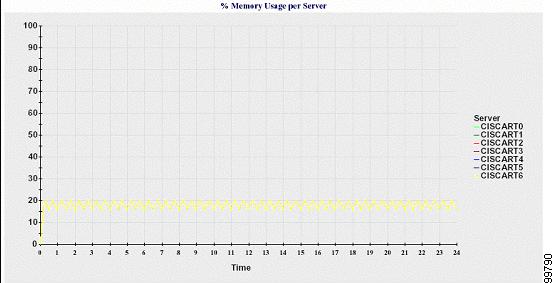
Figure 11-8 shows a line chart example that represents the percentage of memory usage per Cisco CallManager server.

Figure 11-8 Line Chart Depicting Percentage of Memory Usage per Server

Percentage of Hard Disk Usage of the Largest Partition per Server—A line chart displays the percentage of disk space usage for the largest partition per Cisco CallManager server (%DiskSpaceInUse). Each line in the chart represents the data for each server in the Cisco CallManager cluster (for which data is available). Each data value in the chart represents the average disk usage for a 15-minute duration. If no data exists for any one server, Reporter does not generate the line that represents that server. If no data exists for all servers, Reporter does not generate the chart.

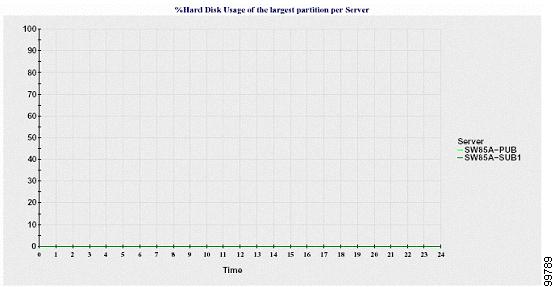
Figure 11-9 shows a line chart example that represents the percentage of hard disk usage for the largest partition per Cisco CallManager server.

Figure 11-9 Line Chart Depicting Percentage of Hard Disk Usage of the Largest Partition per Server

You can read the information from log files, from the servers in the cluster that matches the file name pattern ServerLog_mm_dd_yyyy_hh_mm.csv. The information that is read from the file for the Server Statistics report includes:

% CPU usage on each server

% Memory usage (%MemoryInUse) on each server

% Hard disk usage of the largest partition (%DiskSpaceInUse) on each server

Service Statistics Report

The Service Statistics Report provides the following line charts:

Cisco CTI Manager: Number of Open Devices—A line chart displays the number of CTI Open Devices per CTI Manager. Each line chart represents the data for each server in the Cisco CallManager cluster (on which service is activated). Each data value in the chart represents the average number of CTI open devices for a 15-minute duration. If no data exists for any one server, Reporter does not generate the line that represents that server. If no data exists for all servers, Reporter does not generate the chart. The message "No data for Service Statistics report available" displays.

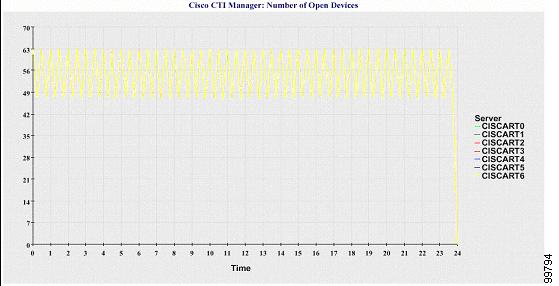
Figure 11-10 shows a line chart example that represents the number of open devices per Cisco CTI Manager.

Figure 11-10 Line Chart Depicting Cisco CTI Manager: Number of Open Devices

Cisco CTI Manager: Number of Open Lines—A line chart displays the number of CTI open lines per CTI Manager. Each line in the chart represents the data for each server in the Cisco CallManager cluster (on which service is activated). Each data value in the chart represents the average number of CTI open lines for a 15-minute duration. If no data exists for any one server, Reporter does not generate the line that represents that server. If no data exists for any of the servers, Reporter does not generate the chart.

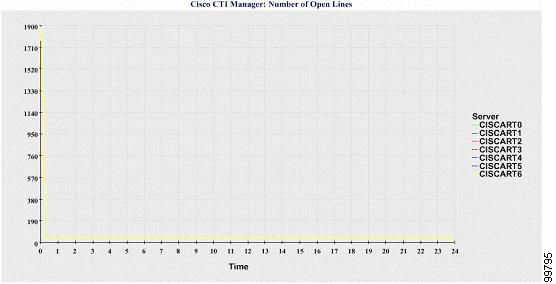
Figure 11-11 shows a line chart example that represents the number of open lines per Cisco CTI Manager.

Figure 11-11 Line Chart Depicting Cisco CTI Manager: Number of Open Lines

Cisco TFTP: Number of Requests—A line chart displays the number of Cisco TFTP requests per TFTP server. Each line in the chart represents the data for each server in the Cisco CallManager cluster (on which service is activated). Each data value in the chart represents the average number of TFTP requests for a 15-minute duration. If no data exists for any one server, Reporter does not generate the line that represents that server. If no data exists for any of the servers, Reporter does not generate the chart.

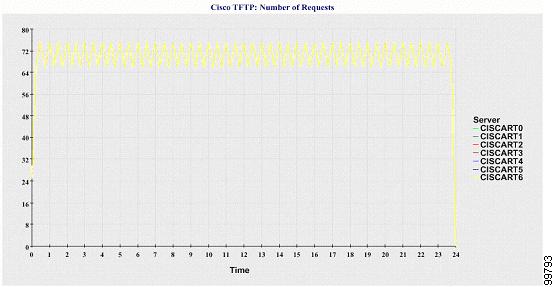
Figure 11-12 shows a line chart example that represents the number of Cisco TFTP requests per TFTP server.

Figure 11-12 Line Chart Depicting Cisco TFTP: Number of Requests

Cisco TFTP: Number of Aborted Requests—A line chart displays the number of Cisco TFTP Requests Aborted per TFTP server. Each line in the chart represents the data for each server in the Cisco CallManager cluster (on which service is activated). Each data value in the chart represents the average of TFTP Requests Aborted for a 15-minute duration. If no data exists for any one server, Reporter does not generate the line that represents that server. If no data exists for any of the servers, Reporter does not generate the chart.

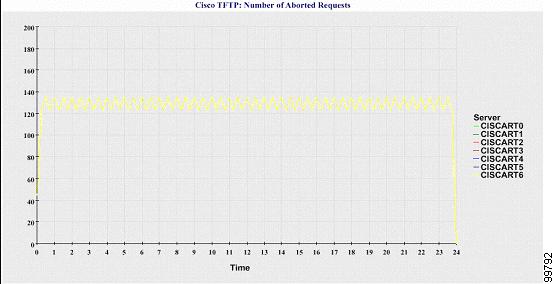
Figure 11-13 shows a line chart example that represents the number of Cisco TFTP requests that were aborted per TFTP server.

Figure 11-13 Line Chart Depicting Cisco TFTP: Number of Aborted Requests

You can read the information from log files, from all the servers of the Cisco CallManager cluster that matches the file name pattern ServiceLog_mm_dd_yyyy_hh_mm.csv. The information that is read from the file for the Service Statistics report includes:

For each CTI Manager - Number of open devices

For each CTI Manager - Number of open lines

For each Cisco TFTP server - TotalTftpRequests

For each Cisco TFTP server - TotalTftpRequestsAborted

Call Activities Report

The Call Activities Report provides the following line charts:

Cisco CallManager Call Activity for the Cluster—A line chart displays the number of calls that were attempted and calls that were completed for H.323 gateways for the entire Cisco CallManager cluster. The chart comprises two lines, one for the number of calls that were attempted and another for the number of calls that were completed. Each line represents the cluster value, which is the sum of the values for all the servers in the cluster (for which data is available). Each data value in the chart represents the total number of calls that were attempted or calls that were completed for a 15-minute duration. If no data exists for H.323 gateways calls completed for all the servers, then Reporter does not generate the line representing data for Calls Completed. In the case that there is no data for a Cisco CallManager calls completed for all the servers, Reporter does not generate the line that represents data for Calls Completed. If no data exists for Cisco CallManager calls that were attempted for all the servers, Reporter does not generate the line that represents data for Calls Attempted. If no data exists for Cisco CallManager call activities for all the servers, Reporter does not generate the chart. The message "No data for Call Activities report available" displays.

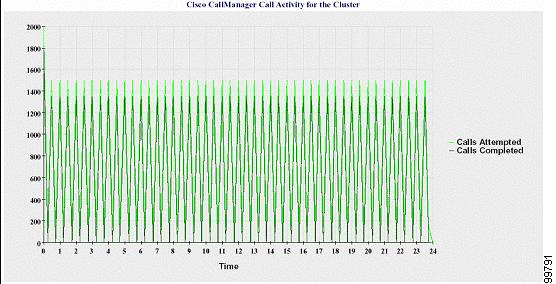
Figure 11-14 shows a line chart example that represents the number of attempted and completed calls for the Cisco CallManager cluster .

Figure 11-14 Line Chart Depicting Cisco CallManager Call Activity for the Cluster

H.323 Gateways Call Activity for the Cluster—A line chart displays the number of calls that were attempted and calls that were completed for H.323 gateways, for the entire Cisco CallManager cluster. The chart comprises two lines, one for the number of calls that were attempted and another for the number of calls that were completed. Each line represents the cluster value, which equals the sum of the values for all the servers in the cluster (for which data is available). Each data value in the chart represents the total number of calls that were attempted or calls that were completed for a 15-minute duration. If no data exists for H.323 gateways calls that were completed for all servers, Reporter does not generate the line that represents data for calls that were completed. If no data exists for H.323 gateways calls that were attempted for all servers, Reporter does not generate the line that represents data for calls that were attempted. If no data for H.323 gateways call activities for all servers, Reporter does not generate the chart.

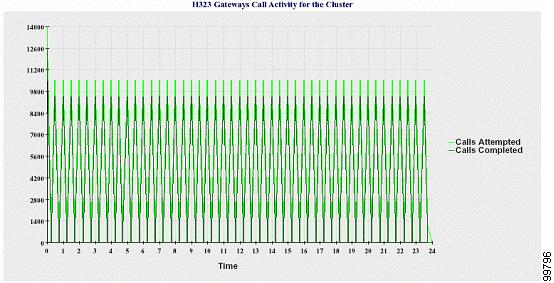
Figure 11-15 shows a line chart example that represents the H.323 gateway call activity for the Cisco CallManager cluster.

Figure 11-15 Line Chart Depicting H.323 Gateways Call Activity for the Cluster

MGCP Gateways Call Activity for the Cluster—A line chart displays the number of calls that were completed in an hour for MGCP FXO, FXS, PRI, and T1CAS gateways, for the entire Cisco CallManager cluster. The chart comprises four lines at the most, one for the number of calls that were completed for each of the gateway types (for which data is available). Each line represents the cluster value, which equals the sum of the values for all servers in the cluster (for which data is available). Each data value in the chart represents the total number of calls that were completed for a 15-minute duration. If no data exists for a gateway for all servers, Reporter does not generate the line that represents data for calls that were completed for a particular gateway. If no data exists for all gateways for all servers, Reporter does not generate the chart.

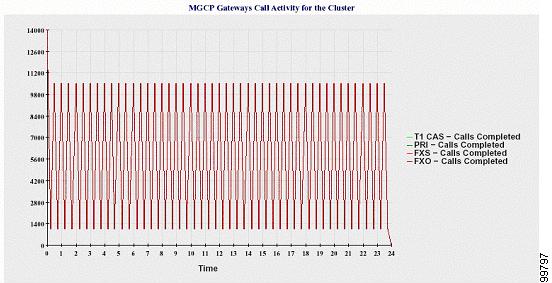
Figure 11-16 shows a line chart example that represents the MGCP gateways call activity for the Cisco CallManager cluster .

Figure 11-16 Line Chart Depicting MGCP Gateways Call Activity for the Cluster

MGCP Gateways—A line chart displays the number of Ports In Service and Active Ports for MGCP FXO, FXS gateways and the number of Spans In Service or Channels Active for PRI, T1CAS gateways for the entire Cisco CallManager cluster. The chart comprises eight lines, two lines each for the number of Ports In Service for MGCP FXO and FXS, and two lines each for the number of Active Ports for MGCP FXO and FXS. Four more lines for the number of Spans In Service and Channels Active for PRI and T1CAS gateways exist. Each line represents the cluster value, which is the sum of the values for all servers in the cluster (for which data is available). Each data value in the chart represents the total Number of Ports In Service, Number of Active Ports, Spans In Service or Channels Active for a 15-minute duration. If no data exists for the number of Spans In Service or the Channels Active for a gateway (MGCP PRI, T1CAS) for all servers, Reporter does not generate the line that represents data for that particular gateway.

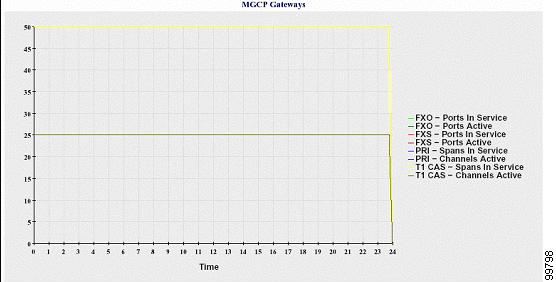
Figure 11-17 shows a line chart example that represents the MGCP gateways.

Figure 11-17 Line Chart Depicting MGCP Gateways

Trunk Call Activity for the Cluster—A line chart displays the number of calls that were completed and calls that were attempted in an hour for SIP Trunk and H.323 Trunk for the entire Cisco CallManager cluster. The chart comprises four lines, two for the number of calls that were completed for each SIP and H.323 trunk (for which data is available) and two for the number of calls that were attempted. Each line represents the cluster value, which is the sum of the values for all the servers in the cluster (for which data is available). Each data value in the chart represents the total Number of Calls Completed or Number of Calls Attempted for a 15-minute duration. If no data exists for a trunk for all servers, Reporter does not generate the line that represents data for Calls Completed or Calls Attempted for that particular trunk. If no data exists for both the trunks for all servers, Reporter does not generate the chart.

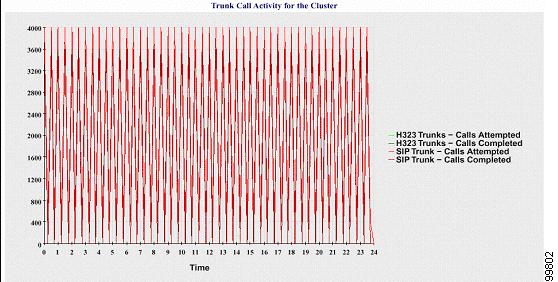
Figure 11-18 shows a line chart example that represents the trunk call activity for the cluster.

Figure 11-18 Line Chart Depicting Trunk Call Activity for the Cluster

You can read the information from log files from all servers in the cluster that matches the file name pattern CallLog_mm_dd_yyyy_hh_mm.csv. The information that is read from the file for the Call Activities report includes:

Calls Attempted and Calls Completed for the Cisco CallManager in each Cisco CallManager server

Calls Attempted and Calls Completed for the H.323 gateways in each Cisco CallManager server

Calls Completed for the MGCP FXO, FXS, PRI, and T1CAS gateways in each Cisco CallManager server

Ports In Service, Active Ports for MGCP FXO and FXS gateways and Spans In Service, Channels Active for PRI, and T1CAS gateways in each Cisco CallManager server

Calls Attempted and Calls Completed for H.323 Trunks and SIP Trunks

Alert Summary Report

The Alert Summary Report provides the details of alerts that are generated for a day. The Alert report comprises the following charts:

Number of Alerts per Server—A pie chart provides the number of alerts per Cisco CallManager server. The chart displays the server-wide details of the alerts that are generated. Each sector of the pie chart represents the number of alerts generated for a particular server in the Cisco CallManager cluster. The chart has as many number of sectors as there are servers (for which Reporter generates alerts in the day) in the cluster. If no data exists for a server, no sector in the chart that represents that server. If no data exists for all servers, Reporter does not generate the chart. The message "No alerts were generated for the day" displays.

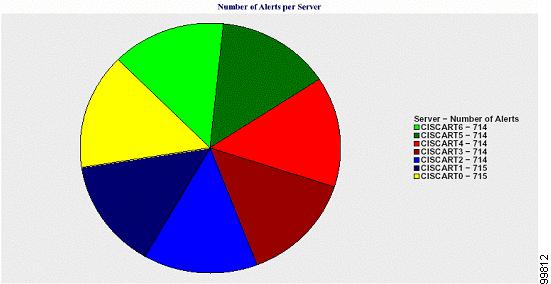
Figure 11-19 shows a pie chart example that represents the number of alerts per server.

Figure 11-19 Pie Chart Depicting Number of Alerts per Server

Number of Alerts per Severity for the Cluster—A pie chart displays the number of alerts per Alert Severity. The chart displays the severity details of the alerts that are generated. Each sector of the pie chart represents the number of alerts generated of a particular severity type. The chart provides as many number of sectors as there are severities (for which Reporter generates alerts in the day). If no data exists for a severity, no sector in the chart that represents that severity. If no data exists for all servers, Reporter does not generate the chart.

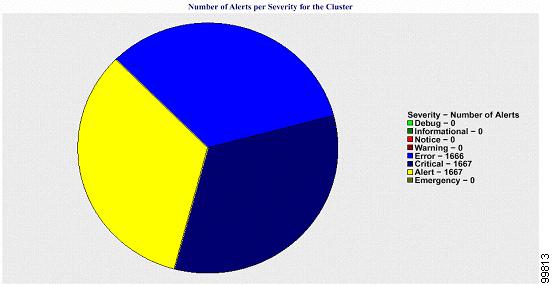
Figure 11-20 shows a pie chart example that represents the number of alerts per severity for the cluster.

Figure 11-20 Pie Chart Depicting Number of Alerts per Severity for the Cluster

Top 10 Alerts in the Cluster—A bar chart displays the number of alerts of a particular Alert Type. The chart displays the details of the alerts that are generated on the basis of the alert type. Each bar represents the number of alerts for an alert type. The chart displays details only for the first 10 alerts based on the highest number of alerts in descending order. If no data exists for a particular alert type, no bar represents that alert. If no data exists for any alert type, RTMT does not generate the chart.

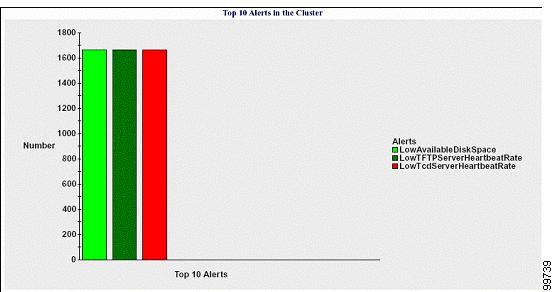
Figure 11-21 shows a bar chart example that represents the top 10 alerts in the cluster.

Figure 11-21 Bar Chart Depicting Top 10 Alerts in the Cluster

You can read the information from log files from all servers in the cluster that match the file name pattern AlertLog_mm_dd_yyyy_hh_mm.csv. The information read from the file for Alert report includes:

Time - Time at which the alert occurred

Alert Name - Descriptive name

Node Name - Server on which the alert occurred

Monitored object - The object that is monitored

Severity - Severity of this alert

Where to Find More Information

Related Topics

Chapter 9, "Real-Time Monitoring Tool"

Chapter 12, "Real-Time Monitoring Configuration," Cisco CallManager Serviceability Administration Guide

Chapter 14, "Serviceability Reports Archive Configuration," Cisco CallManager Serviceability Administration Guide