-
Cisco CallManager Serviceability System Guide, Release 3.3(3)
-
Index
-
Preface
-
Introduction
-
Objects and Counters
-
Cisco CallManager Services
-
Tools Overview
-
Service Activation
-
Control Center
-
Alarms
-
Trace
-
Real-Time Monitoring
-
Quality Report Tool
-
Microsoft Performance
-
Bulk Trace Analysis
-
CDR Analysis and Reporting
-
Remote Serviceability Overview
-
Cisco Secure Telnet
-
Show Command Line Interface
-
Simple Network Management Protocol
-
CiscoWorks2000
-
Path Analysis
-
System Log Management
-
Cisco Discovery Protocol Support
-
Cisco CallManager Perfmon Counters, RTMT, and CISCO-CCM-MIB
-
Trace Examples
-
 Feedback
Table Of Contents
Understanding Real-Time Monitoring
Performance Monitoring Hierarchy
CTI Applications Status Monitoring
RTMT Window Configuration Checklist
Understanding the RTMT Heartbeat Feature
Performance Counters Table View/Chart View
Understanding Performance Monitoring
Configure Alert Notification for Counter
Performance Monitoring Configuration Checklist
Understanding Device Monitoring
Alert Notification for Gateway Configuration
Refresh Rate for Gateway Configuration
Device Monitoring Configuration Checklist
Understanding CTI Application Monitoring
CTI Application Search and Monitor
Where to Find More Information
Real-Time Monitoring
This chapter provides information on the Real-Time Monitoring Tool (RTMT) for Cisco CallManager Serviceability and contains the following topics:
•
Understanding Real-Time Monitoring
•
•
•
•
•
•
•
•
•
•
Understanding Real-Time Monitoring
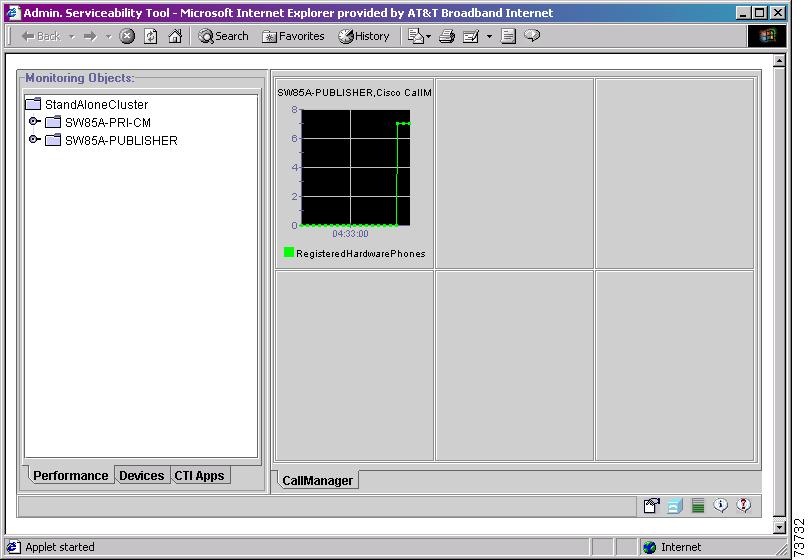
Cisco CallManager Serviceability provides a web-based tool, RTMT, that monitors real-time behavior of the components in a Cisco CallManager cluster. RTMT uses HTTP and TCP to monitor device status, system performance, device discovery, and CTI applications. It also connects directly to devices using HTTP for troubleshooting system problems.
See Figure 9-1 for an illustration of the Real-Time Monitoring window.
The following sections describe the elements that make up RTMT:
•
•
•
System Performance Monitoring
RTMT displays performance information of all Cisco CallManager components in a cluster. The tool integrates with the Cisco CallManager administration and serviceability software. The RTMT tool provides an alert notification mechanism to ease the system administrator troubleshooting tasks. It also monitors various aspects of the Cisco CallManager performance by periodically polling NT/2000 performance counter values.
Performance monitoring provides the following services:
•
•
•
•
•
Performance Monitoring Hierarchy
The Microsoft Windows 2000 operating system provides performance data that contains information for various object types, instances for each object type, and counters for each object type. The counters measure various aspects of system performance. For example, the object type, Cisco CallManager, includes the registered phones counter. The registered phones counter measures the number of registered phones. An instance designates a unique copy of a particular object type, though not all object types support multiple instances. For example, the object types Cisco CallManager or Cisco Tftp have no instances because only one CallManager or TFTP service exists on a Win2000 system. However, the Cisco Phones and Cisco Lines object types support multiple instances.
Consult Microsoft Windows documentation for more information about Windows 2000 objects and counters.
The following list defines performance monitoring hierarchy:
•
•
•
•
Each level of hierarchy supports a right-click context menu as follows:
•
•
•
Device Status Monitoring
RTMT discovers devices regardless of their registration status (for example, registered or failed to register) in the cluster. The RTMT tool searches on device name, device description, IP address, IP subnet, or DN and monitors the status of discovered devices.
Device status monitoring supports the following capabilities:
•
•
•
•
Devices Hierarchy
The following list defines device monitoring hierarchy:
•
•
Each level of hierarchy supports a right-click context menu as follows:
•
•
CTI Applications Status Monitoring
The RTMT tool allows you to monitor selected applications based on the criteria that you specify. You can choose the CTI manager; specify the application status (opened, closed, or any), application pattern, and attributes. Refer to Understanding CTI Application Monitoring for more information.
CTI Application Hierarchy
The following list defines CTI application monitoring hierarchy:
•
•
The Applications, Device, and Lines levels each support two menu choices: Monitor and CCMAdmin.
RTMT Window Overview
The RTMT window comprises the following panes:
•
•
•
Figure 9-1 Real-Time Monitoring Tool Window
See the following sections for more information on RTMT window options:
•
RTMT Default Configuration
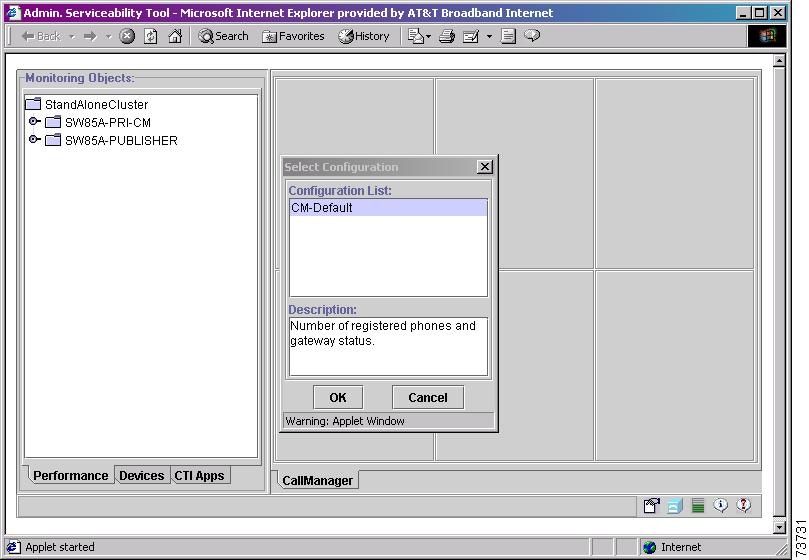
When you initially load RTMT, it comes with a default configuration called CM-Default. Dynamically created, CM-Default monitors all registered phones in all the Cisco CallManager nodes. If your cluster has five Cisco CallManager nodes configured, CM-Default displays all the registered phones for each node in the Performance Monitoring pane. See Figure 9-2.
Figure 9-2 RTMT Window With CM-Default Configuration
RTMT Window Customization
You can customize the RTMT window to contain any information that you need for troubleshooting purposes. See Preferences.
RTMT Window Configuration Checklist
Table 9-1 provides an overview of the steps for configuring the RTMT window.
Table 9-1 RTMT Window Configuration Checklist
Step 1
View existing configuration preferences.
Viewing Preferences, Cisco CallManager Serviceability Administration Guide
Step 2
Change to another configuration setting.
Changing RTMT Configuration Display, Cisco CallManager Serviceability Administration Guide
Step 3
Create a customized RTMT configuration preference.
•
•
•
•
•
•
•
•
•
•
Creating Configuration Preferences, Cisco CallManager Serviceability Administration Guide
Using Category Tabs, Cisco CallManager Serviceability Administration Guide
Adding a Counter to Monitor, Cisco CallManager Serviceability Administration Guide
Enabling Heartbeat Monitoring, Cisco CallManager Serviceability Administration Guide
Configuring Alert Notification for Heartbeat Monitoring, Cisco CallManager Serviceability Administration Guide
Enabling Directory Status, Cisco CallManager Serviceability Administration Guide
Configuring Alert Notification for Directory Status, Cisco CallManager Serviceability Administration Guide
Configuring Sample Polling Rate, Cisco CallManager Serviceability Administration Guide
Configuring Alert Notification for Counter, Cisco CallManager Serviceability Administration Guide
Understanding Device Monitoring, Cisco CallManager Serviceability Administration Guide
Configuring Alert Notification for Gateway, Cisco CallManager Serviceability Administration Guide
Cluster Information
You can view server information (such as active calls, registered phones, and memory usage) of the Cisco CallManager cluster by right-clicking a cluster name from the RTMT window and choosing properties or by clicking the CallMgr Info icon located in the RTMT window status bar.
Preferences
The Preferences icon located in the RTMT monitoring window status bar performs the following functions:
•
•
•
The Configuration preference saves the following information:
•
•
•
•
Understanding the RTMT Heartbeat Feature
Using the Preferences icon located in the RTMT monitoring window status bar, enable heartbeat monitoring. You can configure heartbeat monitoring for one or more Cisco CallManager servers in a cluster.
The Real-Time Monitoring tool monitors the Cisco CallManager heartbeat. When the heartbeat is lost, a blinking icon appears in the RTMT window status bar. To find out when the heartbeat loss was detected, click the blinking icon. An e-mail can notify you of the heartbeat loss.
Understanding Alerts
Using the Preferences icon located in the RTMT monitoring window status bar, add, edit, and delete Alert preferences. Configure Alert notification for performance counter value thresholds, schedule for alert checking, and status change of device (for example, port is out of service).
Alert Configuration Checklist
Table 9-2 provides an overview of the steps for configuring alerts.
Table 9-2 Alert Configuration Checklist
Step 1
Set up alert for counters within a category.
Creating a Category, Cisco CallManager Serviceability Administration Guide
Adding a Counter to Monitor, Cisco CallManager Serviceability Administration Guide
Configuring Alert Notification for Counter, Cisco CallManager Serviceability Administration Guide
Step 2
Set up alert for a gateway within a category.
Creating a Category, Cisco CallManager Serviceability Administration Guide
Adding Device to Monitor, Cisco CallManager Serviceability Administration Guide
Configuring Alert Notification for Gateway, Cisco CallManager Serviceability Administration Guide
Step 3
Set up alert for heartbeat monitoring.
Enabling Heartbeat Monitoring, Cisco CallManager Serviceability Administration Guide
Configuring Alert Notification for Heartbeat Monitoring, Cisco CallManager Serviceability Administration Guide
Step 4
Set up alert for directory status monitoring.
Enabling Directory Status, Cisco CallManager Serviceability Administration Guide
Configuring Alert Notification for Directory Status, Cisco CallManager Serviceability Administration Guide
Resource Usage
If the system is running slowly, or calls are not getting through, you can view Cisco CallManager resources to determine the reason for the problem. The following list comprises the different resource information you can view using Resource Usage:
•
•
•
Last 24 hr. Calls
Serviceability monitors calls attempted and calls completed every hour for 24 hours (an automatic setting). See the following Note.
Note
Process Activity
You can view the Cisco CallManager process activity resource usage.
Directory Servers
Directory servers comprise database repositories that store user and device information such as user name, password, and location. The directory settings are similar to SQL. The Cisco CallManager publisher contains the directory. Each node in the cluster has its own copy of the directory. The directory supports three types: embedded, active, and Netscape. An embedded directory resides on the same node as its associated Cisco CallManager (other types reside on other nodes in the cluster). A directory that resides on the publisher node has write permission.
You can view the directory servers connection status. Directory server connection status and replication status get checked when an alert is pending. If the server is not connected, an alert occurs. The directory server connection status gets polled every 10 minutes; replication status gets polled once every hour. While directory server status displays in the resource usage window, you can click the Refresh button to update the directory server status.
About Real-Time Monitoring
You can view the About information for the RTMT tool. The About window displays product name, client and server software versions, and third-party libraries software version information.
Help
You can view the Online Help information for Real-Time Monitoring, Serviceability or for all of Cisco CallManager.
RTMT Monitoring Pane Options
The following list contains configuration options in the RTMT monitoring pane:
•
•
•
•
Refer to "Real-Time Monitoring Configuration," in the Cisco CallManager Serviceability Administration Guide for more configuration options.
Category Tabs
A category comprises monitored performance counters. A tab in the RTMT monitoring pane contains the category name. All performance counters that are monitored in this tab belong to a category. The system polls the performance counters in the tab at the same rate, with each category configured to have its own polling rate.
You can create custom categories in the RTMT monitoring pane to view information that helps you troubleshoot specific performance or device problems. If your Cisco CallManager system is experiencing performance problems with specific objects, create custom categories to monitor the performance of the counters within the object. If the system is experiencing problems with specific devices, create custom categories to monitor the devices within the cluster. In addition, you can create alert notifications for counters and gateways in these custom categories.
To create custom categories, you add a new category tab. When the tab is created, you specify the specific performance counters, devices, and alerts within that tab and then save your custom category using Preferences.
Sample Rate
The Cisco CallManager software polls counters, devices, and gateway ports to gather status information. In the RTMT monitoring pane, you configure the polling intervals for the performance counters, devices, and gateway ports for each category tab that you create. For a description of the polling intervals for gateway ports, see Refresh Rate for Gateway Configuration.
Note
Performance Counters Table View/Chart View
The Cisco CallManager software displays performance counters in chart or table format. Chart format looks like a miniature screen of information. Up to six charts display in the RTMT performance monitoring pane for each category tab that you create. Because chart view is the default, you configure the performance counters to display in table format when you create a category.
Re-Select
To change the contents of the device monitoring pane without going to the device name in the Monitoring Objects pane, use the Re-Select option.
Understanding Performance Monitoring
You monitor the performance of the Cisco CallManager software by selecting the counters for any object. The counters for each object display when the folder is expanded.
Add a Counter to Monitor
To troubleshoot system performance problems, you add the counter associated with the performance object to the RTMT performance monitoring pane, which displays a chart for the counter. Before you add counters, see RTMT Window Overview, and Category Tabs.
Category tabs contain up to six performance counter charts.
Configure Alert Notification for Counter
Using the alert notification feature, Cisco CallManager notifies you of system problems. Perform the following configuration setup to activate alert notifications for a system counter:
•
•
•
•
•
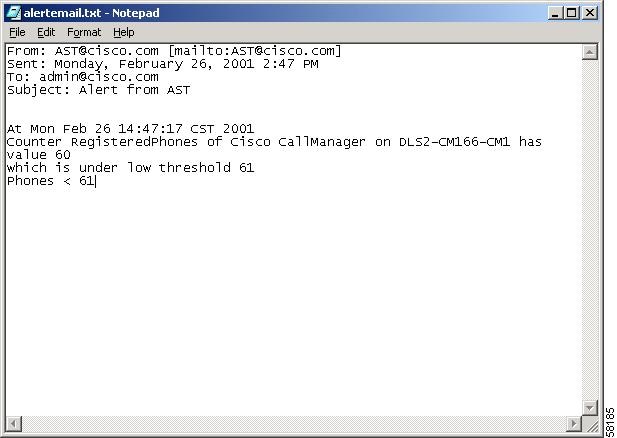
Figure 9-3 provides an example of an alert e-mail sent to the system administrator when the RegisteredPhones was below the low threshold.
Figure 9-3 Alert Notification E-Mail
Zoom Counter
To get a closer look at performance monitors, zoom the monitor counter in the RTMT performance monitoring pane.
Remove a Counter From Monitor
You remove counters from the RTMT performance monitoring pane when they are no longer needed.
Counter Properties
Counter properties provides two capabilities: display a description of the counter and configure data sampling parameters.
Property Description
Use one of two ways to obtain a description of the counter:
•
•
Data Sample
The Counter Property window contains the option to configure data samples for a counter. The performance counters displayed in the RTMT performance monitoring pane contain green dots representing samples of data over time. You can configure the number of data samples to collect and the number of data points to show in the chart. After the data sample is configured, view the information by using the View All Data/View Current Data menu selection. See View Data for a Monitor.
View Data for a Monitor
Use this view data for a monitor option to view the data collected for a performance counter. See Counter Properties, for a description of data sample configuration.
Performance Monitoring Configuration Checklist
Table 9-3 provides an overview of the steps for configuring alerts.
Table 9-3 Performance Monitoring Configuration Checklist
Step 1
Set up a category tab to monitor the performance of counters.
Creating a Category, Cisco CallManager Serviceability Administration Guide
Step 2
Choose a Cisco CallManager object/counter to monitor.
Configuring Performance Counters in Table View/Chart View, Cisco CallManager Serviceability Administration Guide
Adding a Counter to Monitor, Cisco CallManager Serviceability Administration Guide
Step 3
Activate alert notification for a counter.
Configuring Alert Notification for Counter, Cisco CallManager Serviceability Administration Guide
Understanding Device Monitoring
The Cisco CallManager Real-Time Monitoring tool monitors device activity for the following items:
•
•
•
•
•
•
RTMT monitors the following device information in real time:
•
•
•
•
•
•
•
•
Device Monitoring Pane
The device monitoring pane displays device status information in table format. Use the procedure, Alert Notification for Gateway Configuration, to display device status in the device monitoring pane.
The device monitoring pane table supports a right-click context menu for each device as follows:
•
•
•
All devices contain a description menu choice, and devices that have a built-in HTTP server contain an open menu choice.
Alert Notification for Gateway Configuration
Cisco CallManager uses the Alert Notification feature to notify you of gateway port problems. Set up alert notifications for a gateway and its ports by performing the following:
•
•
•
•
Refresh Rate for Gateway Configuration
The Cisco CallManager software polls counters, devices, and gateway ports to gather status information. In the RTMT monitoring pane, you configure the polling intervals for the performance counters, devices, and gateway ports for each category tab that you create. For a description of polling intervals for performance counters, see Sample Rate.
Device Monitoring Configuration Checklist
Table 9-4 provides an overview of the steps for configuring alerts.
Table 9-4 Device Monitoring Configuration Checklist
Step 1
Set up a category to monitor a device.
Creating a Category, Cisco CallManager Serviceability Administration Guide
Step 2
Choose the device to monitor.
Adding Device to Monitor, Cisco CallManager Serviceability Administration Guide
Step 3
Activate alert notification for a gateway.
Configuring Alert Notification for Gateway, Cisco CallManager Serviceability Administration Guide
Understanding CTI Application Monitoring
The Cisco CallManager Real-Time Monitoring tool monitors CTI application activity for the following items:
•
•
•
The following sections describe the CTI application elements:
•
CTI Apps Monitoring Pane
The CTI Apps monitoring pane displays CTI application status information in table format. The CTI Apps monitoring pane table supports a right-click context menu for each CTI application:
•
•
•
Figures 9-4 through 9-7 show examples of the CTI Apps Monitoring Panes.
CTI Application Search and Monitor
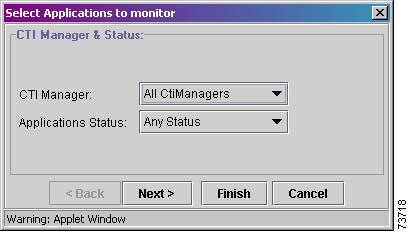
You can monitor chosen applications based on the criteria that you specify. You can choose the CTI manager and specify the application status (opened, closed, or any) and one of the following application patterns as the monitoring criteria:
•
•
•
•
•
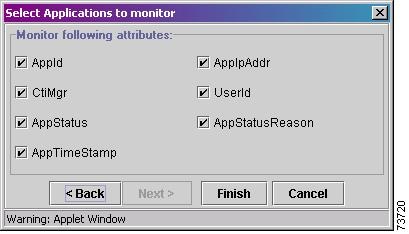
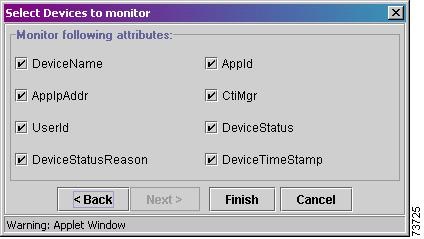
A prompt asks you to summarize the attributes that display in the search results. You can also deselect any attributes that you do not want to display.
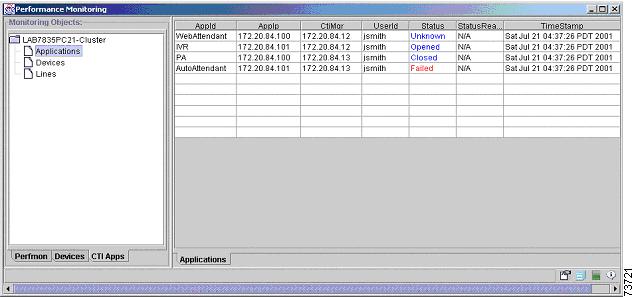
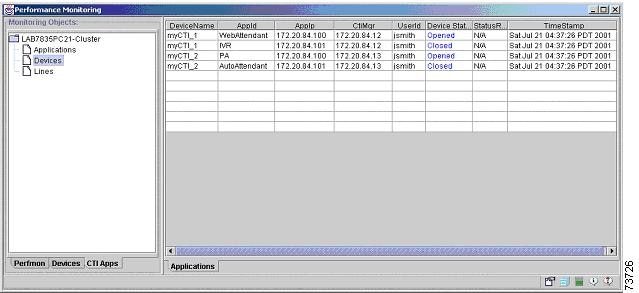
After you specify the search attributes, RTMT queries the Real-Time Information Server (RIS) for matched CTI applications. The results display in a table with a row for each matched application and a column for each attribute; a Time Stamp of provider opened/closed status displays as well. See Figure 9-4, 9-5, 9-6, and 9-7 for examples.
Figure 9-4 CTI Application Search and Monitor Example 1
Figure 9-5 CTI Application Search and Monitor Example 2
Figure 9-6 CTI Application Search and Monitor Example 3
Figure 9-7 CTI Application Search and Monitor Results Example
Device Search and Monitor
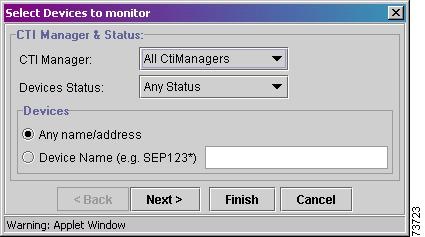
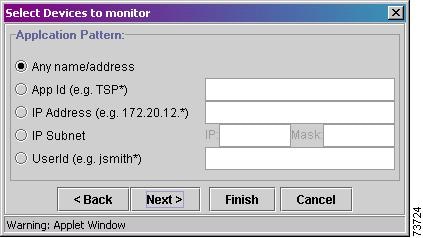
You can monitor chosen devices based on the criteria that you specify. You can choose the CTI manager and specify the device status (opened, closed, or any) device name, and one of the following application patterns as the monitoring criteria:
•
•
•
•
•
RTMT queries RIS to find the matching device. Results display in a table with a row for each matched device, a column for each of the specified attributes, and a time stamp of the device that has been opened/closed and the application that controls the device media. See Figure 9-8, 9-9, 9-10, and 9-11 for examples.
Figure 9-8 Device Search and Monitor Example 1
Figure 9-9 Device Search and Monitor Example 2
Figure 9-10 Device Search and Monitor Example 3
Figure 9-11 Device Search and Monitor Results Example
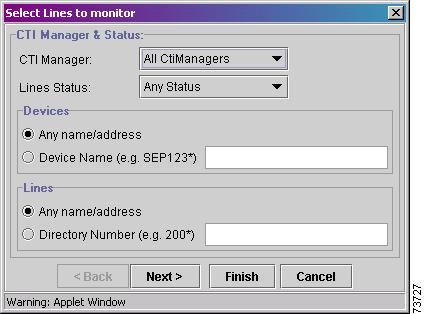
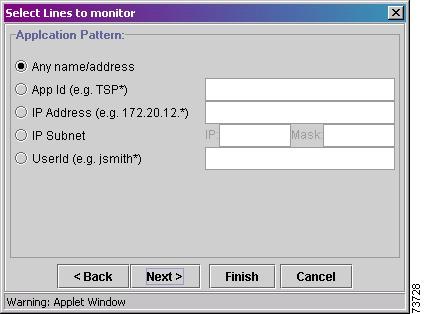
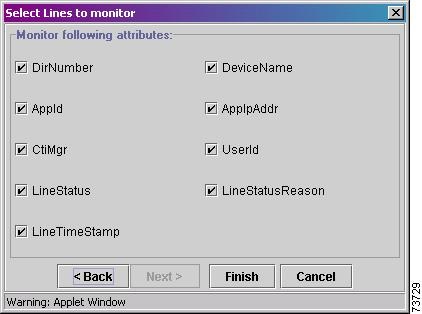
Lines Search and Monitor
You can monitor chosen lines based on the criteria that you specify. You can choose the CTI manager and specify line status (opened, closed, or any), directory number, and one of the following application patterns as the monitoring criteria:
•
•
•
•
•
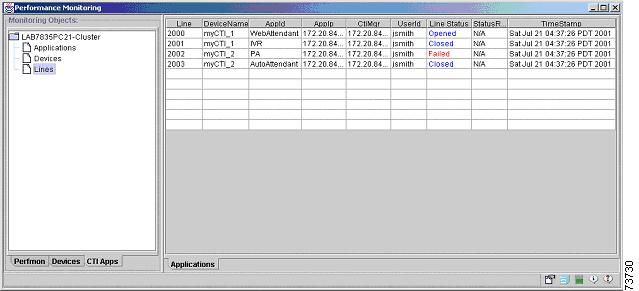
RTMT queries RIS to find matching lines. The results then display in a table with a row for each matched line, a column for each attribute, and a time stamp of the line that has been opened/closed. See Figure 9-12, 9-13, 9-14, and 9-15 for examples.
Figure 9-12 Lines Search and Monitor Example 1
Figure 9-13 Lines Search and Monitor Example 2
Figure 9-14 Lines Search and Monitor Example 3
Figure 9-15 Lines Search and Monitor Results Example
Where to Find More Information
Related Topics
•
•
•
•
•