- Preface
- New and Changed Information
- Overview
- Configuring CDP
- Configuring the Domain
- Managing Server Connections
- Managing the Configuration
- Working with Files
- Managing Users
- Configuring NTP
- Configuring Local SPAN and ERSPAN
- Configuring SNMP
- Configuring NetFlow
- Configuring System Message Logging
- Configuring iSCSI Multipath
- Configuring VSM Backup and Recovery
- Enabling vTracker
- Configuring Virtualized Workload Mobility
- Index
Cisco Nexus 1000V System Management Configuration Guide, Release 4.2(1)SV2(1.1)
Bias-Free Language
The documentation set for this product strives to use bias-free language. For the purposes of this documentation set, bias-free is defined as language that does not imply discrimination based on age, disability, gender, racial identity, ethnic identity, sexual orientation, socioeconomic status, and intersectionality. Exceptions may be present in the documentation due to language that is hardcoded in the user interfaces of the product software, language used based on RFP documentation, or language that is used by a referenced third-party product. Learn more about how Cisco is using Inclusive Language.
- Updated:
- January 18, 2016
Chapter: Enabling vTracker
Enabling vTracker
This chapter contains the following sections:
- Information About vTracker
- Guidelines and Limitations
- Default Settings for vTracker Parameters
- Enabling vTracker Globally
- Upstream View
- Virtual Machine (VM) View
- Module pNIC View
- VLAN View
- VMotion View
- Feature History for vTracker
Information About vTracker
The following illustration displays the vTracker setup diagram:
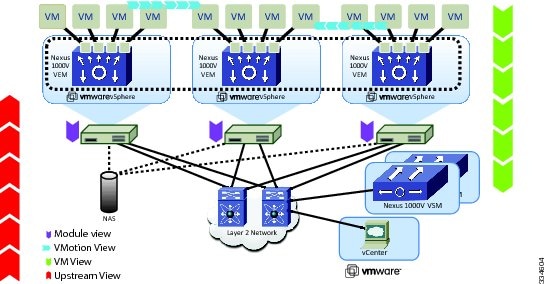
Upstream View—Provides information on all the virtual ports connected to an upstream physical switch. The view is from top of the network to the bottom.
VM View—Supports two sets of data:
Module pNIC View—Provides information about the physical network interface cards (pNIC) that are connected to each Virtual Ethernet Module (VEM).
VLAN View—Provides information about all the VMs that are connected to specific VLANs.
vMotion View—Provides information about all the ongoing and previous VM migration events.
 Note | vTracker is available with both Essential and Advanced edition of Cisco Nexus 1000V. |
Guidelines and Limitations
-
For VM and VMotion views, you should connect the Virtual Supervisor Module (VSM) with the OpenStack for the vTracker show commands to work.
-
While the Cisco Nexus 1000V switch information is validated, the information sourced by vTracker from the OpenStack is not verifiable.
Default Settings for vTracker Parameters
| Parameters | Default |
|---|---|
feature vtracker |
Disabled globally |
Enabling vTracker Globally
The following example enables vTracker:
switch# configure terminal
switch(config)# feature vtracker
switch(config)# copy running-config startup-config
Upstream View
Upstream View Overview
The upstream view provides end-to-end network information from the VM to the physical switch. The following is the upstream view set-up diagram:
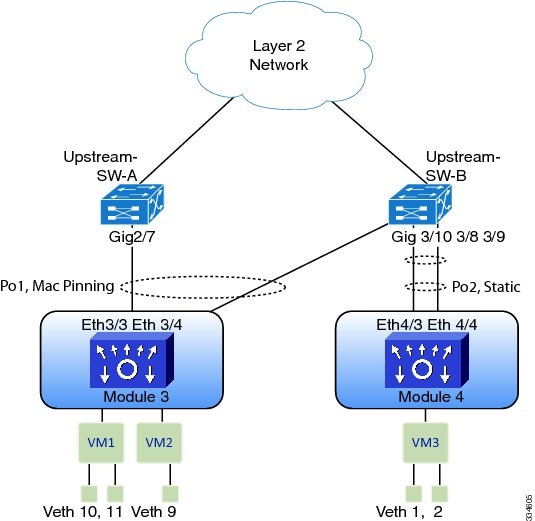
Note | Cisco Discovery Protocol (CDP) neighbor information must be accessible to generate the required upstream view output. CDP must be enabled on the hosts as well as on the VSM or the Cisco Cloud Services Platform (CSP) in order for the show vtracker upstream-view command to work. |
Displaying Upstream View
To display the upstream view, follow the given step.
Upstream View Field Description
Virtual Machine (VM) View
Virtual Machine (VM) View Overview
Note | The VSM must be connected with the vCenter in order to generate the required VM view output. You can enter the show svs connections command on the VSM to verify the connection. |
Displaying the VM vNIC View
To display the VM vNIC view, follow the given step.
The following examples show the vTracker VM vNIC view in a VSM: Example: switch(config)# show vtracker vm-view vnic
* Network: For Access interface - Access vlan, Trunk interface - Native vlan,
VXLAN interface - Segment Id.
--------------------------------------------------------------------------------
Mod VM-Name VethPort Drv Type Mac-Addr State Network Pinning
HypvPort Adapter Mode IP-Addr
--------------------------------------------------------------------------------
3 gentoo-2 Veth3 Vmxnet3 0050.56b5.37de up 339 Eth3/8
1025 Adapter 3 access n/a
3 gentoo-2 Veth4 E1000 0050.56b5.37df up 339 Eth3/8
1026 Adapter 4 access n/a
3 gentoo-2 Veth5 Vmxnet2 0050.56b5.37dd up 339 Eth3/8
1024 Adapter 2 access n/a
4 Fedora-VM1 Veth7 E1000 0050.56bb.4fc1 up 406 Eth4/3
4258 Adapter 2 pvlan 10.104.249.49
5 Fedora-VM2 Veth1 E1000 0050.56b5.098b up 1 Po9
100 Adapter 1 trunk n/a
5 Fedora-VM2 Veth2 E1000 0050.56b5.098d up 405 Po9
3232 Adapter 3 pvlan 10.104.249.60
--------------------------------------------------------------------------------
Example: switch(config)# show vtracker vm-view vnic module 4
* Network: For Access interface - Access vlan, Trunk interface - Native vlan,
VXLAN interface - Segment Id.
--------------------------------------------------------------------------------
Mod VM-Name VethPort Drv Type Mac-Addr State Network Pinning
HypvPort Adapter Mode IP-Addr
--------------------------------------------------------------------------------
4 Fedora-VM1 Veth7 E1000 0050.56bb.4fc1 up 406 Eth4/3
4258 Adapter 2 pvlan 10.104.249.49
--------------------------------------------------------------------------------
|
VM vNIC View Field Description
Column |
Description |
||
|---|---|---|---|
Mod |
Module number on which the VM resides. |
||
VM-Name |
VM name. |
||
HypvPort |
Generated port ID in the hypervisor. For VMware hypervisor, it is called the dvPort ID. |
||
VethPort |
vEthernet interface number in the Cisco Nexus 1000V switch. |
||
Adapter |
Network adapter number of the vEthernet interface. |
||
Drv Type |
|||
Mode |
|||
Mac-Addr |
MAC address of the network adapter. |
||
IP-Addr |
IPv4 address of the network adapter, if the VMware tools are installed on the OS. |
||
State |
Operational status of the network adapter. |
||
Network |
|
||
Pinning |
|
Displaying the VM Info View
To display the VM Info view, follow the given step.
The following examples show the vTracker VM Info view in a VSM: Example: switch(config)# show vtracker vm-view info Module 4: VM Name: Fedora-VM1 Guest Os: Other Linux (32-bit) Power State: Powered On VM Uuid: 421871bd-425e-c484-d868-1f65f4f1bc50 Virtual CPU Allocated: 1 CPU Usage: 1 % Memory Allocated: 256 MB Memory Usage: 1 % VM FT State: Unknown Tools Running status: Not Running Tools Version status: not installed Data Store: NFS1_4 VM Uptime: 1 day 29 minutes 46 seconds VM Name: Fedora-VM2 Guest Os: Other Linux (32-bit) Power State: Powered On VM Uuid: 4218ab37-d56d-63e4-3b00-77849401071e Virtual CPU Allocated: 1 CPU Usage: 1 % Memory Allocated: 256 MB Memory Usage: 1 % VM FT State: Unknown Tools Running status: Not Running Tools Version status: not installed Data Store: NFS1_4 VM Uptime: 58 minutes 30 seconds Module 5: VM Name: gentoo-cluster2-1 Guest Os: Other (64-bit) Power State: Powered Off VM Uuid: 4235edf5-1553-650f-ade8-39565ee3cd57 Virtual CPU Allocated: 1 CPU Usage: 0 % Memory Allocated: 512 MB Memory Usage: 0 % VM FT State: Unknown Tools Running status: Not Running Tools Version status: not installed Data Store: datastore1 (2) VM Uptime: n/a Example: switch(config)# show vtracker vm-view info vm Fedora-VM1 Module 4: VM Name: Fedora-VM1 Guest Os: Other Linux (32-bit) Power State: Powered On VM Uuid: 421871bd-425e-c484-d868-1f65f4f1bc50 Virtual CPU Allocated: 1 CPU Usage: 1 % Memory Allocated: 256 MB Memory Usage: 1 % VM FT State: Unknown Tools Running status: Not Running Tools Version status: not installed Data Store: NFS1_4 VM Uptime: 1 day 29 minutes 46 seconds |
VM Info View Field Description
Column |
Description |
|---|---|
Module |
Module number on which the VM resides. |
VM Name |
VM name. |
Guest OS |
Guest operating system name, which is running on the VM. |
Power State |
|
VM Uuid |
UUID of the VM. |
Virtual CPU Allocated |
Number of the virtual CPUs allocated for the VM. |
CPU Usage |
VM usage in percentage. |
Memory Allocated |
Memory allocated to the VM in megabytes. |
Memory Usage |
VM memory usage in percentage. |
VM FT State |
|
Tools Running status |
|
Tools Version status |
|
Data Store |
Data store name on which the VM resides. |
VM Uptime |
How long the VM has been running. |
Module pNIC View
Module pNIC View Overview
The Module pNIC View provides information about the physical network interface cards (pNICs) that are connected to each of the VEM server module in the network.
Displaying the Module pNIC View
To display the Module pNIC view, follow the given step.
The following examples show the vTracker Module pNIC view in a VSM: Example: switch(config)# show vtracker module-view pnic
-------------------------------------------------------------------------------
Mod EthIf Adapter Mac-Address Driver DriverVer FwVer
Description
-------------------------------------------------------------------------------
3 Eth3/8 vmnic7 0050.5652.f935 igb 2.1.11.1 1.4-3
Intel Corporation 82576 Gigabit Network Connection
4 Eth4/3 vmnic2 0050.565e.df74 e1000 8.0.3.2-1vmw-NAPI N/A
Intel Corporation 82546GB Gigabit Ethernet Controller
4 Eth4/4 vmnic3 0050.565e.df75 e1000 8.0.3.2-1vmw-NAPI N/A
Intel Corporation 82546GB Gigabit Ethernet Controller
--------------------------------------------------------------------------------
Example: switch(config)# show vtracker module-view pnic module 3
--------------------------------------------------------------------------------
Mod EthIf Adapter Mac-Address Driver DriverVer FwVer
Description
--------------------------------------------------------------------------------
3 Eth3/8 vmnic7 0050.5652.f935 igb 2.1.11.1 1.4-3
Intel Corporation 82576 Gigabit Network Connection
--------------------------------------------------------------------------------
|
Module pNIC View Field Description
Column |
Description |
|---|---|
Mod |
Server module name on which the VM resides. |
EthIf |
Ethernet interface ID of the server module. |
Adapter |
Ethernet adapter name as seen by the Hypervisor. |
Description |
Manufacturer name of the above adapter. |
Mac-Address |
MAC address of the Ethernet interface. |
Driver |
Driver type of the interface. |
DriverVer |
Driver version of the interface. |
FwVer |
Firmware version of the interface. |
VLAN View
VLAN View Overview
The VLAN view provides information about all the VMs that are connected to a specific VLAN or a range of VLANs. It is a view from the VLAN perspective.
Displaying the VLAN View
To display the VLAN view, follow the given step.
The following examples show the vTracker VLAN view in a VSM: Example: switch(config)# show vtracker vlan-view
* R = Regular Vlan, P = Primary Vlan, C = Community Vlan
I = Isolated Vlan, U = Invalid
--------------------------------------------------------------------------------
VLAN Type VethPort VM Name Adapter Name Mod
--------------------------------------------------------------------------------
1 R - - - -
233 R - - - -
335 R - - - -
336 R - - - -
337 R - - - -
338 R - - - -
339 R Veth3 gentoo-2 Net Adapter 3 3
Veth4 gentoo-2 Net Adapter 4 3
Veth5 gentoo-2 Net Adapter 2 3
340 R - - - -
341 R - - - -
400 R Veth1 Fedora-VM2 Net Adapter 1 5
401 R Veth1 Fedora-VM2 Net Adapter 1 5
402 R Veth1 Fedora-VM2 Net Adapter 1 5
403 R - - - -
404 P Veth6 Fedora-VM1 Net Adapter 1 4
405 C Veth2 Fedora-VM2 Net Adapter 3 5
406 I Veth7 Fedora-VM1 Net Adapter 2 4
--------------------------------------------------------------------------------
Example: switch(config)# show vtracker vlan-view vlan 233-340
* R = Regular Vlan, P = Primary Vlan, C = Community Vlan
I = Isolated Vlan, U = Invalid
--------------------------------------------------------------------------------
VLAN Type VethPort VM Name Adapter Name Mod
--------------------------------------------------------------------------------
233 R - - - -
335 R - - - -
336 R - - - -
337 R - - - -
338 R - - - -
339 R Veth3 gentoo-2 Net Adapter 3 3
Veth4 gentoo-2 Net Adapter 4 3
Veth5 gentoo-2 Net Adapter 2 3
340 R - - - -
--------------------------------------------------------------------------------
|
VLAN View Field Description
Column |
Description |
|---|---|
VLAN |
VLAN ID on which the VM resides. |
Type |
|
VethPort |
vEthernet interface port number used by the VLAN. |
VM Name |
VM name of the interface. |
Adapter Name |
Adapter name of the interface. |
Mod |
Module number on which the interface resides. |
VMotion View
VMotion View Overview
The vMotion view provides information about all the ongoing (if any) as well as previous VM migration events. However, only VMs that are currently being managed by the Cisco Nexus 1000V switch are displayed in the output.
Note | The VSM must be connected with the vCenter in order to generate the required VMotion view output. You can enter the show svs connections command on the VSM to verify the connection. |
Displaying the VMotion View
To display the VMotion view, follow the given step.
The following examples show the vTracker VMotion view in a VSM: Example: switch(config)# show vtracker vmotion-view last 20
Note: Command execution is in progress...
Note: VM Migration events are shown only for VMs currently
managed by Nexus 1000v.
* '-' = Module is offline or no longer attached to Nexus1000v DVS
----------------------------------------------------------------------------------
VM-Name Src Dst Start-Time Completion-Time
Mod Mod
----------------------------------------------------------------------------------
rk-ubt-1-0046 6 4 Mon Sep 3 10:42:27 2012 OnGoing
rk-ubt-1-0045 6 4 Mon Sep 3 10:42:27 2012 OnGoing
rk-ubt-1-0031 6 4 Mon Sep 3 10:42:27 2012 Mon Sep 3 10:44:10 2012
rk-ubt-1-0021 6 4 Mon Sep 3 10:42:27 2012 Mon Sep 3 10:43:42 2012
rk-ubt-1-0023 6 3 Thu Aug 16 14:25:26 2012 Thu Aug 16 14:27:55 2012
rk-ubt-1-0029 6 3 Thu Aug 16 14:25:26 2012 Thu Aug 16 14:27:50 2012
rk-ubt-1-0024 6 3 Thu Aug 16 14:25:26 2012 Thu Aug 16 14:26:13 2012
rk-ubt-1-0025 6 3 Thu Aug 16 14:25:26 2012 Thu Aug 16 14:26:12 2012
rk-ubt-1-0026 6 3 Thu Aug 16 14:25:26 2012 Thu Aug 16 14:26:09 2012
RHEL-Tool-VmServer - 3 Wed Aug 8 12:57:48 2012 Wed Aug 8 12:58:37 2012
----------------------------------------------------------------------------------
Example: switch(config)# show vtracker vmotion-view now
Note: Command execution is in progress...
*Note: VM Migration events are shown only for VMs currently
managed by Nexus 1000v.
* '-' = Module is offline or no longer attached to Nexus1000v DVS
---------------------------------------------------------------------------------
VM-Name Src Dst Start-Time Completion-Time
Mod Mod
---------------------------------------------------------------------------------
rk-ubt-1-0046 6 4 Mon Sep 3 10:42:27 2012 OnGoing
rk-ubt-1-0045 6 4 Mon Sep 3 10:42:27 2012 OnGoing
---------------------------------------------------------------------------------
|
VMotion View Field Description
Column |
Description |
|---|---|
VM-Name |
VM name. |
Src Mod |
Source module number of the migration. |
Dst Mod |
Destination module number of the migration. |
Start-Time |
Migration start time per the time zone defined in the Virtual Supervisor Module (VSM). |
Completion-Time |
Migration completion time in VSM time zone. For migration in progress, the status shows as “OnGoing.” |
Feature History for vTracker
Feature Name |
Releases |
Feature Information |
|---|---|---|
vTracker Views |
4.2(1)SV2(1) |
This feature was introduced. |
 Feedback